Transcription
THE BASICS OF COLORPERCEPTION AND MEASUREMENT
The Basics Of Color Perceptionand MeasurementThis is a tutorial about color perception and measurement.It is a self teaching tool that you can read at your own pace.When a slide has all information displayed, the followingsymbols will appear on the lower left side of the screenTo go back one slide click.To advance one slide click.To exit the presentation press the Escape key on yourkeyboard.
ContentsThere are five sections to this presentation:Color PerceptionColor MeasurementColor ScalesSurface Characteristics and GeometrySample Preparation and PresentationIf you wish to jump to a specific section click above on theappropriate name or click below to advance to the next slide.
COLOR PERCEPTION
Things Required To See ColorA Light SourceAn ObjectAn Observer
Visual Observing SituationLIGHT SOURCEOBSERVEROBJECT
Visual Observing SituationThe visual observing model shows the three itemsnecessary to perceive color.To build an instrument that can quantify humancolor perception, each item in the visual observingsituation must be represented as a table ofnumbers.
Light Source
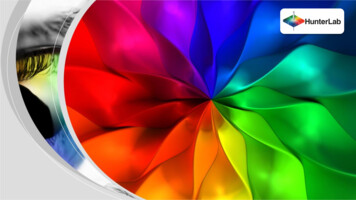
Light SourceA light source emits white light.When light is dispersed by a prism, all visiblewavelengths can be seen.
Sunlight Spectrum
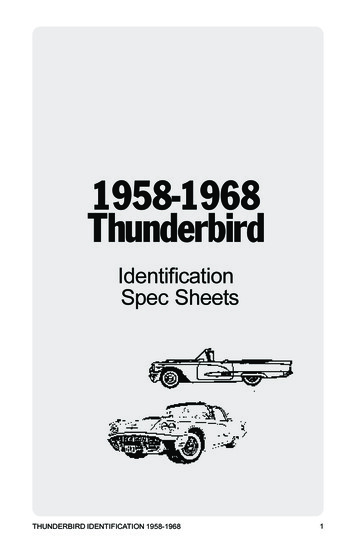
Light SourceVisible light is a small part of the electromagneticspectrum.The wavelength of light is measured in nanometers(nm).The CIE wavelength range of the visible spectrum isfrom 360 to 780 nm.A plot of the relative energy of light at eachwavelength creates a spectral power distributioncurve quantifying the characteristics of the lightsource.
Spectral PowerDistribution of SunlightULTRAVIOLETVISIBLE aylight100500360500600Wavelength - Nanometers [nm]780
Light Source versus IlluminantA light source is a physical source of light.A CIE illuminant is a standard table of numbersrepresenting relative energy versus wavelength for thespectral characteristics of light sources.
Light Source versus ghtEλEλEλD65F2A400400500600Wavelength [nm]700500600Wavelength [nm]400500600Wavelength [nm]700700
Some Common IlluminantsAIncandescentCAverage DaylightD65Noon DaylightF2Cool White Fluorescent
CIE IlluminantBy representing a light source as an illuminant,the spectral characteristics of the first elementof the Visual Observing Situation have beenquantified and standardized.
D65
Object
ObjectObjects modify light.Colorants such as pigments or dyes, in theobject, selectively absorb some wavelengths ofthe incident light while reflecting or transmittingothers.
Light Interaction withSchool Bus PaintS pecularReflectionIncidentLightDiffuseReflection
ObjectThe amount of light, reflected or transmittedby the object at each wavelength can bequantified.This can be represented as a spectral curve.
Spectrophotometric Curvefor “School Bus Yellow”% Relative Reflectance1007550250400500600Wavelength – [Nanometers]700
ObjectBy measuring the relative reflectance ortransmission characteristics of an object, thesecond element of the Visual Observing Situationhas been quantified.
ReflectanceD65
Observer
Human ObserverRods in the eye are responsible for low lightvision.Cones in the eye are responsible for colorvision and function at higher light levels.The three types of cone sensitivities are red,green and blue.
The Human EyeLightRetinaLightRetina
CIE Standard ObserverExperiments were conducted to quantify the ability of thehuman eye to perceive color.A human observer looked at a white screen through anaperture having a 2 degree field of view.Half of a screen was illuminated by a test light.The observer adjusted the amount of three primarycolored lights on the other half of the screen until theymatched the test light color.This process was repeated for colors across the visiblespectrum.
Determination of StandardColorimetric ObserverREDUC TIONS C REENREDG REENBLUEBLAC K PARTITIONWHITEBAC KDROP2ºTES TFILTERTES TLIG HT
CIE Standard Observer y, and z functionsThe experimentally derived x,became the CIE 1931 2º Standard Observer.These functions quantify the red, green and bluecone sensitivity of the average human observer.
CIE 2º Standard ObserverTristimulus Values2.0-zy1.5-x1.00.50.0400500600Wavelength – [Nanometers]700
ObserverWhen the 1931 2º Standard Observer experimentswere conducted, it was thought that the coneconcentration was only in the fovea region.Later it was determined that the cones were spreadbeyond the fovea.The experiments were re-done in 1964, resulting inthe 1964 10º Standard Observer.
2º and 10º Observer15”3”2º10º7 Feet
2º versus 10º CIE Standard ObserverTristimulus Values2.0-z-1.5y-x1.00.50.0400500600Wavelength – [Nanometers]700
CIE Recommended ObserverOf the two observers, the CIE recommends the 10ºStandard Observer. It best correlates with averagevisual assessments made with large fields of view,typical of most commercial applications.
ObserverThe three elements of the Visual ObservingSituation have now been quantified as tables ofnumbers.The Light Source is a user-selected CIE illuminant.The Object is quantified by measuring thereflectance or transmission.The Observer is represented by a CIE StandardObserver.
D65ReflectanceCIE Standard Observer
COLOR MEASUREMENT
Things RequiredTo See ColorTo Measure ColorLightS ourceLightS ourceObjectS ampleObserverS pectrophotometer
Color MeasurementThe CIE X,Y, Z tristimulus color values areobtained by multiplying the illuminant, thereflectance or transmittance of the object, andthe standard observer functions.The product is then summed for all wavelengths inthe visible spectrum to give the resulting X, Y, Ztristimulus values.
CIE X TristimulusCIE x ObserverC IE Illuminant D65C IE x O bserverVisual S timulusXC IE X Tristimulus X 41.9X CIE y ObserverC IE y O bserverReflec tanc eY TristimulusC IE Y CIETristimulus XCIE Z TristimulusY 37.7C IE z O bserverC IE Z TristimulusCIE z Observer Z 8.6XX 41.9Y 37.7Z 8.6
Measuring ColorA Colorimetric Spectrophotometer uses a light source toilluminate the sample being measured.The light reflected by the object passes to a gratingwhich breaks it into its spectral components.This sample signal falls onto a diode array, measuringthe amount of light at each wavelength.The spectral data is sent to the processor where it ismultiplied with user-selected illuminant and observertables to obtain CIE X, Y, Z color values.
Measuring ColorS ampleDiode ArrayDiffraction G ratingLightS ourceData ProcessorX 41.9Y 37.7Z 8.6Data Display
HunterLab Spectrophotometer Systems LabScan XE MiniScan EZUltraScan VIS ColorFlex EZ ColorQuest XT UltraScan PRO ColorQuest XE
COLOR SCALES
Visual Organization of ColorAll colors are organized in three dimensions: Lightness,Chroma or Saturation , and Hue.
Visual Organization of ColorHUEHUELIGHTNESSLIGHTNESSWhiteSATURATION (CHROMA)BlackSATURATION
Measured Color ValuesVisual evaluation of color is subjective andapproximate.Measuring color using an instrument providesobjective and precise results that correlate tohuman perception.
“School Bus Yellow”Measured ValuesX 41.9Y 37.7Z 8.6
Color ScalesIn terms of object color, X, Y, Z values are not easilyunderstood. Other color scales have been developed to:Better relate how we perceive color.Simplify understanding.Improve communication of color.Better represent uniform color differences.
Opponent-Colors TheoryStates red, green and blue cone responses areremixed into opponent coders as they move upthe optic nerve to the brain.
Opponent-Colors RECEPTORCODERRED-GREENCODERRED RECEPTOR
Opponent-Colors TheoryWhen the next slide appears, focus on the blackcross in the center of the stripes until the slideautomatically changes to the white screen (afterabout 20 seconds).
Opponent-Colors TheoryDid you see the stripes as red, white and blue?This happens because the green, black and yellow stripessaturate the cone responses.When you look at the blank screen your vision tries to return tobalance and you see a red, white and blue after-image.This demonstration supports the Opponent-Colors Theory
Hunter L,a,b Color SpaceHunter L,a,b color space is a 3-dimensional rectangular colorspace based on Opponent-Colors Theory.L (lightness) axis - 0 is black, 100 is white, and50 is middle graya (red-green) axis - positive values are red,negative values are green, and 0 is neutralb (blue-yellow) axis - positive values are yellow,negative values are blue, and 0 is neutral
Hunter L,a,b Color Space
Hunter L, a, b Color SpaceAll colors can be represented in L, a, brectangular color space.The following slide shows where “school busyellow” falls in Hunter L, a, b color space.
WHITEYELLOW 100 40 30 90 80G REEN 20 70 10 60RED-10-20-30-20-30-10-40BLUE 10 20 30 10LIG HTNES S0BLAC KL 61.4a 18.1b 32.2
Hunter L, a, b Values for“School Bus Yellow”L 61.4a 18.1b 32.2
L, a, b Color ScalesThere are two popular L,a,b color scales in usetoday: Hunter L,a,b and CIE L*,a*,b*.While similar in organization, a color will havedifferent numerical values in these two colorspaces.
Hunter L, a, b versus CIE L*,a*, b*Hunter L, a, b (1958)L 61.42a 18.11b 32.23CIE L*,a*,b* (1976)L * 67.81a* 19.56b* 58.16
L, a, b Color ScalesHunter L, a, b and CIE L*,a*,b* scales are bothmathematically derived from CIE X, Y, Z values.Neither scale is visually uniform. Hunter L, a, b is overexpanded in the blue region of color space and CIEL*,a*,b* is over expanded in the yellow region.The current CIE recommendation is to use L*,a*,b*.
Calculation of Color FormulasHunter L, a, bL 100 (Y/Yn)1/2CIE L*, a*, b*L* 116 (Y/Yn)1/3 - 16a Ka (X/Xn - Y/Yn)(Y/Yn)1/2a* 500 [(X/Xn)1/3 - (Y/Yn)1/3 ]b Kb (Y/Yn - Z/Zn )(Y/Yn)1/2b* 200 [(Y/Yn)1/3 - (Z/Zn)1/3 ]
What is an Acceptable ColorDifference?Maximum AcceptableMinimum Perceptible
What is an Acceptable ColorDifference?What is an acceptable color difference varies withthe application.For example:What is acceptable for color matching ofautomotive paint is close to being a minimumperceptible limit.What is acceptable for snack foods is greater andthe maximum acceptable limit defines thetolerance for the product.
Rectangular L*, a*, b* Color DifferencesColor Differences are always calculated asSAMPLE - STANDARD values.If delta L* is positive; the sample is lighter than thestandard.If negative; it would be darker than the standard.If delta a* is positive; the sample is more red (or lessgreen)than the standard.If negative; it would be more green (or less red).If delta b* is positive; the sample is more yellow (or lessblue) than the standard.If negative; it would be more blue (or less yellow).
Rectangular L*, a*, b* Color DifferencesSAMPLESTANDARDCOLORDIFFERENCESL*a*b* 71.9 10.2 58.1L*a*b* 69.7 12.7 60.5 L* a* b* 2.2-2.5-2.4
Delta E* (Total Color Difference)Δ E* is based on L*,a*,b* color differences andwas intended to be a single number metric forPASS/FAIL decisions.
Delta E* (Total Color Difference)Sam.L*a*b*E* (L*)2 (a*)2 (b*)2Std.
SURFACE CHARACTERISTICS& GEOMETRY
Reflectance of LightFor opaque materials most of the incident light is reflected.Color is seen in the diffuse reflection and gloss is seen in thespecular reflection.The reflection at the specular angle is generally the greatestamount of light reflected at any single angle.However, specular reflection represents less than 4% of totalreflected light.The remaining reflection is diffuse reflection.
Reflectance of LightIncident LightDiffuseReflectionSpecularReflection
Effect of Surface Texture onPerceived ColorSamples that are exactly the same color, but havedifferent surface textures, will appear different.Glossy surfaces appear darker and more saturated.Matte and textured surfaces appear lighter andless saturated.
Effect of Surface Texture onPerceived ColorRoughGlossyMatte
Effect of Surface Texture on Perceived ColorIncreased surface roughness affects perceived colorsuch that it appears lighter and less saturated.This is caused by mixing diffuse reflectance (where wesee pigment color) with increased scatter fromspecular reflectance (white).The rougher the surface, the greater the scatter of thespecular reflectance.
Light Distribution From DifferentSurfacesMatteSemi-GlossHigh Gloss
Instrument GeometryInstrument geometry defines the arrangement of lightsource, sample plane and detector.There are two general categories of instrumentgeometries:Directional (45º/0º or 0º/45º) and diffuse (d/8º sphere).
Directional GeometryDirectional 45º/0º geometry has illumination at a 45ºangle and measurement at 0º.The inverse 0º/45º geometry has illumination at 0º andmeasurement at 45º.Both exclude the specular reflection in the measurement(specular excluded).This provides measurements that correspond to visualchanges in sample appearance due to either changesin pigment color or surface texture.
Directional 45º/0º and 0º/45º Geometry45º Illumination/0º MeasureS pectrophotometer0º Illumination / 45º MeasureS ourceS pectrophotometerS ourceS pecularS pecular0º0º45º45ºDiffuseDiffuseS pecimenDiffuseDiffuseS pecimen
Gloss Effect on Color DifferenceMeasurementOn the following slide the paint on the card is the same color acrossthe entire card. The right side has a matte surface finish and the left sidehas a high gloss finish.The color difference measurement, made using a directionalinstrument, indicates a color difference that agrees with visualevaluation (the matte side is lighter and less red).Directional instruments measure both the effect of the pigment and theeffect of the surface finish. They are appropriate for quality controlapplications where agreement with what you see is important.
Gloss Effect on Color DifferenceMeasurementGlossyMatteDirectional 0º/45º GeometrySpecular Excluded L*1.4 a*-1.5 b*-1.2
A 0º/45º GeometrySpectrophotometerLabS can XE
Diffuse GeometryDiffuse (sphere) geometry instruments use a white coated sphereto diffusely illuminate the sample with 8º (d/8º) viewing.Measurements on a diffuse sphere instrument can be taken withthe specular included or excluded.
Diffuse GeometrySpecular Included measurements negate surface differencesand provide values which correspond to changes in color.Specular Excluded measurements negate specular reflectanceon very smooth surfaces, measuring only diffuse reflectance.Most measurements are taken in the specular included mode.
Sphere Geometry d/8ºS pecular IncludedS pectrophotometerS ampleS pecular ExcludedS pectrophotometerS ample
Gloss Effect on Color DifferenceMeasurementOn the next slide measurements were taken on the same card, usinga diffuse d/8º sphere instrument.The specular included measurement indicates no color difference.It quantifies only colorant differences and negates differences insurface finishes.In the specular excluded mode, the readings quantify appearancedifferences, similar to those from the 0º/45º instrument.
Gloss Effect on Color DifferenceMeasurementGlossyMatteSphere GeometrySpecular IncludedSpecular Excluded L*0.01.8 a*0.1-1.6 b*-0.0-0.9
Texture Effect onColor Difference MeasurementLight TextureHeavy TextureSphere GeometrySpecular IncludedSpecular Excluded L*0.12.0 a*-0.10.5 b*0.11.0 L*5.2 a*1.8 b*2.50º/45º GeometrySpecular Excluded
Sphere Geometry for TransmissionSphere geometry instruments also have the ability tomeasure the color of transmitted light.Color is seen primarily in Regular Transmission which transmitsstraight through transparent solids and liquids.Surface texture or internal scattering within the material cancause the light to scatter or diffuse.Diffuse Transmission also contains color of the material.Total Transmission is a combination of regular plus diffusetransmission.
Transmission of ransmissionIncidentLightTotal Transmission
Sphere Instrument Measuring in TransmissionC olorQuest XE
SAMPLE PREPARATION& PRESENTATION
Ideal Sample For ColorMeasurementOpaque or transparentSolidFlatSmoothUniform
Sample Preparation andPresentation Choose samples that are representative of the product. Prepare the sample in a way to best approximate theideal sample characteristics. Prepare samples in the same way each time. Present the samples to the instrument in a repeatablemanner. Take multiple readings of the sample for an averagemeasurement.
Examples of Sample Preparation andPresentation
Thank YouIf you are connected to the internet click:For more information about sample preparationand presentationFor product informationvisit our website at www.hunterlab.comorcontact us at info@hunterlab.com
HunterLab 2015
Light Source Visible light is a small part of the electromagnetic spectrum. The wavelength of light is measured in nanometers (nm). The CIE wavelength range of the visible spectrum is from 360 to 780 nm. A plot of the relative energy of light at each wavelength creates a spectral power distribution curve quan