Transcription
Stock assessment of Queensland east coast blueswimmer crab (Portunus armatus)2020
This publication has been compiled by R. Lovett, M. F. O’Neill and A. Garland., Fisheries Queensland, Department ofAgriculture and Fisheries State of Queensland, 2020The Queensland Government supports and encourages the dissemination and exchange of its information. The copyright inthis publication is licensed under a Creative Commons Attribution 4.0 International (CC BY 4.0) licence.Under this licence you are free, without having to seek our permission, to use this publication in accordance with the licenceterms.You must keep intact the copyright notice and attribute the State of Queensland as the source of the publication.Note: Some content in this publication may have different terms as indicated.For more information on this licence, visit creativecommons.org/licenses/by/4.0.The information contained herein is subject to change without notice. The Queensland Government shall not be liable fortechnical or other errors or omissions contained herein. The reader/user accepts all risks and responsibility for losses,damages, costs and other consequences resulting directly or indirectly from using this information
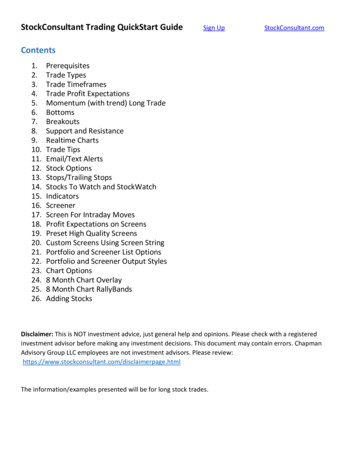
SummaryBlue swimmer crabs are widely distributed in Australia. They are found along the western coast ofAustralia, across Australia’s north and down the east coast to the New South Wales–Victoria border.They are also found in the warmer waters of the South Australian gulfs. They inhabit bays, estuariesand some offshore areas to depths of around 60 m (Kailola et al. 1993).Blue swimmer crabs are mature from around 9 to 10 cm carapace width. They can live for around 3 to4 years and can grow to a maximum size of approximately 20 cm (Sumpton et al. 2003). InQueensland, the current minimum legal size is 11.5 cm carapace width and harvest is restricted tomales only.Over the last five years, the Queensland east coast blue swimmer crab total harvest averaged around394 tonnes (t) per year (Figure 1). During this time, average harvest shares were made up of 366 tcommercial (from logbook data), and 28 t recreational (from recreational survey data). Indigenous andcharter sector harvests were negligible with few data available; hence these sectors did not form partof this assessment.Figure 1: Blue swimmer crab harvest (retained catch) from commercial and recreational sectors for Queenslandeast coast from 1988–89 to 2018–19Commercial catch rates were standardised to estimate an index of legal-sized male blue swimmercrab abundance through time (Figure 2). The blue swimmer crab catch rate (kg per ‘fisher-day’) wasstandardised to account for variation in catch associated with year, month, region, lunar phase,number of pots and combinations of these data.
Figure 2: Annual commercial standardised catch rates for Queensland east coast blue swimmer crab fisheryA previous stock assessment for the southern component of the north eastern Australian(Queensland) biological stock was published in 2015. Results estimated exploitable (legal-sized malecrab) biomass between 25 and 50 per cent of virgin unfished exploitable biomass.This stock assessment used a length-structured model with a monthly time step. Data inputs includedtotal harvests, standardised catch rates, and carapace width size compositions The data inputs werestructured for Inshore Region (smaller crab) and Offshore Region (larger crab) size selectivity.Model analyses suggested that exploitable biomass fell to around 33 per cent of unfished biomass in2018–19 (Figure 3). Maximum sustainable yield (MSY) was estimated at 631–843 t per year and theyield consistent with maintaining a biomass ratio of 60 per cent was estimated at 415–557 t.
Figure 3: Annual exploitable biomass relative to virgin biomass for Queensland east coast blue swimmer crabThis report informs estimates of sustainable harvests to ensure the fishery operates at sustainablelevels, for commercial and recreational fishing, and support the harvest strategy defined inQueensland’s Sustainable Fisheries Strategy 2017–2027 (Department of Agriculture and Fisheries2017). Results presented in this report reflect the quality and quantity of data available.Recommended biological harvests were estimated for fishery management and harvest strategygoals and endpoints (Table 1). Estimates were based on the 2018–19 exploitable biomass. The blueswimmer crab harvest control rule recommends an initial harvest limit of 129 t to begin rebuilding thestock to levels consistent with 60% of unfished biomass.Table 1: Description of current and target harvest indicatorsIndicatorEstimateCurrent exploitable biomass (relative to unfished) 2018–201933%MSY exploitable biomass/unfished biomass (relative to unfished)23%Current harvest in 2018–19240 tAverage 5 year harvest (2014–15 to 2018–19)394 tHarvest at MSY722 tHarvest at 60 per cent exploitable biomass476 tInitial harvest to build to 60 per cent biomass129 t
Table of contentsAcknowledgements . 1Glossary . 21 Introduction . 32 Methods. 62.1 Data sources . 62.1.1 Commercial . 62.1.2 Recreational . 72.1.3 Indigenous . 72.1.4 Charter . 72.1.5 Historical . 72.1.6 Fishery-dependent survey . 72.1.7 Fishery-independent beam trawl survey . 72.1.8 Boat ramp survey . 82.2 Harvest estimates . 82.3 Abundance indices . 92.3.1 Commercial catch rates . 92.3.2 Fishery-independent beam trawl survey . 102.4 Biological information . 102.5 Population model . 122.5.1 Model assumptions . 122.5.2 Population dynamics . 132.5.3 Matching predictions to data . 152.5.4 Model parameters . 162.5.5 Model uncertainty . 162.5.6 Forward projections . 173 Results . 183.1 Model inputs . 183.1.1 Harvest . 183.1.2 Abundance indices . 193.2 Model outputs . 213.2.1 Parameters . 213.2.2 Model fits . 223.2.3 Biomass estimates . 223.2.4 Targets . 243.2.5 Projections . 254 Discussion . 264.1 Stock status . 264.2 Performance of the population model . 264.3 Recommendations . 264.3.1 Monitoring . 27
4.3.2 Management. 274.3.3 Assessment . 274.4 Conclusions . 27References . 28Appendix A - Inshore and Offshore Regions . 31Appendix B - Selection of daily commercial catch rate data . 32Appendix C - Regional catch rates . 35Appendix D - Size Composition . 38D.1 Commercial sampling . 38D.2 Fishery-independent beam trawl sampling . 40Appendix E - Parameter analysis . 41E.1 Trace plots . 41E.2 Barycentric coordinates . 45Appendix F - Model fits. 46F.1 Catch rate fits . 46F.2 Size composition fits . 46Appendix G - Monthly exploitable biomass . 49Appendix H - Projection scenarios . 50
AcknowledgementsThis work was overseen by a project team that consisted of the authors and the following scientistsand managers: James Webley, Simon Barry, Carlie Heaven, Sam Williams, Eddie Jebreen and SueHelmke. The role of the committee was collaborative to share interpretation and decision making oninformation and review final results.In addition to the role of the project team, we would like to thank Carlie Heaven for the extraction andsupply of the Queensland commercial harvest data, Daniella Teixeira and Jennifer Larkin for thesupply and extraction of recreational data and Fishery Monitoring for the supply of biological size andabundance data.The authors would also like to acknowledge and thank the many fishers and scientists who havecontributed to past research on blue swimmer crab, particularly Wayne Sumpton, Matthew Campbelland Mark McLennan.We would finally like to thank Eddie Jebreen and the project team for reviewing and providingcomments on parts of the draft report.This assessment was funded by the Department of Agriculture and Fisheries.Stock assessment of Queensland east coast blue swimmer crab1
GlossaryTermDefinitionCIconfidence intervalFishing year 1 July to 30 JuneGLMgeneralised linear modelInshoreencompasses the entire Queensland east coast excluding the Offshore RegionRegionLTMPLong Term Monitoring ProgramMLSminimum legal sizeMSYmaximum sustainable yieldnotch-to-Current method of measuring crab carapace width and in the document, carapace width isnotchassumed to be notch-to-notch unless otherwise stated. Measurements are the distance betweena point immediately forward of the base of the large lateral spine of the crab on one side of thecrab and a point immediately forward of the base of the large lateral spine of the crab on theother side of the crab.NRIFSthe National Recreational and Indigenous Fishing Survey conducted by the AustralianDepartment of Agriculture, Fisheries and ForestryOffshoreregion defined by the previous stock assessment (Sumpton et al. 2015) and refers to the watersRegionoff the Sunshine Coast (see Appendix A)RBHrecommended biological harvestRFISHrecreational fishing surveys conducted by Fisheries QueenslandSRFSrecreational fishing survey conducted using NRIFS methodology by Fisheries QueenslandSFSSustainable Fisheries Strategytip-to-tipMethod of measuring crab carapace width prior to 13 Dec 2003. Measurements are across thegreatest dimension of the carapace, but in cases where the carapace is missing or damagedshall be measured on the underside of the body on the one side, from the notch at the base ofthe junction of the claw (first pereiopod) with the body, to the notch at the base of the junction ofthe last walking leg (fourth pereiopod) with the body.Stock assessment of Queensland east coast blue swimmer crab2
1 IntroductionBlue swimmer crabs are distributed in Australia from the south coast of Western Australia, north to theNorthern Territory, across Queensland and down the east coast to the New South Wales–Victoriaborder. They are also found in the warmer waters of the South Australian gulfs (Kailola et al. 1993).They inhabit bays, estuaries and some offshore areas to depths of around 60 m.There is extensive literature describing blue swimmer crab biology in temperate Australia (Meagher1971; Penn 1977; Smith 1982; Potter et al. 1983). In Queensland, the earliest research into thefishery was conducted by Thomson (1951) who focused primarily on the commercial harvest. In the1980s, further research was conducted which included information on the biology of blue swimmercrabs in Moreton Bay, Hervey Bay and waters off the Sunshine Coast (Potter et al. 1986, 1991; Weng1992; Sumpton 1994; Sumpton et al. 1994a, 2003).Tagging studies of blue swimmer crabs do not indicate any clear migration. However, tagging studiesundertaken in Moreton Bay suggest a tendency for crabs to move into deeper waters as they increasein size (Sumpton et al. 1994b, 2003). Most tagged crabs were recaptured within two kilometres oftheir release site. Male and female blue swimmer crabs varied in abundance, with large malesgenerally more abundant in deeper water and females tending to prefer shallower water, particularlyon the top of sand banks (Potter et al. 1986).Blue swimmer crabs are mature from around 9–10 cm carapace width (Sumpton et al. 2003). Matingcan occur at any time during the year when the female crab is in the early post-moult (soft shell)condition (Clarke et al. 2004). Females may bear eggs throughout the year; however, the proportionof females bearing eggs are greatest during early spring (August–October). In Moreton Bay, peaks inthe proportion of egg-bearing females occurred two or three months earlier than more temperateAustralian populations (Smith 1982; Potter et al. 1983). This suggests temperature is an importantfactor in determining the timing of the reproductive cycle (Clarke et al. 2004).Female crabs can produce a number of batches of eggs in one season, which can all be fertilisedfrom the one mating. Juveniles settle out in shallow inshore areas at around 1.5 cm tip-to-tip carapacewidth. Blue swimmer crabs can live for 3–4 years and can achieve a maximum size of up to 20 cmcarapace width (Sumpton et al. 2003; Clarke et al. 2004).Blue swimmer crab has always been a culturally important species for coastal Indigenouscommunities and is targeted using a variety of methods. Blue swimmer crab is also currently targetedby commercial and recreational fishers using pots and are caught as a permitted by-product incommercial demersal trawls.The commercial fishing history of blue swimmer crab in Queensland dates back to the early 1900s;however, little information about the fishery existed until records began to be kept by the QueenslandFish Board in the 1930s. The Brisbane Metropolitan Fish Market recorded an annual harvest of32 000 crabs (just over 10 t) in 1937. Subsequent records show that by the 1960s, numbers hadincreased to an annual figure of over 400 000 crabs (around 140 t) (Thomson 1951; Sumpton et al.2015).Early fishing methods consisted of the use of long nets to tangle crabs close to the shore. In the early1950s crab pots were also used, although these were technically an illegal apparatus at the time.Most of the catch at this time was taken from the western shores of Moreton Bay (Thomson 1951).The Fisheries Act 1957 allowed the use of pots as a legal apparatus, however a license was requiredStock assessment of Queensland east coast blue swimmer crab3
if crabs caught were to be sold. In December 1976, a 50 pot maximum was imposed (Sumpton et al.2015).The Queensland blue swimmer crab fishery primarily operates in southern Queensland. Before 1998,the majority of fishing was conducted inshore, in and around Moreton Bay. In 1998 commercial potfishers began exploiting blue swimmer crab populations further offshore, in areas that were previouslylightly fished. Fishing in Offshore Region (see Appendix A) waters peaked in 2003, when the OffshoreRegion harvest contributed approximately 70% to total harvest. A decline in trawl effort and harvesthas been noted for the same period (Sumpton et al. 2015). By 2015, Offshore Region harvest haddecreased and returned to levels slightly higher than those pre-expansion.The impacts of trawl fishing on the blue swimmer crab population are unclear. A Moreton Bay studyfound that discards from trawlers contributed to 33% of the blue swimmer crab diet when trawling wasunderway (Wassenberg and Hill 1987). Hence, a reduction in trawl fishing could cause a decrease inthe availability of food.The stringing of pots (trotlining) occurred in Sunshine Coast offshore waters by some fishersproducing harvesting efficiencies. This method was a rare occurrence in other regions. The effects ofthis method on the blue swimmer crab population are unknown due to a lack of data.In 2018–19, there were a total of 279 licenses which commercially harvested blue swimmer crabalong the Queensland east coast. Of those active licenses, 88 had a crab endorsement, and 193 hada trawl endorsement. There are currently 410 C1 symbols written on 343 authorities.In Queensland, the current minimum legal size for blue swimmer crab is 11.5 cm carapace width.Legal take is male crabs only, and female blue swimmer crabs must be returned to the water. Table 2outlines the management changes that have taken place in the Queensland blue swimmer crabfishery.An assessment of the Queensland blue swimmer crab fishery was published in 2015 (Sumpton et al.2015). This assessment was broad in scope and covered changes in fishery and population biology,parasitism and diseases, environmental influences and commercial fishery economics alongsidepopulation modelling and stock assessment. It primarily focused on blue swimmer crab in HerveyBay, Sunshine Coast and Moreton Bay. Estimates of exploitable biomass ranged from 20% to 50%and spawning biomass ranged from 38% to 58% (Sumpton et al. 2015).Research during the Sumpton et al. (2015) assessment concluded that key biological parameterswere generally not different between Hervey Bay, Sunshine Coast and Moreton Bay, although crabswere generally significantly larger in offshore waters outside of Moreton Bay (see Appendix A). Forthis stock assessment, blue swimmer crab are analysed as one continuous stock along theQueensland east coast with Inshore and Offshore Region size selectivity components.In 2019, the Queensland Department of Agriculture and Fisheries commissioned an update to thestock assessment for blue swimmer crab. This assessment aims to determine the status of the northeastern Australian (Queensland) biological stock. This report informs estimates of sustainableharvests to ensure the fishery operates at sustainable levels, for commercial and recreational fishing,and support harvest strategy defined in Queensland’s Sustainable Fisheries Strategy 2017–2027(Department of Agriculture and Fisheries 2017).Stock assessment of Queensland east coast blue swimmer crab4
Table 2: Management changes applied to blue swimmer crab fishery in Queensland watersYearFisheries Management and Legislation1976Minimum legal size 15 cm carapace width (tip-to-tip) and 5 cm body width. No take of females.Measurements are across the greatest dimension of the carapace, but in cases where thecarapace is missing or damaged shall be measured on the underside of the body on the oneside, from the notch at the base of the junction of the claw (first pereiopod) with the body, to thenotch at the base of the junction of the last walking leg (fourth pereiopod) with the body.(Fisheries Act 1976, No 80)1983Issue of new non-trawl licenses ceased.1984Minimum legal size 15 cm carapace width (tip-to-tip), introduced a 3.7 cm body width. No takeof females. (Fishing Industry Organisation and Marketing Act and Another Act Amendment Act1984, No 29).1984Primary/tender boat license system introduced.1988 (1 Jan)Compulsory commercial logbook reporting began.1995Crabs may only be taken by using crab pots, collapsible traps, dillies or inverted dillies.Recreational: Not more than 4 crab pots, collapsible traps, dillies or inverted dillies alone or in acombination may be used at a time. Commercial: Not more than 50 crab pots, collapsible traps,dillies or inverted dillies alone or in a combination may be used at a time. (Fisheries Act 1994;Fisheries Regulation 1995, Subordinate Legislation 1995, No 325).1999 (13 Jul)Trawl license in possession limit of 100 for Moreton Bay or adjoining waters and 600elsewhere. (Fisheries Act 1994; Fisheries Regulation 1995, SL No 58 of 1999).2002 (1 Jan)Trawl in possession limits for blue swimmer crabs reduced to 30 in Moreton Bay and 500elsewhere (Sumpton et al. 2015).2002 (12 Sep) Investment warning.2003 (13 Dec) Minimum legal size change to 11.5 cm (notch-to-notch carapace width). Measurements are thedistance between a point immediately forward of the base of the large lateral spine of the crabon one side of the crab and a point immediately forward of the base of the large lateral spine ofthe crab on the other side of the crab. (Fisheries Act 1994; Fisheries Regulation 1995, SL No214 of 2003).2008Removal of latent effort in the line, crab, eel and beam trawl fisheries.2008 (13 Jun) Trawl license in possession limit of 100 for Moreton Bay or adjoining waters and 500elsewhere. (Fisheries Regulation 2008 1A).2010 (2 Apr)Inverted dillies prohibited. (Fisheries Regulation 2008 2I).2012Entitlement to use an additional 50 to 100 pots under permit (Sumpton et al. 2015).2014 (6 Mar)Investment warning.2014 (23 May) Crabs may only be taken by using crab pots or dillies (crab apparatus). Recreational: Must notpossess or use more than 4 crab apparatus at a time. Commercial: Must not possess or usemore than 50 crab apparatus at a time. However, for fishers with a license that has C1 writtenon it more than once: Not more than 100 crab apparatus in possession or use at any one time.(Fisheries Regulation 2008)2019 (1 Sep)Recreational in-possession bag limit of 20 blue swimmer crabs per person (FisheriesDeclaration 2019).Stock assessment of Queensland east coast blue swimmer crab5
2 Methods2.1 Data sourcesData sources included in this assessment (Table 3, Figure 4) were used to determine catch rates,create total annual harvests (combining commercial and recreational harvests) and size compositions.Data were used according to their quality, quantity and temporal-spatial resolution. Preparation ofdata was compiled monthly and in fishing (or financial) years to align with abundance andreproduction peaks.Table 3: Data sources compiled for input into the population modelDataYearsSourceCommercial1988–2019CFISH - Logbook data collected by Fisheries QueenslandRecreational1997, 1999,RFISH - Surveys conducted by Fisheries Queensland (Higgs2002, 20051999, 2001; Higgs et al. 2007; McInnes 2008)2000–01NRIFS - National survey using a different methodology (HenryRecreationaland Lyle 2003).RecreationalFishery-dependent survey2010–11,SRFS - NRIFS methodology adopted by Fisheries Queensland2013–14(Taylor et al. 2012; Webley et al. 2015).1998–2001,Agri-Science Queensland2013, 2014Fishery-independent beam2007–2015,trawl survey2017, 2018Fishery Monitoring, Fisheries QueenslandFigure 4: Data sources compiled for input into the population model. Circle sizes are proportional to total harvestfor harvests; to precision for indices and to total sample size for size compositions2.1.1 CommercialCommercial harvest data were sourced from the Queensland Fisheries compulsory logbook records,which began in 1988. These data contained daily entries where fishers recorded their harvest of blueStock assessment of Queensland east coast blue swimmer crab6
swimmer crab in numbers and/or kilograms, the geographic location of each harvest and the fishingmethod used (pot or trawl).2.1.2 RecreationalAll recreational surveys provided estimates of the number of blue swimmer crabs harvested anddiscarded per trip and combined this with demographic information to estimate annual totals atnational, state and regional scales.2.1.3 IndigenousThe National Recreational and Indigenous Fishing Survey in 2000 collected Indigenous fishinginformation on a national level by involving Indigenous communities in the gathering of fisheriesstatistics. Estimates of total harvest and discard for Indigenous communities followed similarprocedures to those in the recreational component of the survey (Henry and Lyle 2003). Due tonegligible harvests and only one year of data, Indigenous fishing data was not used as an input forthis assessment.2.1.4 CharterCharter harvest data were sourced from the Queensland Fisheries records which began in 1988.These data contained daily entries in which fishers recorded their harvest of blue swimmer crabs inkilograms, the geographic location of each catch, and the catch method used. Very few reports werelogged, and reported crab harvests were negligible. Hence, no charter data were assessed.2.1.5 HistoricalA potential source of historical commercial harvest data was the Queensland Fish Board annual catchdata. These data were not used as an input to the assessment due to limited catch reporting(Sumpton et al. 2015).2.1.6 Fishery-dependent surveyBlue swimmer crabs were sampled opportunistically from commercial pot harvest in northern andsouthern Moreton Bay, Hervey Bay and the Sunshine Coast waters during 1997–2001 and 2013–2014 (Sumpton et al. 2015). Methods have been described in previous reports and publications(Sumpton et al. 2003).Sex and carapace width information consisted of tip-to-tip size compositions in 0.5 cm bins and arepresented in Appendix D.1.2.1.7 Fishery-independent beam trawl surveyFisheries Queensland conducts a fishery-independent beam
Stock assessment of Queensland east coast blue swimmer crab 1 Acknowledgements This work was overseen by a project team that consisted of the authors and the following scientists and


![Clinical Biostatistics [CLB]](/img/6/study-guide-clb-2021.jpg)