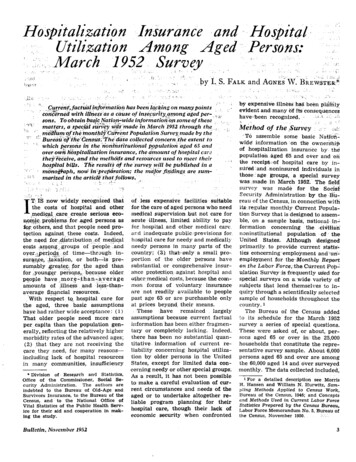
Transcription
6.i!:,‘.‘,.,.,.,,,,:.:.‘I;.a/,:&c&t,fact& @&tationhas been l&&zg on many pointsconcerned with illness’as a cause of insecuri nongaged per- i (.I ’ :,,on some of thesesons. To obtain ba.@ atio,n vide ��made‘in,March1952throughthe,,‘,.‘.Irn umdf thk’ on)hlj;“ 8ntPopulationSurvey\madebythe,;“, ,,,‘I’ Bureali‘h ‘ e”@enslrs:‘Thedata collected concern the extent toI .’ ‘, which persons in the ‘nonmstitutionalp,opulatioh aged 65 andover own hospitaii ationinsurance, the amount of hospital cnrzsthey?eieive,and the metho and resources used to meet theirhospital bi@s. The results M the survey w# be published in a,.’m&o&aph,now’ ?n.;pre&ation;the ma@r fin’dings are sum:)‘;marked in the T: IS now widely recognized thatthe costs of hospital and other,medi@ care create serious econpqic. problems for aged persons asfor others, and that people need protection against these cos,ts. Indeed,the need for istribution.of medic:alcosts .,among,;groupsof people andover,!periods.of time-throughinsurg%ce, ,. &on,or both-isp,resumably greatel;. for the aged thanp& ps,because olderfor youngerpeople have more-than:avexageamounts of illness ,and .lgs-thanaverage fi,n, ialresources.‘With respect to, hospital care forthe aged, three basic assumptionshave had rather wide acceptance : (1)That older people need more careper capita than the populationgenerally, reflecting the relativelyhighermorbidity rates of the advanced ages;(2) that they are not receiving thecare, they need, for many reasonsincludinglack of hospital resourcesin many communities,insufficiency* Divisionof, Research and Statistics,Ofrice of the Commissioner,Social SeThe authors arecurity Administration.indebted to the Bureau of Old-Age andSurvivors Insurance, to the Bureau of theCensus, and to the NationalOffice ofVital Statistics of the Public Health Service for their aid and cooperation in I&ing the study.Bulletin.NovemDer 1952‘.,I.,’“:A;’.iy,,of .less expensivefacilitiessuitablefor the care of aged persons who needmedical supervisian.butnot care foraeute iliness, limited ability to payfar hospital and other medical cart.ar:d inadequate public;provisionsfor,hospital care for needy and medicallyneedy persons in many parts of thecountry; (5) thatonlya small proportion of the older persons havesubstantialor comprehensiveinsurance protection. against hospital andohhermedicalcosts, because the common forms of voluntaryinsuranceare not readily availableto peoplepast age 65 or are purehasable onlyat prices beyond, their means.Thesehaveremainedlargelyassumptions’ because current factualinformation has been either fragmentary or completelylacking.Indeed,there has been no substantialquantitative. informationof current reliabilityconcerning hospital utilization by older persons in the UnitedStates, except for limited data concerning needy or other special groups.As a result, it has not been possibleto make a careful evaluation of current circumstances and needs of theaged or to undertake altogether reliable programplanningfor theirhospital care, though their lack ofeconomic security when confronted:.‘Y.,, ’ .by expensive illness has been pldiiilyevident and many of it&consequences.I I .: ,.‘1haveqbeen recognized.I:blhthod of the &wr?y.”:: :’ “‘.ATo assemble some basic Natio&wide information-on the ownershipof hospitalizationinsurance by thepopulation .aged 65 and over and anthe receiptofhospital care by insdl’c%l: and noninsuredindividualsinthose :‘age groups, a special surveywas made in March 1952. The fieldsurveywas made for the So& Security Administrationby the l&ureau of the Census, in connection withi-ts.regular monthly Current Population Surv,ey that is designed to assem-,ble, on a sample basis, national.informationconcerningthe .ci&iaiinsninsti.tutionalpopulationof theUnitedStates. Although‘designedprimatilyto provide current stat& tics eoncerning employmentand‘unemploymentfor theMonthlyRep&on the LaborForce;the Current Population Surdey.is frequentlyused. forspecial. surveys on a wide variety ofsubjects that lend themselves to inquiry through a scientificallyse!ectedsample of households throughout thecountry. 1The Bureau of the Census added!o its schedule for the March’ 1952survey a series of special questions.These were asked of, or about, persons aged 65 or over in the 25,000households that constitute the representative survey sample. About 6,000persons aged 65 and over are amongthe 60,000 aged 14 and over surveyedmonthly. The data collected included,1 For a detailed descriptionsee MorrisH. Hansen and Williain N. Hurwitz, Sampling Methods Applied to Census Work,Eureau of the Census, 1946; and Conceptsand Methods Used in Current Labor ForceStatistics Prepare@ by the Census Bureau,Labor Force Memorandum No. 5, Bureau ofthe ‘Census, November 1950.,‘. -.3
insurance claim had not been filed,and that there might be some misstatement of the extent of insuranceprotection.Since the survey couldnot look into the details of insurancepolicies, no attemptwas made toascertainthe precise scope of theinsurance owned or of the kinds andamounts of benefits provided.Consequently, persons reported as owning hospitalizationinsurance are regarded as having some hospitalizationinsurance, whether comprehensiveorlimited in the protection it provides.Ownershipof insurance was recorded as of the survey date, andthe ratios of insured persons to allpersons aged 65 and over are therefore as of March 1952. When calculating hospitalizationrates with reference to insured status, it was assumedthat the insured status reported inMarch 1952 had been continuouslymaintainedin 1951. To the extentthat some persons who were hospitalized in 1951 and had insurance thendid not have it in March 1952, aslight error arises. However, no noninsured persons in March 1952 reported using insurance to pay hospital bills in 1951. In the conversesituation it is unlikelythat-inthissurveyedpopulationof older persons-manypersons who were hospitalizedin 1951 and did not haveinsurance then would have obtainedit by March 1952.Responses concerningthe occurrence of a hospital stay and its lengthare .believed to be substantiallyaccurate, though in some instances theymay be faulty.The returnsareprobably highly accurate as to hospiespeciallybecausetal admissions,there were relativelyfew multipleLimitations of the Dataadmissions per surveyed person inthe course of the year, but they mayData collected through a samplecontain both overstatementsand unare subject to sampling variability.probably of offsettingIn the present study, the range of derstatements,possible samplingvariabilityis of magnitudes, on the number of daysspent in the hospital.known magnitude and can be takenA more important limitationon theinto account when interpretingthedata concerning hospital care resultsresults. In addition to sampling varifrom the fact that the interviewsability, there were possible inaccurawere held in March 1952 and thecies because of the respondent’s indata sought were for hospital carecompleteknowledgeor unreliablereceived in 1951. As in other surmemory.veys that collect informationretroIt was recognized in advance thatactively,this method can providemany survey respondents might havereasonablyaccurate informationonfaulty ideas about the hospital insurance they owned. especially if an the amount of hospital care receivedin additionto the answers to thespecial questions on insurance ownership and hospitalexperience,theitems covered in the regular monthlyinquiriesconcerningage, sex, race,occupation,industry,and place ofresidence. Thus, the answers to thespecial questions could be related tothese basic characteristicsof the individuals.The special questions asked of, orabout, any person aged 65 or overlocated in the household were asfollows:(1) “Doeshavehospitalizationinsuranceor belongto a plan that covers all or part ofthe costs of hospitalization?”(2)“Wasa patient in a hospital any time during 1951?” If thereply to the second question was inthe affirmative,it was followed by(3) “How many days, altogether, wasin the hospital in 1951?”(4) “What is the name of the hospital?” and (5) “How was the hospitalbill taken care of?”The interviewerswere instructedto “cashsickness”) insurance.The name of thehospital was requested to enable theschedule editors to exclude hospitalization in mental and tuberculosis institutions without having the interviewers ask probing questions. Carein nursinghomes,convalescenthomes, or homes for the aged andfor incurableswas excluded.Thefinal data were confined to care ingeneraland special(short-term)hospitals, regardless of type of control, so that Federal, State, county,city, and private nonprofit and proprietaryhospitals were included.4by the surveyed population. No errorresults if the findings are used as anindicationof the care received in1951 by that population.If, however,the results are to be used to indicatethe amount of hospital care furnishedduring 1951 by all the hospitals ofthe country to all persons who were( aged 65 and over at the time theyreceived the care, adjustments mustbe made.Such an adjustmentis especiallynecessary with respect to the carefurnishedin 1951 to persons whowere no longer living in March 1952and thereforenot in the surveyedpopulation.The adjustmentis ofconsiderableconsequencewith respect to older persons, because oftheir relativelyhigh death rates andthe relativelylarge amount of hosnital care furnished to those who diein the course of a year. Rates thatshow the amount of hospital carefurnished in 1951 to all persons aged65 and over, includingdecedents,are presented after the rates for theMarch 1952 populationhave beengiven in detail.The Bureau of the Census samplerelates to all civilians living withinthe continentallimits of the UnitedStates, except inmates of penal institutions, mental institutions,homesfor the aged, infirm, and needy, andsimilar places. The findings are therefore applicableonly to the civiliannoninstitutionalpopulation.Statistical tests indicate that omission ofthe institutionalpopulationaged 65and over in the survey month-approximately1 millionpersons-hasonly a negligibleeffect on the hospital utilizationrates. This group received such a small amount of carefrom generaland special(shortterm) hospitals in 1959, in comparisonwith those in the noninstitutionalpopulation,that hardly any adjustment is needed in arriving at an estimate of total hospital care in suchhospitals for all persons aged 65 andover.Ownership of HospitalizationInsuranceSince the ownership of hospitalization insurance may affect the rateor extent of hospitalizationsubstantially, the findings with respect toinsurance are presented first.Social Security
The survey indicates that of the12.0 million persons in the noninstitutional population aged 65 and overin March 1952, about 3.2 million or26.3 percent had some hospitalizationinsurance.Table 1 shows the percentage distributionof the 12.0 million with respect to age, sex, race,and other characteristics;it alsoshows, as percentages of the 12.0 million persons, the number in each subgroup who had hospitalizationinsurance. The uneven distributionofinsurance is evident in many of thesubgroups.Several subgroups havea much higher or a much lower proportion insured than 1 in P-the average for the whole population. Nearlyevery category in the age bracket 6569, and all the age-sex categories “inthe labor force,” have more than 1in 4: the nonwhite groups, the farmresidents, and those “not in the laborforce” have less than 1 in 4.The percentage distributionof the3.2 million persons having some hospitalizationinsuranceis shown intable 2. The points noted earlier aboutthe distributionof insurance ownership are even clearer when tables 1and 2 are compared.Though menconstituted47 percent of the totalsurvey group in March 1952, theyrepresented 54 percent of those withsome insurance. Persons aged 65-69made up 40 percent of the total but55 percent of the insured group. Thenonwhite population accounted for 7percent of the total but only 3 percent of the insured population.Forfarm residents,the correspondingpercentages were 15 and 9; for persons in the labor force, 23 and 39;and for those not in the labor force,77 and 61.Age, sex, and ;ace.-Theextent anddistributionof hospitalizationinsurance by age, sex, and race are summarized in table 3. As noted earlier,26.3 percent of the survey group reported having some hospitalizationinsurance in March 1952. About 30percent of the men and 23 percentof the women were protected by somekind or amount of insurance againsthospitalbills.In contrast to 27.5percent of the aged white population,only 10.5 percent of the aged nonwhite populationreportedowninginsurance.The prevalence of insurance ownBulletin,November 1952Table 1.-Noninstitutionalpopulationaged 65 and over, by selected characteristics and by ownership of hospitalizationinsurance, March 1952Percentage distribution,groupPopulation65 andNumberaged G5and over6 and07.3--- --by agegroupOVW---- ITotal.-.-;.--.--.- .-.-.---.-.-.-. .-.WithsomeInsurancr.-.-.-.-.-.SW:iMale-.-.---. -.------.---. . . . . . . . . .With someinsurauce--.-. . .-. . . .IFemale - . . . . . . . . . . . . .Withsomeinsurance.---. . . . . .Race:White . . . . . . . . .With some insurance . . . . . . . . . . . .Sonwhlte . -. . . . . . . . . .With someinsuran .-.--.----.-.---.--. .,Residence:IJrban . . . . . . . . . . .With someinsurancr---.--.-.-.,Rural-noufarm . . . . . . . . . . . . . . . --,---.--.--------.-.---.- -------.-.With some msurance . .- . . . . .k:mployment status:Inthrlaborforce. . . . . .Withsome insuranc . .- -.-. . - .Male.---.-.-.-.----.--.----------------.-With someinsurancr.----.-.---------.----------.Female- . . . . .With some insurance . . . . .Not in the labor foroe .With some Insurance . .Male * ---- -----With some insurance .Female . ,Witbsomeinsurance. . - . . . . .-1ership decreased with advancing ageamong both men and women.2 Amongwhite men, for example,the reported ownershipof insurance decreased from 44 percent for thoseaged 65-69 to 30 percent for thoseaged 70-74 and to 16 percent forthose aged ‘75 and over. The proportions with insurance were consistently lower among women than amongmen. The rates for white women were33 percent insured at ages 65-69, 23percent at ages 70-74, and 15 percentat ages 75 and over. The differencebetween white men and white womenin the relative number insured, whichwas substantialat ages 65-69 (44percent as against 33 percent)wasrelativelyunimportantat the hiihestages (approximately15 percent inboth instances). As will become clearlater, these figures reflect the association of insurance ownership and gainful employmentand the fact that atthe highest ages few of either sexare rance was most general2 The only exceptionappears in the caseof nonwhitemen. a relativelysmall groupfor whichtherewas a largeprobableerror in the surveysample.19. 532.04.812.0063.1555,6201,70546. 814.253.212.113.13.714.83.214.24::6. 492.725. 57.30.836.914. 3.37.31. 16.22.43.00.92:20.50.103. II19.321.04.615. 42.323.210.214.06.911.3Z1;::2. G7,6402,3232.6225551,844280t::E2::11.71%6121:::2. 81X2141,45311,1283,06287896I%t:21: g urban residentsend leastamong persons living on farms (table4). The percent with some hospitalization insurance in the total urbangroup (30 percent)was twice thatfor farm residents (15 percent).Inlarge measure, these nce also obtained in the agegroups 65-69 and 70-74 and for menand women separately.In the highest age group, 75 and over, they stillobtained for both sexes but not formen or for women separately. Amongthe men the residence differences ininsurance ownership were much reduced, and among the women theywere much increased; the insurancepercentage for women on farms wasonly one-seventh as large as for thosein urban areas.Employmentstatus.-Beforeconsidering the ownership of hospitalization insurance in relation to employment-.status, it is importantto recallthe atypicalcharacteristicsof theaged populationwith respeat to thisfactor. In the first block of columnsin table 5, it is seen that only 41 percent of the men and only 8 percentof the women aged 65 and over werein the labor force in March 1952,That5
Table 2.-Jnsured. noninstitutional@pulatiotiaged 65 and over, byselected charac’teristics, March 1952Percartage distribution,by, age erSex:Both sexes- 100.0Male . . - 53.9Female . .46.1Race:White . . 97.0Nonwhite . .3.0Residence:Urban . 73.5Rural-nonfarm-.17.6Farm 8.9Employment status:Inthelaborforoe.38.7Male 32.3” Female 6.4.Not in the laborforce 61.3Male 21.6Female 012.7t::ki32. 724”28.221. .3-.is, 6 out of 10 men and 9 out of every10 women were not in the labor force;they were clasSi6ed as engaged ,in:?!keeping Lhous,e,‘?: “unable to work,”or “other”(meaning, generally,retired from gainfulwork).In thesecond block of columns, it is seen.that 44.5 percent of the men .in thelabor force, but only 20 percent ofthose;not in the labor force, reportedhavingsome hospitalizationinsurance. among women the percentages‘with some insurance were similar (41percent and 21 percent, respectively),though only 6 percent were actuallyin the labor force.: iAmong the employedmen, 19.5percent of those employed in agriculture had some hospitalizationinsurance, a figure similar to that forall insured men not in the labor force(20 percept.),. and the percentageshows no substantialdecline withadvancing age. In contrast, more than55 percent of the aged men employedin nonagricultural,indhstrieswerereported -.as having some insurance;the percentage declines sharply withadvancing ,age (from : 61 percent atages.65-69 to 39 percent among thoseaged .75 and over) but remains consistently .above :that for men not in t,he labor.force.Among men not in,tho labor force, the. highest insurancepercentage is found among those inthe ages 65-69 and classiiledas“other.? (33 percent); this percentage,too,:. declines-toonly 15 percent forthe’ oldest group.6Among women not ih the laborforce, the largest group numericallyand the group with the highest percentage of insured persons was thatclassified as “keepinghouse.” Thisgroup probably included most of thewomen whose insured status resultedfrom their being dependents of insured men, a fact applying particularly to those aged 65-69. Almost 29percent of the women in this agegroup and not in the labor force werecovered by some hospitalizationinsurance, but only 14‘percent at ages75 and over had some insurance.One subclassificationof persons notin the labor force deserves. specialnote. Only lo-11 percent of those inthe category “unable to work” hadsome hospitalizationinsurance; andthe proportiondeclined.from14-17percent at ages 65-69 to 9 pqcwtforthose aged 75 and over.ownership.Comment on insurance-Fromthe preceding analysis, several key facts emerge with regard tothe distributionof hospitalizationinsurance in the populationaged 65and over. It has become apparent.that variationsin insured status.especially the higher insurance percentages among men than amongwomen, the higher percentagesIanthe lowest of the three age ‘groups,and ; the higher percentages’ “amongurban than among rural residentsare all related to the wider prevalence of. insurance ownership amongpersons in the labor force and particularlyamong those employed i,nnonagriculturalindustries.In vielirof the decreasing participationin thelabor force ‘as age advances, the almost negligible proportions bf womenaged 65‘8nd over tho are: gainfullyemployed, and-withrising age- theincreasing. preponderanceof womenamong those not in the labor force,the interrelationshipof. insuranceownership and’ of the opportunity’topurchase insurance ‘by reason of employment becomes increasinglyclear.The “opportunity”to purchase hbspitalizationinsurance has two facetsfor persons aged 65 and over-theireligibilityfori such insuranceandtheir abilityto pay the premiums.More than two-thirdsof the hospitalizationinsurance now in force inthe United States has been sold asgroup insurance, principallyby BlueCross plans and by commercial companies.For older persons , as .forothers, participationin a groupusually a group of employed persons-is a necessary condition to securingthe pratec .ion .afforded by group in?surance. Individualinsurance policies, although not requiringthat theolder person belong to a recognizedgroup, may also requirework atsteady employmentas’a condition ofeligibility.An exception to these generally pr.acticed underwritingrules isthe conversion privilege available ina number of Blue Cross plans; thisprocedurepermitsolderpersons,when they retire, to convert theirgroup membershipto individuallypurchased Blue Cross insurance, usu,ally with a higher premium.E y itsvery nature, individuallypurchasedinsurance is not accompanied by anemployer contributiontoward premiums, whether the policy is obtained.#qom a Blue Cross plan or a commercial company,. and the premium. is,higher for the same or even forlesser insurance protection than it iswith. group insurance.,. :Fifty-five.percent of the insuredLersons were in the age group 65-69,and 31 percent were men in theseages, though this age group containsonly 40, percent of- the. 12 millionpeople aged 65 and over in the noninstitutionalpopulationand menrepresentedless than 20 percent ofthe 12 million.Twenty-twopercentof all the insured persons were menaged 65-6,9 in the labor force, al.though this group equaled only 11percentof the aged population.Among men aged 65-69 who wereof persona who .hadTable 3.-Percent1 Fame insurance,by age, sex, andrace, noninstitutional‘popz@atiopaged 65 and over, March 1952; ‘.Age groupI65and65-G9R-74O”tT76,and0W?rRoth sexes.: . 26.31. White-. . I . 27.5! Nonwhite,-. * 10.536.438.314.724.826.17.015.015.67.6IMale 30.2Whita - - 31.4Nonwhite . 15.742.343.625.028.229.98.315.816.210.3,&male . 22.8White- 2,;Nonwhiteg.;21.722.85. 514.415. 15. 57: 2Social Sec,prity
Table onaged 65and over by age and by urban-ruralresidenceandthe percentofpersons who had some insurance,March 1952-Hospital Care Received in 1951by the March 1952 Noninstitutional PopulationIge groupResidence and sex65andOVW.Percentage distributionof populationTotalUrbanRm&lOllf m-FWm----.-.-loo.0loo. 0loo. 0loo. 0i40.141.036.940.932.031.534.930.4Percent with someinsurance-26.330.422.015.236. 442. 429.820.424.828.6%15.016. 715.08.0lMaleUrban-Rural-nonfarm.Farm30.235.825. 716.742.350.035. ural-nonfarm.-.Farm22.826.018.413.530.935.324. l-nonfarm-.F IU-.-------employed in nonagriculturalindustries, 61 percent had some insurance.This concentrationis in turn largelyresponsiblefor the relativelyhighrate of insurance ownershipamongurban residents aged 65-69 and atall ages 65 and over.Commonly faced with employmentas a condition of maintaininggroupinsurance, and with relativelyhighpremiums (with no employer contribution) as a condition of obtainingindividualinsurance,persons pastage 65 and not in the labor forcehave less opportunitythan most persons to obtain hospitalizationinsurance. Nearly 77 percent of the agedpopulationwere not in the laborforce, but only one-fifthof thesepersons had some insurance. Individual insurance usually carries limitations with respect to preexistingdiseases or defects, so that its value infurnishinginsurance protection maybe highly limited.The higher riskrates of older persons are reflectedin the higher premiums charged themfor commercialindividualpolicies,though this statement is not applicable to Blue Cross. It is not surprising, therefore,that those who canreadily participate in groups and whoBulletin,November1952have income from gainful employment, or dependents of such persons,have most of the hospitalizationinsurance in the populationaged 65and over.The special survey questions weredesigned to determinehow manyaged people went into general orspecial (short-term)hospitals withina la-monthperiod, how long theystayed on the average, and how manydays of hospital care (per 100 agedpersons in the population)were received. The data on hospital utilization were correlated with the insuredstatus of the populationand of thepatients in order to measure the relation betweeninsuranceprotectionand hospital utilization.As noted earlier, the data on hospital utilizationin table 6 refer tohospitalizationreceived in 1951 by allpersons aged 65 and over and not ininstitutionswho were aliveandtherefore included in the sample surveyed in March 1952. A second seriesof rates (table 6) takes into accountpersons aged 65 and over who became 65 or died after being admittedto a hospital in 1951.Age, sex, and race.-Intable 6, thefindings of the survey on admissions,length of stay, and days of hospitalcare are presented for the total surveyed population-insuredand noninsured. The average admission ratefor the total group was 7.3 per 100persons. The distributionby age, sex,and race shows that insured personshad uniformlyhigheradmissionrates than the noninsured, except forthe small group of insured womenaged 75 and over. Admissions amonginsured persons varied by age andsex from 6.0 to 15.0 per 100, andaveraged10.3. The correspondingrange for the noninsured was not sowide, varying from 5.3 to 7.9 per 100,with an average of 6.3. Since therewere more persons without insurancethan with it, the admission rate forthe entire group is closer to that ofthe noninsured than the insured.Inalmost all instances the admission ratefor women was lower than the comparable rate for men. The rate wasmuch lower for the nonwhite than forthe white group, but this differenceresulted wholly from the divergenceamong the noninsured.Insured persons and the noninsuredshowed large differences in averagelength of stay, as in admission, butthe relationshipis reversed; the average duration was 14.7 days of carefor the insured and 27 days for thenoninsured.For the two groupscombined, it was 22.5 days of care.When age and sex differencesareconsidered, there was not much variation in the averagenumberofhospital days per admission amongthe insured, with the two exceptionsof the nonwhitegroup (21.6 days)and women aged 75 and over (9.1days). Except in this last age group,Table 5.-Percentagedistributionof noninstitutionalpopulationaged 65 andover by age, sex, and employment status, and the percent of persons who hadsome insurance, March 1952IPercentage distribution ofpopulation, by sge groupEmployment-status65 andoverMale, tots1 -- -In the labor forceEmployedIn agricultureIn nonagricultural industries-Unemplo edNot in the I sbor forceKee lug houseUna ?I le to work .Other- 1-65-69.-loo. 040.939.211.228.241.624.222.85.117.71. 45:::'ii3. 214.01%44.4Female, total 100.0In the labor force7. 7Not in the labor force 92.3Keeping house 78. 7Unable to work9.8Other 3. 8-xl-74---.75 andPercent with some insurance,by age group-65 andoverOVW.-28.011.311.03.77.30. 316. 70.13. 113.630.45. 427.71.726. 0. 2E:IO. 9B.542.350.952.222.560.923.330.533.317.233.42::- - - 10.623.9E:i21.322. .3ii::14"831:0523.4;:t-70-74;g16. 549.3'5 andover15.8E”717:538.80.012.814.423.314. 115. 78.614.9-7
insured women stayed longer in thehospital on the average than insuredmen. One group-menaged 70-7”distorted the averages of the noninsured. A relativelysmall number ofadmissionsamong this group accounted for a disproportionatenumber of days of care, because some ofthe men remained in the hospital afull year.With this one exception,women stayed longer on the averagethan men in all instances among thenoninsured, as among the insured.Even with their higher-than-average admission rates, insured personshad a somewhat smaller amount ofhospital care (days per 100 persons)than the noninsured,because theiraverage length of stay per admissionwas so much below that for the noninsured. The whole group received165 days’ care per 100 persons; theinsured among them used 151 daysand the noninsuredused 170 days.Amongthe noninsured,nonwhitepersons had less than half as muchhospital care as white persons; amongthe insured,the relationshipwasnearly the reverse. Women, despitetheir longer average stay per admis-sion, received fewer days of hospitalization per 100 than men, but thereare variationsin this relationshipwhen insured and noninsuredpersons are compared.It is importantto note that thedata in table 6 show a striking lackof progression in the rates with advancing age. Regardl
for incurables was excluded. The final data were confined to care in general and special (short-term) hospitals, regardless of type of con- trol, so that Federal, State, county, city, and private nonprofit and pro- prietary hospitals were inc