Transcription
EIGHTH EDITIONnRESEARCHIN EDUCATIONJohn W. BestButler University, EmeritusJames V. KahnUniversity of Illinois at ChicagoAllyn and BaconBostonlLondonlTorontolSydneylTokyolSingapore
‘, spVice President, Education: Nancy Forsyth,,Editorial Assistant: Cheryl OuelletteMarketing Manager: Kris FarnsworthSr. Editorial Production Administrator: Susan McIntyreEditorial Production Service: Ruttle, Shaw & Wetherill, Inc.Composition Buyer: Linda CmManufacturing Buyer: Suzanne LareauCover Administrator: Suzanne HarbisonCopyright 0 1998,1993,1989,1986,1981,1977,1970,1959A Viacom Company160 Gould StreetNeedham Heights, MA 02194by Allyn & BaconIntemel: www.abacon.comAmerica Online: keyword: College OnlineAll rights reserved. No part of the material protected by this copyright notice may bereproduced or utilized in any form or by any means, electronic or mechanical, includingphotocopying, recording, or by any information storage and retrieval system, withoutwritten permission from the copyright owner.Library of CongwssCataloging-in-Publication DataBest, John W.Research in education / John W. Best, James V. Kahn-8th edp. c m .Includes bibliographical references and indexISBN 0.205.18657-i1. Education-Research. I. Kahn, James V., 194%II. T i t l e .LB1028.B4 1 9 9 8370’.72-dc2196.53399CIPPrinted in the United States of America1 0 9 8 7 6 5 4 3 2 1RRD0403020100999897
CONTENTSPrefacePART IxiiiIntroduction to Educational Research: Definitions,Research Problems, Proposals, and Report Writing13The Meaning of Research3The Search for KnowledgeScience69The Role of TheoryOperational Deiinitions of VariablesThe Hypothesis 1011The Research HypothesisThe Null Hypothesis (Ho)Sampling91172Randomness 1313The Simple Random SampleRandom Numbers 1315The Systematic Sample15The Stratified Random Sample16The Area oi- Cluster Sample16Nonprobability SamplesSample Size 17What Is Research?Purposes of Research1820Fundamental or Basic ResearchApplied Research 21Action Research 21201
viContentsAssessment, Evaluation, and DescriptLe ResearchTypes of Educational Research23Summary 24Exercises 25References 26222Selecting a Problem and Preparing a ResearchProposal 29The Academic Research Problem30Levels of Research Projects31Sources of Problems31Evaluating the Problem34The Research Proposal36Ethics in Human ExperimentationUsing the Library4540Finding Related LiteratureMicrofiche 46Note Taking 46References and Bibliography4548Fair Use of Copyrighted Materials48The First Research Project48Submiffing a Research Proposal to a Funding AgencySummary 52Exercises 53References 543The Research ReportStyle Manuals 5 555Format of the Research Report56Main Body of the Report57References and Appendices60The Thesis or Dissertationsty/e of Writing 6 1Reference Form 62Paginatioion6 4Tables64Figures6660The Line Graph67The Bar Graph oi- Chart67The Circle, Pie, or Sector ChartMaps70Organization Charts70Evaluating a Research ReportSummary 72References 72706851
ContentsPART IIviiResearch Mefhods 734 Historical Research 77The History of American Education78History and Science81Historical Generalization 82The Historical Hypothesis83Hypotheses in Educational Historical Research84Difficulties Encountered in Historical Research85Sources of Data85Primary Sources of Data85Primary Sources of Educational Data86Secondary Sources of Data87Historical Criticism 87External Criticism 87Internal Criticism 88Examples of Topics for Educational Historical Study91Writing the Historical Report92Summary 93Exercises 94Endnote94References 94Sample Article 96French Colonial Policy and the Education of Women and Minorities:Louisiana in the Early Eighteenth Century / Clark Robenstine5Descriptive Studies: Assessment, Evaluation, and ResearchAssessment Studies115The Survey115Social Surveys116Public Opinion Surveys117National Center for Education StatisticsInternational Assessment120Activity Analysis121Trend Studies121Evaluation Studiesf22School Surveys122Program Evaluation123Assessment and Evaluation in Problem SolvingThe Follow-Up Study127Descriptive Researchf29Replication and Secondary Analysis135The Post Hoc Fallacy137139SummaryFX.%CkS13911912511396
References140Sampie Art;&143Perceptions About Special Olympics from Service Delivery Groups inthe United States: A Preliminary Investigation / David L. Porretta,Michael Gillespie, Paul Jansma1436Experimental and Quasi-Experimental ResearchEarly Experimentation 758Experimental and Control CROUPS159V a r i a b l e s 760Independent and Dependent VariablesConfounding Variables 161Controlling Extraneous Variabies xperimentaai V a l i d i t y 7 6 4157160162Threats to Internal Experimental ValidityThreats to External Experimental ValidityExperimental Design 169164168Pre-Experimental Designs 170True Experimental Designs171Quasi-Experimental Designs 175Factorial Designs 184Summary 188Exercises 789References 190Sample Article192Experiential Versus Experience-Based Learning and Instruction / JamesD. Laney1927Single-Subject Experimental Researchgeneral P r o c e d u r e s 2 1 1209Repeated Measurement211Baselines 211Manipulating Variables212Length of Phases213Transfer of Training and Response MaintenanceAssessment 214Target Behavior 215Data Collection StrategiesBasic Designs 216A-B-A Designs 216Multiple Baseline DesignsOther Designs 221EvaluatingSummaryfXWCk3S2Endnotes 2Data 2232252 62 7215220214
References227Sample Article228Effects of Response Cards on Student Participation and AcademicAchievement: A Systematic Replication with Inner-City StudentsDuring Whole-Class Science Instruction / Ralph Gardner, WilliamL. Heward, Teresa A. Grossi2288 Qualitative Research239Themes of Qualitatk ResearchResearch Questions242Theoretical Traditions244Research Strategies246240Document or Content AnalysisThe Case Study248Ethnographic Studies250Data Collection Techniques246253Observations253Interviews254Review of Documents255Other Qualitative Data Collection TechniquesData Analysis and 260References260Sample Article262Professionals’Perceptions of HIV in Early Childhood DevelopmentalCenter / Norma A. Lopez-Reyna, Rhea F. Boldman, James V. Kahn2629Methods and Tools of Research275Reliabiiity and Validity of Research Tools275Quantitative Studies276Qualitative Studies278Psychological and Educational Tests and inventoriesQualities of a Good Test and erest285Types of Tests and InventoriesAchievement Tests287286Aptitude Tests287Interest Inventories289Personality Inventories289Proiective Devices290279
0bservat;on291Validity and Reliability of Observation294Recording Observations295Systematizing Data Collection295Characteristics of Good Observation298Inquiry Forms: The Questionnaire298The Closed Form299The Open Form300Improving Questionnaire Items300Characteristics of a Good Questionnaire307Preparing and Administering the QuestionnaireA Sample Questionnaire310Validity and Reliability of Questionnaires310Inquiry Forms: The Opinionnaire314Thurstone Technique315Likert Method315Semantic Differential319The interview320Validity and Reliability of the Interview321Q Methodology322Social Scaling324Sociometry324Scoring Sociometric Choices325The Sociogram325“Guess-Who” Technique326Social-Distance Scale327Organization of Data Collection328Outside Criteria for Comparison329Limitations and Sources of Error330Summary331EXUCkS332References332PART IIIData Analysis33510 Descriptive Data Analysis337What Is Statistics!338Parametric and Nonparametrric Data338Descriptive and inferential Analysis339The Organization of Data340Grouped Data Distributions341Statistical Measures342Measures of Central Tendency342Measures of Spread or Dispersion347308
ContentsNormal Distribution352Nonnormal Distributions355Interpreting the Normal Probability Distribution355Practical Applications of the Normal Curve357Measures of Relative Position: Standard Scores357The I- score (T)359The College Board Score (Z,)360stanines360Percentile Rank360Measures of Relationship362Pearson’s Product-Moment Coefficient ofCorrelation (Y)366Rank Order Correlation ( p)369Phi Correlation Coefficient (4)371Interpretation of a Correlation Coefficient372Misinterpretation of the Coefficient of Correlation373Prediction374Standard Error of Estimate376A Note of Caution378Summary379Exercises (Answers in Appendix II380Endnote384References38411 Inferential Data Analysis385Statistical inference385The Central Limit Theorem386Parametric Tests389rest;ng Statistical Significance389The Significance of the Difference between the Means of TWOIndependent Groups389The Null Hypothesis (H,,)390The Level of Significance391Decision Making392Two-Tailed and One-Tailed Tests of Significance393Degrees of Freedom395Student’s Distribution it)396Significance of the Difference between TWO Small SampleIndependent Means396Homogeneity of Variances397Significance of the Difference between the Means of TWO Matchedor Correlated Groups (Nonindependent Samples)400Statistical Significance of a Coefficient of Correlation402Analysis of Variance iANOVA404Analysis of Covariance (ANCOVAi and Partial Correlation409Multiple Regression and Correlation411xi
Nonparametric Tests415The Chi Square Test (2)415The Mann-Whitney Test420SlImmary422Exercises (Answers in Appendix /j423426References12 Computer Data Analysis427The Computer427Data Organization429Computer Analysis of Data432Example 1: Descriptive Statistics-SASCORR433Example 2: Charting-SAS:CHART433Example 3: Multiple Regression-SPSS436Example 4: Analysis of Variance-SASS-PC 440SPSS for Windows Used with Appendix B Data in Chapters 10and 11 ix AStatistical Formulas and SymbolsAppendix 6Sample Data Microsoft Excel FormatAppendix CPercentage of Area lying Between the Meanand Successive Standard Deviation Units underthe Normal Curve459Appendix DCritical Values for Pearson’s Product-MomentCorrelation (r)461Appendix ECritical Values of Student’s Distribution (0Appendix FAbridged Table of Critical Values for Chi SquareAppendix CCritical Values of the F DistributionAppendix HResearch Report EvaluationAppendix IAnswers to Statistics ExercisesAppendix JSelected Indexes, Abstracts, and ReferenceMaterials479Author Index491Subject Index494449455467473475463465
The eighth edition of Research in Education has the same goals as the previous editions. The book is meant to be used as a research reference or as a text in an introductory course in research methods. It is appropriate for graduate studentsenrolled in a research seminar, for those writing a thesis or dissertation, or for thosewho carry on research as a professional activity. All professional workers should befamiliar with the methods of research and the analysis of data. If only as consumers,professionals should understand some of the techniques used in identifying problems, forming hypotheses, constructing and using data-gathering instruments,designing research studies, and employing statistical procedures to analyze data.They should also be able to use this information to interpret and critically analyzeresearch reports that appear in professional journals and other publications.No introductory course can be expected to confer research competence, norcan any book present all relevant information. Research skill and understandingare achieved only through the combination of coursework and experience. Graduatestudents may find it profitable to carry on a small-scale study as a way of learningabout research.This edition expands and clarifies a number of ideas presented in previouseditions. Additional concepts, procedures, and especially examples have beenadded. Each of the five methodology chapters has the text of an entire publishedarticle following it, which illustrates that type of research. Nothing has beendeleted from the seventh edition other than a few examples of research that havebeen replaced with more recent and appropriate examples. An appendix (B) hasbeen added that contains a data set for use by students in Chapters 10,11, and 12.This edition has been written to conform to the guidelines of the American Psychological Association’s (APA) Publications Manual (4th ed.). The writing style suggested in Chapter 3 is also in keeping with the APA manual.Many of the topics covered in this book may be peripheral to the course objectives of some instructors. We do not suggest that all of the topics in this book beincluded in a single course. We recommend that instructors use the topics selectively and in the sequence that they find most appropriate. Students can then usethe portions remaining in subsequent courses, to assist in carrying out a thesis,and/or as a reference.xiii
xivPrefaceThis revision benefited from the comments of Professor Kahn’s students, whohad used the earlier editions of this text. To them and to reviewers Barbara Boe,Carthage College; John A. Jensen, Boston College; Jerry McGee, Sam HoustonState; and Gene Gloekner, Colorado State University, we express our appreciation.We also wish to thank Michelle Chapman and Tam O’Brien who assisted in thepreparation of this edition. We wish to acknowledge the cooperation of the University of Illinois at Chicago Library and Computer Center; SPSS, Inc.; and SASInstitute, Inc. Finally, we are grateful to our wives, Solveig Ager Best and KathleenCuerdon-Kahn, for their encouragement and support.J.W.B.1. VK.
DESCRIPTIVEDATA ANALYSISBecause this textbook concentrates on educational research methods, the following discussion of statistical analysis is in no sense complete or exhaustive. Onlysome of the most simple and basic concepts are presented. Students whose mathematical experience includes high school algebra should be able to understand thelogic and the computational processes involved and should be able to follow theexamples without difficultyThe purpose of this discussion is threefold:1. To help the student, as a consumer, develop an understanding of statistical terminology and the concepts necessary to read with understanding some of theprofessional literature in educational research.2. To help the student develop enough competence and know-how to carry onresearch studies using simple types of analysis.3. To prepare the student for more advanced coursework in statistics.The emphasis is on intuitive understanding and practical application ratherthan on the derivation of mathematical formulas. Those who expect and need todevelop real competence in educational research will have to take some of the following steps:1. Take one or more courses in behavioral statistics and experimental design2. Study more specialized textbooks in statistics, particularly those dealing withstatistical inference (e.g., Glass & Hopkins, 1996; Hays, 1981; Heiman, 1996;Kerlinger, 1986; Kirk, 1995; Siegel, 1956; Shawlson, 1996; Wirier, 1971).3. Read research studies in professional journals extensively and critically.4. Carry on research studies involving some serious use of statistical procedures.337
318Par* rrr /Data AnalvsisWHAT IS STATISTICS?Statistics is a body of mathematical techniques or processes for gathering, organizing, analyzing, and interpreting numerical data. Because most research yields suchquantitative data, statistics is a basic tool of measurement, evaluation, and research.The word statistics is sometimes used to describe the numerical data gathered.Statistical data describe group behavior or group characteristics abstracted from anumber of individual observations that are combined to make generalizationspossible.Everyone is familiar with such expressions as “the average family income,”“the typical white-collar worker,” or “the representative city” These are statisticalconcepts and, as group characteristics, may be expressed in measurement of age,size, or any other traits that can be described quantitatively. When one says that“the average fifth-grade boy is 10 years old,” one is generalizing about all fifthgrade boys, not any particular boy. Thus, the statistical measurement is an abstraction that may be used in place of a great mass of individual measures.The research worker who uses statistics is concerned with more than the manipulation of data. The statistical method serves the fundamental purposes of descriptionand analysis, and its proper application involves answering the following questions:1. What facts need to be gathered to provide the information necessary to answerthe question or to test the hypothesis?2. How are these data to be selected, gathered, organized, and analyzed?3. What assumptions underlie the statistical methodology to be employed?4. What conclusions can be validly drawn from the analysis of the data?Research consists of systematic observation and description of the characteristics or properties of objects or events for the purpose of discovering relationshipsbetween variables. The ultimate purpose is to develop generalizations that may beused to explain phenomena and to predict future occurrences. To conduct research,one must establish principles so that the observation and description have a commonly understood meaning. Measurement is the most precise and universallyaccepted process of description, assigning quantitative values to the properties ofobjects and events.PARAMETRIC AND NONPARAMETRIC DATAIn the application of statistical treatments, two types of data are recognized:1. Parametric data. Data of this type are measured data, and parametric statisticaltests assume that the data are normally, or nearly normally, distributed. Parametric tests are applied to both interval- and ratio-scaled data.2. Nonparametric data. Data of this type are either counted (nominal) or ranked(ordinal). Nonparametric tests, sometimes known as distribution-free tests, donot rest on the more stringent assumption of normally distributed populations.
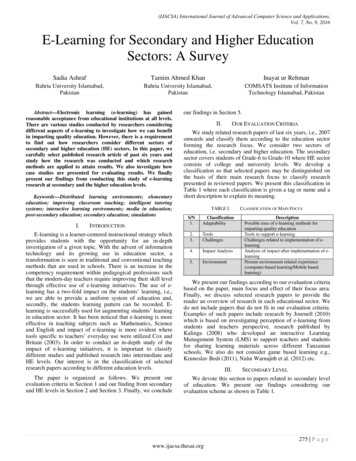
Chaatev 10 /Descriative Data AnalusisTABLE 10.1Levels of Quantitative asured equalintervalstrue zeroratio relationship3339Lntervaiparametricmeasured equalintervalsSOIIEAppropriate Testsi testanalysis of vdndnceanalysis of covariancefactor anaiy Pearson’s Ino true zero2Ordinalranked in order nonparametric1Nominalclassified andcountedSpearman’s rho ( p)Mann-WhitneyWilcoxonchi squaremedianswTable 10.1 presents a graphic summary of the levels of quantitative description and the types of statistical analysis appropriate for each level. These conceptswill be developed later in the discussion.However, one should be aware that many of the parametric statistics (t test,analysis of variance, and Pearson’s Y in particular) are still appropriate even whenthe assumption of normality is violated. This robustness has been demonstratedfor the t test, analysis of variance, and, to a lesser extent, analysis of covariance bya number of researchers including Glass, Peckham, and Sanders (1972), Lunney(1970), and Mandeville (1972). Thus, with ordinal data and even with dichotomous data (two choices such as pass-fail), these statistical procedures, which weredesigned for use with interval and ratio data, may be appropriate and useful. Pearson’s r, which can also be used with any type of data, will be discussed later in thischapter.DESCRIPTIVE AND INFERENTIAL ANALYSISUntil now we have not discussed the limits to which statistical analysis may begeneralized. Two types of statistical application are relevant:Descriptive AnalysisDescriptive statistical analysis limits generalization to the particular group ofindividuals observed. No conclusions are extended beyond this group, and any
340Part III/Data Analysissimilarity to those outside the group cannot be assumed. The data describe onegroup and that group only. Much simple action research involves descriptive analysis and provides valuable information about the nature of a particular group ofindividuals. Assessment studies (see Chapter 5) also often rely solely or heavilyon descriptive statistics.InferentialAnalysisInferential statistical analysis always involves the process of sampling and theselection of a small group assumed to be related to the population from which itis drawn. The small group is known as the sample, and the large group is the population. Drawing conclusions about populations based on observations of samplesis the purpose of inferential analysis.A statistic is a measure based on observations of the characteristics of a sample. A statistic computed from a sample may be used to estimate a parameter, thecorresponding value in the population from which the sample is selected. Statistics are usually represented by letters of our Roman alphabet such as X, S, and Y.Parameters, on the other hand, are usually represented by letters of the Greek alphabet such as ,u, g, or p.Before any assumptions can be made, it is essential that the individuals selectedbe chosen in such a way that the small group, or sample, approximates the largergroup, or population. Within a margin of error, which is always present, and bythe use of appropriate statistical techniques, this approximation can be assumed,making possible the estimation of population characteristics by an analysis of thecharacteristics of the sample.It should be emphasized that when data are derived from a group withoutcareful sampling procedures, the researcher should carefully state that findingsapply only to the group observed and may not apply to or describe other individuals or groups. The statistical theory of sampling is complex and involves theestimation of erra of inferred measurements, error that is inherent in estimatingthe relationship between a random sample and the population from which it isdrawn. Inferential data analysis is presented in Chapter 11.THE ORGANIZATION OF DATAThe list of test scores in a teacher’s grade book provides an example of unorganized data. Because the usual method of listing is alphabetical, the scores are difficult to interpret without some other type of organization.Alberts, JamesBrown, JohnDavis, MarySmith, HelenWilliams. Paul6078907088
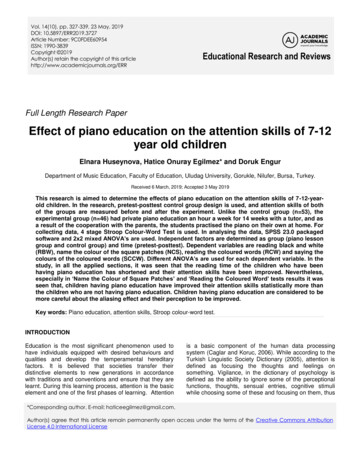
Chapter 10 /Descriptive Data AnalysisTABLE 10.298979593908887878585858482828280341Scores of 37 Students on aSemester Algebra Test808080807878787776767573727070706767646057The Ordered Array or SetArranging the same scores in descending order of magnitude produces what isknown as an ordered army.9088787060The ordered array provides a more convenient arrangement. The highest score(90), the lowest score (60), and the middle score (78) are easily identified. Thus, therange (the difference between the highest and lowest scores, plus one) can easilybe determined.Illustrated in Table 10.2 is a data arrangement of 37 students’ scmes on an algebra test in ordered array form.Grouped Data DistributionsData are often more clearly presented when scmes are grouped and a frequency column is included. Data can be presented in frequency tables (see Table 10.3 on page342) with different class intervals, depending on the number and range of the scores.A score interval with an odd number of units may be preferable because itsmidpoint is a whole number rather than a fraction. Because all scores are assumedto fall at the midpoint of the interval (for purposes of computing the mean), thecomputation is less complicated:Even interval of four: 8 9 10 11 (midpoint 9.5)Odd interval of five: 8 9 10 11 12 (midpoint 10)There is no rule that rigidly determines the proper score interval, and intervals of 10 are frequently used.
342Part Ill/Data AnalysisTABLE 10.3F33 Ieseon Algebra Test Grouped in IntervalsScore 6-60TalliesFrequency (f)Includes11111111I*n 112247(96 97 98 99 100)(91 92 93 94 95)etc.L&EM111111l&B1113512N 37STATKTICAL MEASURESSeveral basic types of statistical measures are appropriate in describing and analyzing data in a meaningful way:Measuresofcentral tendency OY averagesMEIllMedianModeMeasuresofspread or dispersionRangeVarianceStandard deviationMeasuresof relative positionStandard scoresPercentile rankPercentile scoreMeasuresof relafionshipCoefficient of correlationMeasures of Cenfral TendencyNonstatisticians use averages to describe the characteristics of groups in a generalway. The climate of an area is often noted by average temperature or average amountof rainfall. We may describe students by grade-point averages or by average age.Socioeconomic status of groups is indicated by average income, and the return on
Chapter 10 /Descriptive Data Analysis343an investment portfolio may be judged in terms of average income return. But to thestatistician the term average is unsatisfactory, for there are a number of types of averages, only one of which may be appropriate to use in describing given characteristics of a group. Of the many averages that may be used, three have been selected asmost useful in educational research: the mean, the median, and the mode.The Mean (x)The mean of a distribution is commonly understood as the arithmetic average. Theterm grade-point nvemge, familiar to students, is a mean value. It is computed bydividing the sum of all the scores by the number of scores. In formula formx “xNwhere x meanx sumofX scores in a distributionN number of scoresN 6x 2116 3.50The mean is probably the most useful of all statistical measures, for, in addition to the information that it provides, it is the base from which many otherimportant measures are computed.Appendix B contains a data set from a population of 100 children (one set inMicrosoft Excel and one in SPSS format). The data for each child includes an IDnumber, the method of teaching reading that was received, the gender, the category of special education in which the child has been classified (LD learningdisabilities; BD behavior disordered; MR mild mental retardation), and bothpre and posttest scores. The reader may wish to randomly select a sample of 25children (or 15 children if recommended by the professor) from the appendix foruse in a variety of calculations throughout this chapter. Now calculate the meanfor this sample of 25 children’s IQ. The mean of the population given in the appendix is 86.12. How does the sample mean compare to the population mean?
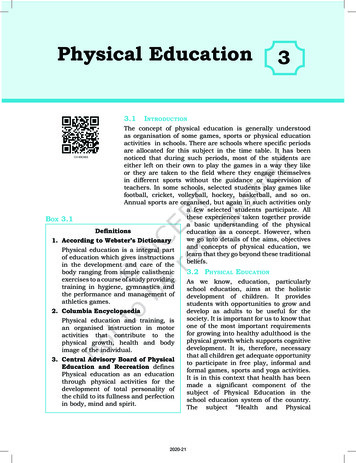
The Median (Md)The median is a point (not necessarily a score) in an array, above and below whichone-half of the scores fall. It is a measure of position rather than of magnitude andis frequently found by inspection rather than by calculation. When there are anodd number of untied scores, the median is the middle score, as in the examplebelow:763 scores above54 - median323 scores belowWhen there are an even number of untied scores, the median is the midpointbetween the two middle scores, as in the example below:653 scores above4-median 3.50321If the data include tied scores at the median point, interpolation within the tiedscores is necessary. Each integer would represent the interval from halfway betweenit and the next lower score to halfway between it and the next higher score. Whenties occur at the midpoint of a set of scores, this interval is portioned out into thenumber of tied scores and the midpoint or median is found. Consider the set ofscores in Figure 10.1.Because there are four scores tied (75), the interval from 74.5 to 75.5 is dividedinto four equal parts. Each of the scores is then considered to occupy 0.25 of theinterval, and the median is calculated.One purpose of the mean and the median is to represent the “typical” score;most of the time it is satisfactory to use the mean for this purpose. However, whenthe distribution of scores is such that most scores are at one end and relatively feware at the other (known as a skewed distn’bution), the median is preferable becauseit is not influenced by extreme scores at either end of the distribution. In the following examples the medians are identical. However, the mean of Group A is 4,
Chapter 10 /Descriptive Data Analysis3457073740.25 F 750.257574.50 - lower limit74.75 - median75.2575.50 c- upper limit80FIGURE 10.1 Median Calculationand the mean of Group B is 10. The mean and median are both representative ofGroup A, but the median better represents the “typical” sccre of Group B.Group AGroup B765506521204-Md34-Md3Thus, in skewed data distributions the median is a more realistic measure ofcentral tendency than the mean.In a small school with five faculty members, the salaries might beTeacher A536,000B22,000C21,400 MedianD21,000E19,600Total Salaries 120,000FE120,000 24,0005The average salary of the group is represented with a different emphasis bythe median salary ( 21,400) than by the mean salary ( 24,000), which is substantially
346Part 111 /Data Andysishigher than that of four of the five faculty members. Thus, we see again thatthe median is less sensitive than the mean to extreme values at either end of adistribution.Using the same 25 children selected from Appendix B to calculate a mean, nowcalculate the median. How do the two compare? Which is more useful? Themedian for the population of 100 children is 89.0 (5 scores of 89 fall below the midpoint and 5 above it). How does the sample median compare?The Mode (MO)654Mode4 I321The mode is the score that occurs most frequently in a distribution. It is locatedby inspection rather than by computation. In grouped data distributions the modeis assumed to be the midscore of the interval in which the greatest frequencyoccurs.For example, if the modal age of fifth-grade children is 10 years, it follows thatthere are more 10.year-old fifth-graders than any other age. Or a menswear salesman might verify the fact that there are more sales of size 40 suits than of any othersize; consequently, a larger number of size 40 suits are ordered and stocked, size40 being the mode.In some distributions there may be more than one mode. A two-mode distribution is referred to as bimodal, nmre than two, multimodal. If the number of autoaccidents on the streets of a city were tabulated by hours of occurrence,
The eighth edition of Research in Education has the same goals as the previous edi-tions. The book is meant to be used as a research reference or as a text in an intro-ductory course in research methods. It is appropriate for graduate students enrolled in a research seminar