Transcription
Introduction to Regression Models for Panel Data AnalysisIndiana UniversityWorkshop in MethodsOctober 7, 2011Professor Patricia A. McManusPanel Data Analysis October 2011
What are Panel Data?Panel data are a type of longitudinal data, or data collected at differentpoints in time. Three main types of longitudinal data: Time series data. Many observations (large t) on as few as one unit (smallN). Examples: stock price trends, aggregate national statistics. Pooled cross sections. Two or more independent samples of many units(large N) drawn from the same population at different time periods:o General Social Surveyso US Decennial Census extractso Current Population Surveys* Panel data. Two or more observations (small t) on many units (large N).o Panel surveys of households and individuals (PSID, NLSY, ANES)o Data on organizations and firms at different time pointso Aggregated regional data over time This workshop is a basic introduction to the analysis of panel data. Inparticular, I will cover the linear error components model.WIM Panel Data Analysis October 2011 Page 1
Why Analyze Panel Data? We are interested in describing change over timeo social change, e.g. changing attitudes, behaviors, social relationshipso individual growth or development, e.g. life-course studies, childdevelopment, career trajectories, school achievemento occurrence (or non-occurrence) of events We want superior estimates trends in social phenomenao Panel models can be used to inform policy – e.g. health, obesityo Multiple observations on each unit can provide superior estimates ascompared to cross-sectional models of association We want to estimate causal modelso Policy evaluationo Estimation of treatment effectsWIM Panel Data Analysis October 2011 Page 2
What kind of data are required for panel analysis? Basic panel methods require at least two “waves” of measurement.Consider student GPAs and job hours during two semesters of college. One way to organize the panel data is to create a single record for eachcombination of unit and time A2.82.82.52.5GPA3.02.12.22.5JobHrs0201010 Notice that the data include:o A time-invariant unique identifier for each unit (StudentID)o A time-varying outcome (GPA)o An indicator for time (Semester). Panel datasets can include other time-varying or time-invariant variablesWIM Panel Data Analysis October 2011 Page 3
An alternative way to structure the data is to keep all the measuresrelated to each student in a single record. This is sometimes called“wide” format.StudentID Female HSGPA GPA51702.83.02312.52.2JobHrs5 GPA602.1102.5JobHrs62010o Why are there two variables for GPA and JobHrs ?o Why is there only one variable for gender and high school GPA?o Where is the indicator for time?WIM Panel Data Analysis October 2011 Page 4
Estimation Techniques for Panel ModelsWe can write a simple panel equation predicting GPA from hours worked:GPAit0TERMitTHSGPAitHJOBitJvit General Linear Model is the foundation of linear panel model estimationo Ordinary Least Squares (OLS)o Weighted least squares (WLS)o Generalized least squares (GLS)Least-squares estimation of panel models typically entails three steps:(a) Data transformation or first-stage estimation(b) Estimation of the parameters using Ordinary Least Squares(c) Estimation of the variance-covariance matrix of the estimates (VCE)Parameter estimates are sometimes refined using iteratively reweightedleast squares (IRLS), a maximum likelihood estimator.WIM Panel Data Analysis October 2011 Page 5
Basic Questions for the Panel AnalystWhat’s the story you want to tell? Is this a descriptive analysis? Less worry, fewer controls are usually better. Is this an attempt at causal analysis using observational data? Carefulspecification AND theory is essential.How does time matter? Some analyses, e.g. difference-in-difference analysis associates time withan event (before and after) Some analyses may be interested in growth trajectories. Panel analysis may be appropriate even if time is irrelevant. Panel modelsusing cross-sectional data collected at fixed periods of time generally usedummy variables for each time period in a two-way specification withfixed-effects for time.Are the data up to the demands of the analysis?Panel analysis is data-intensive. Are two waves enough?Can you perform the necessary specification tests?How will you address panel attrition?WIM Panel Data Analysis October 2011 Page 6
Review of the Classical Linear Regression Modelyi0x1i1x 2i2.xkikui , i 1,2,3, NWhere we assume that the linear model is correct and: Covariates are Exogenous:E ui x1i , x 2i ,., xki Uncorrelated errors:Cov ui , u j Homoskedastic errors:Var ui00Var yi x1i , x 2i ,., x ki2If assumptions do not hold, OLS estimates are BIASED and/or INEFFICIENT Biased Expected value of parameter estimate is different from true.o Consistency. If an estimator is unbiased, or if the bias shrinks as thesample size increases, we say it is CONSISTENT Inefficient - (Informally) Estimator is less accurate as sample sizeincreases than an alternative estimator.o Estimators that take full advantage of information more efficientWIM Panel Data Analysis October 2011 Page 7
OLS Bias Due to Endogeneity Omitted Variable Biaso Intervening variables, selectivity Measurement Error in the Covariates Simultaneity Biaso Feedback loopso Omitted variablesConventional regression-based strategies to address endogeneity bias Instrumental Variables estimationStructural Equations ModelsPropensity score estimationFixed effects panel modelsWIM Panel Data Analysis October 2011 Page 8
OLS Inefficiency due to Correlated ErrorsMany data structures are susceptible to error correlation: Hierarchical data sample multiple individuals from each unit, e.g.household members, employees in firms, multiple pupils from each school. Multistage probability samples often incorporate cluster-based samplingdesigns with errors that may be correlated within clusters. Repeated observations data often show within-unit error correlation. Time series data often have errors that are serially correlated, that is,correlated over time. Panel data have errors that can be correlated within unit (e.g. individuals),within period.Conventional regression-based strategies to address correlated errors Cluster-consistent covariance matrix estimator to adjust standard errors. Generalized Least Squares instead of OLS to exploit correlation structure.WIM Panel Data Analysis October 2011 Page 9
Linear Panel Data Model (LPM)Suppose the data are on each cross-section unit over T time periods:yi,t 1x 'i,t 1t1ui,t 1yi,t 2:::yi,Tx 'i,t 2t2ui,t 1x 'i,TT,t 1,2, ,Tui,TWe can express this concisely using yi to represent the vector of individualoutcomes for person i across all time periods:yiXiui , where yi'yi,t 1, yi,t 2,., yiTFor comparison, begin with two conventional OLS linear regression models,one for each period. Note that the variables female highgpa (HSGPA) is time-invariant.WIM Panel Data Analysis October 2011 Page 10
OLS Results for each term:InterceptjobhrsfemalehighgpaTerm 5 GPAEstimate 4.02.5-0.1Term 6 -stat18.3-3.63.20.1Pooled OLS Results for both terms:Interceptjobhrsfemalehighgpaterm6Term .17 25.10.05 -5.40.044.10.03 -0.010.016 6.1Term 5&6 GPA (Clustered 0.043.00.00010.03-0.00040.0950.0166.1WIM Panel Data Analysis October 2011 Page 11
Linear Unobserved Effects Panel Data Model Motivation: Unobserved heterogeneitySuppose we have a model with an unobserved, time-constant variable c:yx101x22.xkkcuWhere u is uncorrelated with all explanatory variables in x.Because c is unobserved it is absorbed into the error term, sowe can write the model as follows:yvx10c1x22.xkkvuThe error term v consists of two components, an “idiosyncratic”component u and an “unobserved heterogeneity” component c .WIM Panel Data Analysis October 2011 Page 12
OLS Estimation of the Error Components Model If the unobserved heterogeneity ci is correlated with one or more of theexplanatory variables, OLS parameter estimates are biased andinconsistent. If the unobserved heterogeneity c is uncorrelated with the explanatoryvariables in xi , OLS is unbiased even in a single cross-section. If we have more than one observation on any unit, the errors will becorrelated and OLS estimates will be inefficientyi,10x1i11x2yi,20x1i21x2vi,1 ci ui,1vi,2 ci ui,2cov(vi,1, vi,2 ) 0i12.xki22.xki1i2kkvi,1vi,2WIM Panel Data Analysis October 2011 Page 13
Unobserved Heterogeneity in Panel DataSuppose the data are on each cross-section unit over T time periods.This is an unobserved effects model (UEM), also called the errorcomponents model. We can write the model for each time period:yi 1yi 2xi 1xi 2ciciui 1ui 2yiTxiTciuiT,Where there are T observations on outcome y for person i,xit is a vector of explanatory variables measured at time t,ci is unobserved in all periods but constant over timeuit is a time-varying idiosyncratic errorDefine vitciuit as the composite error.WIM Panel Data Analysis October 2011 Page 14
Consistent estimation of the Error Components Model with Pooled OLSIf we assume no contemporaneous correlation of the errors and theexplanatory variables, pooled OLS estimation is consistent:E (xit' uit )0 and E (xit' ci )0,t 1,2, ,TEfficient estimation of the Error Components Model with Pooled OLSEven if estimation is consistent, pooled OLS may not be efficient. One strategy is to combine pooled OLS with cluster-consistent standarderrors. Panel GLS methods may be preferred.In the next sections, we consider the dominant approaches to estimationof the error components panel model: fixed effects and random effects.WIM Panel Data Analysis October 2011 Page 15
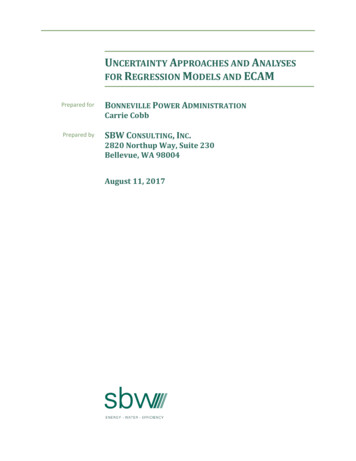
200300400500600700Illustration of Within-unit correlation. Peak-flow Measurements123456789 10 11 12 13 14 15 16 17Subject IDWright Peak #1Wright Peak #2WIM Panel Data Analysis October 2011 Page 16
Just a few panel data examples:Propper and Van Reenen (2010)Effect of regulation of nursing pay on hospital qualityData: 209 NHS Hospitals in the UK 1997-2005Western, Bruce (2002)Effect of Incarceration on wages and income inequalityData: NLSYCherlin, Chase-Lansdale and McRae (1998)Effect of parental divorce on mental health over life-courseData: British Cohort StudyJacobs and Carmichael (2002)Determinants of Death Penalty in US statesData: US Census 1970, 1980, 1990 other sourcesBaum and Lake (2003)Effect of Democracy on Human Capital and Economic GrowthData: Aggregate data on 128 countries over 30 yearsWIM Panel Data Analysis October 2011 Page 17
Fixed Effects Methods for Panel DataSuppose the unobserved effect ci is correlated with the covariates.Example: Motherhood wage penalty We observe that mothers earn less than other women, cet par.ˆKIDSOLS0.08 in a log wage model suggests that each additionalchild reduces mothers’ hourly wages by about 8%But if women who are less oriented towards work are also more likely tohave more children, omitting “work orientations” from the model will biasthe coefficient on children. Fixed-effects methods transform the model to remove ciˆKIDSFE0.03 FE estimates a persistent but much smaller penalty.WIM Panel Data Analysis October 2011 Page 18
Caution: Fixed effects has some disadvantages FE is not a panacea for all sources of endogeneity bias.time-varying unobserved effectstime-varying measurement errorsimultaneity or feedback loops All time-constant effects are removed.No estimation of effects of race, gender, birth order, etc.Poor estimates if little variation (e.g. education in adulthood) FE trades consistency for efficiency.FE uses only within-unit change, ignores between-unit variation.Parameter estimates may be imprecise, standard errors large. Despite limitations, FE is an indispensable tool in the panel analyst’stoolbox.Fixed Effects Transformation - the “Within” EstimatorWIM Panel Data Analysis October 2011 Page 19
Suppose we have the UEM model:xit'yituit ,cit 1,2, ,TFor each unit, average this equation over all time periods t:xi'yiciuiSubtract the within-unit average from each observation on that unit:yitxit'yixi'ciciuitui ,t 1,2, ,TThis is the fixed effects transformation. We can write it as:yitwhere cicixit'0 and yituit ,yityi , xitxitxi , uituituiand xit does not contain an intercept term.WIM Panel Data Analysis October 2011 Page 20
The fixed-effects estimator, also called the within estimator, applies pooledOLS to the transformed equation:ˆ1NNXi' XiFEi 1N1TXi' yii 1Recall the student GPA Data:StudentID Semester Female1750176023512361NTxit' xiti 1t 1HSGPA2.82.82.52.5GPA3.02.12.22.5xit' yiti 1t 1JobHrs0201010After applying the fixed-effects transform, the demeaned (mean-centered)data:StudentID Semester CFemale CHSGPA CGPA CJobHrs17-.500.45 -1017.500-.45 1023-.500-.15 023.500.15 0WIM Panel Data Analysis October 2011 Page 21
Fixed Effects Dummy Variables RegressionUp to now, we’ve treated the unobservables ci as random variables:yitxit'ciuitAn alternative approach is to treat ci as a fixed parameter for each unit. Inthis case, we can use dummy variables regression to estimate ci .Step one: Create a dummy variable for each of sample unit iStep two: Substitute the vector of N-1 dummies for ci :yit1xit'(where the interceptd212d33.dNNuit ,estimates the effect when d 1 1)Step three: Estimate the equation using pooled OLS. The fixed effects dummy variables (FEDV) estimator produces preciselythe same coefficient vector and standard errors as the FE estimator.WIM Panel Data Analysis October 2011 Page 22
*** Practical asidesOne way or two? Sometimes you will see “one-way” or “two-way” FE.One-way fixed effects error components model - only the unit effects areconditioned out.Two-way fixed effects error components model – both the unit effects andperiod effects are conditioned out.In the conventional FE model with large N and small T, it is a simplematter to create dummy variables for each period, and most panel modelswill include controls for period effects.Statistical SoftwareMost statistical packages offer several alternatives for estimating the FEM.STATA xtregaregreg (with factor variables)SASproc panel proc glm (with “absorb” statement)WIM Panel Data Analysis October 2011 Page 23
First Differencing Methods The first difference (FD) model transforms the UEM model to remove theunobserved effects ci FD is sometimes called a first-difference fixed effects modelSuppose we have the unobserved effects model (UEM):xit'yituit ,ciFor each observation, subtract the previous within-unit observation:yityi,txit'1xi' ,tci1ciuitui,t1This is the first-difference transformation. We can write it as:yitwhereci0 andxit'uit ,xit does not contain an intercept term.WIM Panel Data Analysis October 2011 Page 24
Consider the two-period data student GPA .82.82.52.5GPA3.02.12.22.5JobHrs0201010After applying the first-difference transform, the differenced PA dGPA dJobHrs.0-.9 20.0.30WIM Panel Data Analysis October 2011 Page 25
Fixed Effects and First Differences in the Two-Period CaseFE (Within) TransformStudentID Semester17-.517.523-.523.5CFemale0000CHSGPA CGPA CJobHrs0.45 -100-.45 100-.15 00.15 0FD (Differenced) Transform:StudentID DSemester dFemale dHSGPA dGPA dJobHrs17100-.9 2023100.30Compare the transformed (FE) and differenced (FD) data. Each FD variableis equal to the difference between the second-period FE demeanedvariable and the first-period demeaned variable.This symmetry will always be present in the two-period panel model.As a result, the parameter estimates for the two-period panel model canbe obtained using FD or FE, with identical results. Not so if T 2 !WIM Panel Data Analysis October 2011 Page 26
FE and FD Results for two terms:jobhrsterm6Term 5&6 GPA (FE, N 400)EstimateSE-0.0640159 0.02238350.1133996 0.0125627Term 5&6 GPAEstimate-0.06401590.1133996(FD, N 200)SE0.02238350.0125627FE and FD Results for six terms:jobhrstermTerms 1-6 GPA (FE, N 1200)EstimateSE-0.1285521 0.01884150.1037983 0.0040011Term 1-6 GPAEstimate-0.0873160.1066726(FD, N 1000)SE0.01741870.0091661WIM Panel Data Analysis October 2011 Page 27
Difference-in-Difference Model for Panel Data using FDSuppose we have a treatment that affects some but not all units in thepopulation. The “difference-in-differences” estimator is the differencebetween the change over time in the treatment group and the change overtime in the control:DIDyB,2yB,1yA,2yA,1If we have panel data from a time period prior to treatment and a secondobservation drawn after the treatment event, we can study treatmenteffects using 2-period panel data FD and DID:yi1yi 20PD PERIODi 1TREAT treatmenti 10PD PERIODi 1TREAT treatmenti 2vi1, andvi 2Where treatmenti1 indicates treatment, zero for all at time t 1PERIOD is a dummy for the time period.WIM Panel Data Analysis October 2011 Page 28
The first difference model for e the intercept is replaced by a period effect ( PERIODunits and the change in treatment is either 0 or 1.Designate A as the control group (i.e.treatmentiDesignate B as the treatment group (i.e.yiPDTREATtreatmenti0)Atreatmenti1 for allB1)viDifference in differences tiB)( ˆPDˆTREATtreatmentiATREATe.g. Card & Krueger (2000) Minimum Wage increases & EmploymentWIM Panel Data Analysis October 2011 Page 29
Choosing an Estimator: Fixed Effects vs. First Differences (FE vs FD) If T 2, (two period model) the FE and FD are identical If T 2 FE is more efficient than if there is no serial correlation of theidiosyncratic errors. If T 2 FD is more efficient if there is serial correlation. If the unobserved error is not correlated with the covariates, neither theFE nor the FD model is efficient.WIM Panel Data Analysis October 2011 Page 30
Why not Just Use a Lagged Dependent Variable?Source: David Johnson. Journal of Marriage and Family, Vol. 67, No. 4 (Nov., 2005), pp. 1061-1075WIM Panel Data Analysis October 2011 Page 31
Random Effects MethodsIf we can assume that the unobserved heterogeneity will not bias theestimates: Fixed effects methods are inefficient. They throw away information. Pooled OLS is inefficient because it does not exploit the autocorrelationin the composite error term. Random effects methods use feasible GLS estimation (RE FGLS) toexploit within-cluster correlation Random effects estimation is more efficient than FE or OLS The “random effects assumption” of no bias due to ci is more stringentE (ci xi1,., xiT )E (ci )0WIM Panel Data Analysis October 2011 Page 32
A Conventional FGLS Random Effects EstimatorAssume the errors are correlated within each unitAssume the errors are uncorrelated across unitsAssume the variance in the composite errors is equal to the sum of thevariances in the unobserved effectci and the idiosyncratic error ui :2v2uRE strategy: If2c2v2u2c,find estimators such that ˆv2ˆu2ˆc2WIM Panel Data Analysis October 2011 Page 33
Practical Feature of Random Effects Estimation Recall that the fixed effects “within” estimator essentially transformsthe data by centering each variable on the unit-specific mean.OLS is then performed on the “fully demeaned” transformed data. The random effects estimator essentially transforms the data by“partially demeaning” each variable. Instead of subtracting the entireunit-specific mean, only part of the mean is subtracted.The demeaning factor is between 0 and 1, with the specific valuebased on the variance components estimation. Random effects routines are standard in statistical software packages:SAS: PROC GLM or PROC PANELSTATA: xtregWIM Panel Data Analysis October 2011 Page 34
RE Results compared to pooled OLS Results for two terms:Interceptjobhrsfemalehighgpaterm6RE Term 5&6 GPAEstimate SEz-stat2.810.16 18.0-0.1080.02 -4.80.1260.043.0-0.0010.03 -0.040.0960.015 5.6OLS Term 5&6 0.043.00.00010.03-0.00040.0950.0166.1RE Results for six terms:InterceptjobhrsfemalehighgpatermTerms 1-6 GPA (FE, N .8-0.0300.021.20.0880.006 13.6WIM Panel Data Analysis October 2011 Page 35
Random Effects or Fixed Effects - How to decide?Hausman test for the Exogeneity of the Unobserved Error ComponentIf the unobserved effects are exogenous, the FE and RE are asymptoticallyequivalent. This suggests the null hypothesis for the Hausman test:H 0 : ˆ REˆFE,where ˆ RE and ˆ FE are coefficient vectors for the time-varying explanatoryvariables, excluding the time variables.If the null hypothesis is rejected, we conclude that RE is inconsistent, and theFE model is preferred.If the null hypothesis cannot be rejected, random effects is preferred becauseit is a more efficient estimator.WIM Panel Data Analysis October 2011 Page 36
Hausman Test in Stata:.xtreg gpaestimatesxtreg gpaestimatesjob sex highgpa,festore fejob sex highgpa,restore re. hausman fe re---- Coefficients --- (b)(B)(b-B)sqrt(diag(V b-V B)) fereDifferenceS.E.------------- ------------job ---------b consistent under Ho and Ha; obtained from xtregB inconsistent under Ha, efficient under Ho; obtained from xtregTest:Ho:difference in coefficients not systematicchi2(1) (b-B)'[(V b-V B) (-1)](b-B) 30.25Prob chi2 0.0000 We reject the null and conclude the fixed effects estimator is appropriate.WIM Panel Data Analysis October 2011 Page 37
Interpretation of Results from the Error Components ModelSince the UEM model is derived as a levels model, coefficients can beinterpreted much the same as interpretations of a conventional OLSmodel, but there are nuances:For example, suppose we estimate the relationship between marriage andmen’s wages, ˆMARRIED0.05 in every model. Pooled OLS cross-section coefficients contain information about averagedifferences between units.E[yit xit ]xitciThis is a population-averaged effect. On average, married men earn 5%more than men who are not married.This says nothing about the causal effect of marriage on men’s earnings.WIM Panel Data Analysis October 2011 Page 38
RE/FE/FD estimate average effects within units.If the unobserved effects are exogenous these are asymptoticallyequivalent to the population averaged effect.E[yit xit , ci ]xitThis is sometimes called an average treatment effect. On average,entering marriage increases men’s earnings by 5%. RE coefficients represent average change within units, estimated from allunits whether they experience change or not. FE and FD coefficients represent average changes within units, only forunits that did experience changeThis is akin to a treatment effect among the treated. On average, menwho married increased their earnings by 5%.WIM Panel Data Analysis October 2011 Page 39
Best PracticesTheorize the model What exactly does this unobserved heterogeneity represent? Why would you expect it to be correlated / uncorrelated with theregressors?Specification Testing for Panel Analysis - Interval/Continuous Outcomes Before ruling out pooled OLS, test for appropriateness of panel methodsvs. pooled ordinary least square. Optional: Obtain intraclass correlation coefficient (ICC) as indicator of theextent of within-unit clustering. This is a descriptive statistic, not a test. Specification tests for strict exogeneity Test for serial correlation in the idiosyncratic errors Hausman test for random effects vs. fixed effectsWIM Panel Data Analysis October 2011 Page 40
ExtensionsFE Models with Time-Invariant Predictors Interactions between time and covariatePanel Models for Categorical Outcomes Fixed effects logit and random effects logit for binary outcomes Fixed and random effects Poisson models can be used for count outcomes. Population averaged models can be estimated using General EstimationEquations (GEE).Dynamic panel models i.e. lagged dependent variable as a covariate:GPAit0GPAi,t1 GPATERMitTHSGPAitHJOBitJvit GLM models for instrumental variables (IV) estimation Generalized Method of Moments (GMM) is used for some dynamic panelmodels because it allows a flexible specification of the instrumentsWIM Panel Data Analysis October 2011 Page 41
Oct 07, 2011 · Panel analysis may be appropriate even if time is irrelevant. Panel models using cross-sectional data collected at fixed periods of time generally use dummy variables for each time period in a two-way specification with fixed-effects for time. Are the data up to the demands of the analysis? Panel