Transcription
Design of Experiments (DOE) Using the Taguchi ApproachThis document contains brief reviews of several topics in the technique. For summaries of therecommended steps in application, read the published article attached.(Available for free download and review.)TOPICS: Subject Overview References Taguchi Method Review Application Procedure Quality Characteristics Brainstorming Factors and Levels Interaction Between Factors Noise Factors and Outer Arrays Scope and Size of Experiments Order of Running Experiments Repetitions and Replications Available Orthogonal Arrays Triangular Table and Linear Graphs Upgrading Columns Dummy Treatments Results of Multiple Criteria S/N Ratios for Static and Dynamic Systems Why Taguchi Approach and Taguchi vs. Classical DOE Loss Function General Notes and Comments Helpful Tips on ApplicationsQuality Digest ArticleExperiment Design SolutionsCommon Orthogonal ArraysOther References:1. DOE Demystified. : 02/1202qmdesign.asp2. 16 Steps to Product. tml3. Read an independent review of /body software.html4. A Strategy for Simultaneous Evaluation of Multiple Objectives, A journal of the Reliability AnalysisCenter, 2004, Second quarter, Pages 14 - 18. http://rac.alionscience.com/pdf/2Q2004.pdf5. Design of Experiments Using the Taguchi Approach : 16 Steps to Product and ProcessImprovement by Ranjit K. Roy Hardcover - 600 pages Bk&Cd-Rom edition (January 2001) JohnWiley & Sons; ISBN: 04713610116. Primer on the Taguchi Method - Ranjit Roy (ISBN:087263468X Originally published in 1989 byVan Nostrand Reinhold. Current publisher/source is Society of Manufacturing Engineers). The book isavailable directly from the publisher, Society of Manufacturing Engineers (SME ) P.O. Box 6028,Dearborn, Michigan 48121, USA.256 Pages. 50 Illustrations. Order code: 2436-2487.For open enrollment seminar on Taguchi DOE technique, visit http://Nutek-us.com/wp-s4d.html .www.Nutek-us.com
Subject Overview (The Taguchi Approach)Design Of Experiments (DOE) is a powerful statisticaltechnique introduced by R. A. Fisher in England inthe 1920's to study the effect of multiple variablessimultaneously. In his early applications, Fisherwanted to find out how much rain, water, fertilizer,sunshine, etc. are needed to produce the best crop.Since that time, much development of the techniquehas taken place in the academic environment, but didhelp generate many applications in the productionfloor.As a researcher in Electronic Control Laboratory inJapan, Dr. Genechi Taguchi carried out significantresearch with DOE techniques in the late 1940's. Hespent considerable effort to make this experimentaltechnique more user-friendly (easy to apply) andapplied it to improve the quality of manufacturedproducts. Dr. Taguchi's standardized version of DOE,popularly known as the Taguchi method or Taguchiapproach, was introduced in the USA in the early1980's. Today it is one of the most effective qualitybuilding tools used by engineers in all types ofmanufacturing activities.The DOE using Taguchi approach can economicallysatisfy the needs of problem solving andproduct/process design optimization projects. Bylearning and applying this technique, engineers,scientists, and researchers can significantly reducethe time required for experimental investigations.DOE can be highly effective when yow wish to:- Optimize product and process designs, studythe effects of multiple factors (i.e.- variables,parameters, ingredients, etc.) on theperformance, and solve production problemsby objectively laying out the investigativeexperiments. (Overall application goals).- Study Influence of individual factors on theperformance and determine which factor hasmore influence, which ones have less. Youcan also find out which factor should havetighter tolerance and which tolerance shouldbe relaxed. The information from theexperiment will tell you how to allocatequality assurance resources based on theobjective data. It will indicate whether asupplier's part causes problems or not(ANOVA data), and how to combine differentfactors in their proper settings to get the bestresults (Specific Objectives).Further, the experimental data will allow youdetermine:- How to substitute a less expensive part to get thesame performanceimprovementyouproposeNutek, Inc. BloomfieldHills, MI.USA.Tel: 1-248-540-4827--How much money you can save the designHow you can determine which factor iscausing most variations in the resultHow you can set up your process such that itis insensitive to the uncontrollable factorsWhich factors have more influence on themean performanceWhat you need to do to reduce performancevariation around the targetHow your response varies proportional tosignal factor (Dynamic response)How to combine multiple criteria ofevaluation into a single indexHow you can adjust factor for overallsatisfaction of criteria an adjust factors for asystem whose of evaluationsHow the uncontrollable factors affect theperformanceetc.,Advantage of DOE Using Taguchi ApproachThe application of DOE requires careful planning,prudent layout of the experiment, and expert analysisof results. Based on years of research andapplications Dr. Genechi Taguchi has standardizedthe methods for each of these DOE application stepsdescribed below. Thus, DOE using theTaguchiapproach has become a much more attractive tool topracticing engineers and scientists.Experiment planning and problem formulation Experiment planning guidelines are consistent withmodern work disciplines of working as teams.Consensus decisions about experimental objectivesand factors make the projects more successful.Experiment layout -High emphasis is put on cost andsize of experiments. Size of the experiment for agiven number of factors and levels is standardized.Approach and priority for column assignments areestablished. Clear guidelines are available to dealwith factors and interactions (interaction tables).Uncontrollable factors are formally treated to reducevariation. Discrete prescriptions for setting up testconditions under uncontrollable factors aredescribed. Guidelines for carrying out theexperiments and number of samples to be tested aredefinedData analysis -Steps for analysis are standardized(main effect, NOVA and Optimum). Standardpractice for determination of the optimum isrecommended. Guidelines for test of significanceand pooling are defined.Support@Nutek-us.com www.Nutek-us.com 0607 Page 2
Interpretation of results - Clear guidelines aboutmeaning of error term. Discrete indicator aboutconfirmation of results (Confidence interval). Abilityto quantify improvements in terms of dollars (Lossfunction)Overall advantage - DOE using Taguchi approachattempts to improve quality which is defined as theconsistency of performance. Consistency is achievedwhen variation is reduced. This can be done bymoving the mean performance to the target as wellas by reducing variations around the target. Theprime motivation behind the Taguchi experimentdesign technique is to achieve reduced variation(also known as ROBUST DESIGN). This technique,therefore, is focused to attain the desired qualityobjectives in all steps. The classical DOE does notspecifically address quality ."The primary problem addressed in classicalstatistical experiment design is to model theresponse of a product or process as a function ofmany factors called model factors. Factors, callednuisance factors, which are not included in themodel, can also influence the response. Theprimary problem addressed in Robust Design is howto reduce the variance of a product's function in thecustomer's environment." -Madhav Phadke, QualityEngineering using Robust Design.APPROACH: ROBUST DESIGN- Reduce variation without actually removingthe cause of variation. Achieve consistentperformance by making product/process insensitiveto the influence of uncontrollable factors.WHAT DOES IT DO? - Optimize design, solveproblems, build robust products, etc.WHAT DOES IT DO?- Optimize design, solve problems, build robustproducts, etc.WHY DO IT?- Save cost (Reduce warranty, rejection andcost of development).AREAS OF APPLICATION:- Analytical simulation (in early stages ofdesign).- Development testing (in design anddevelopment).- Process development.- Manufacturing.- Problem solving in all areas of manufacturingand production.WHAT'S NEW?1. NEW PHILOSOPHY- Building quality in the product design.- Measuring quality by deviation from target (notby rejection).2. NEW DISCIPLINE- Complete planning of experiments andevaluation criteria before conducting experiments.- Determining a factor's influence by running thecomplete experiment.3. SIMPLER AND STANDARDIZEDEXPERIMENT DESIGN FORMAT- Orthogonal arrays for experimental design.- Outer array design for robust product design.- More clear and easier methods for analysis ofresults.QUALITY: DEFINITION and OBJECTIVE- Reduced variation around the target with leastcost.http://nutek-us.com/wp-txt.htmlNutek, Inc. Bloomfield Hills, MI. USA. Tel: 1-248-540-4827 Support@Nutek-us.com www.Nutek-us.com 0607 Page 3
TAGUCHI METHOD REVIEWBRAINSTORMINGAPPLICATION STEPSThe Taguchi method is used to improve thequality of products and processes. Improved qualityresults when a higher level of performance isconsistently obtained.The highest possible performance is obtainedby determining the optimum combination of designfactors. The consistency of performance is obtainedby making the product/process insensitive to theinfluence of the uncontrollable factor. In Taguchi'sapproach, the optimum design is determined byusing design of experiment principles, andconsistency of performance is achieved by carryingout the trial conditions under the influence of thenoise factors.SUGGESTED TOPICS OF DISCUSSIONS:1. BRAINSTORMINGThis is a necessary first step in anyapplication. The session should include individualswith first hand knowledge of the project. All mattersshould be decided based on group consensus, (Oneperson -- One vote).- Determine what you are after and how toevaluate it. When there is more than one criterion ofevaluation, decide how each criterion is to beweighted and combined for the overall evaluation.- Identify all influencing factors and thoseto be included in the study.- Determine the factor levels.- Determine the noise factor and thecondition of repetitions.2. DESIGNING EXPERIMENTSUsing the factors and levels determined inthe brainstorming session, the experiments now canbe designed and the method of carrying them outestablished. To design the experiment, implementthe following:- Select the appropriate orthogonal array.- Assign factor and interaction to columns.- Describe each trial condition.- Decide order and repetiting trials.3. RUNNING EXPERIMENTRun experiments in random order when possible.4. ANALYZING RESULTSBefore analysis, the raw experimental data mighthave to be combined into an overall evaluationcriterion. This is particularly true when there aremultiple criteria of evaluation. Analysis is performedto determine the following:- The optimum design.- Influence of individual factors.- Performance at the optimum condition &confidence interval (C. I.).1. OBJECTIVES AND EVALUATION CRITERIA- What are the criteria of evaluation?- How are each of these criteriameasured?- How are these criteria combined into asingle number?- What is the common characteristic ofthese criteria?- What is the relative influence thesecriteria exhibit?2. FACTORS- What are the factors that influence theperformance criteria?- Which factors are more important thanothers?3. NOISE FACTORS- Which factors can't be controlled inreal life?- Is the performance dependent on theapplication environment?4. FACTOR LEVELS- What are the ranges of values thefactors can assume within practicallimits?- How many levels of each factorshould be used for the study?- What is the tradeoff for a higher level?5. INTERACTION BETWEEN FACTORS- Which factors are most likely to interact?- How many interactions can be studied?6. SCOPES OF STUDIES- How many experiments can we run?- When do we need the results?- How much does each experiment cost?7. ADDITIONAL ITEMS- What do we do with factors that arenot included in the study?- In what order do we run theseexperiments?- Who will do these experiments?etc.Nutek, Inc. Bloomfield Hills, MI. USA. Tel: 1-248-540-4827 Support@Nutek-us.com www.Nutek-us.com 0607 Page 4
QUALITY CHARACTERISTICSFACTORS AND LEVELSQuality Characteristic (QC) generally refers to themeasured results of the experiment. The QC can besingle criterion such as pressure, temperature,efficiency, hardness, surface finish, etc. or acombination of several criteria together into a singleindex. QC also refers to the nature of theperformance objectives such as "bigger is better","smaller is better" or "nominal is the best".FACTORS ARE:- design parameters that influence theperformance.- input that can be controlled.- included in the study for the purpose ofdetermining their influence and controlupon the most desirable performance.In most industrial applications, QC consists ofmultiple criteria. For example, an experiment to studya casting process might involve evaluating castspecimens in terms of (a) hardness, (b) visualinspection of surface and (c) number of cavities. Toanalyze results, readings of evaluation under each ofthese three criteria for each test sample can be usedto determine the optimum. The optimum conditionsdetermined by using the results of each criterion mayor may not yield the same factor combination for theoptimum. Therefore, a weighted combination of theresults under different criteria into a single quantitymay be highly desirable. While combining the resultsof different criteria, they must first be normalized andthen made to be of type 'smaller is better' or 'biggeris better'.When quality characteristic (QC) consists of, say,three criteria, an overall evaluation criteria (OEC) canbe constructed as:OEC (X1/X1ref.)W1 (X2/X2ref.)W2 (X3/X3ref.)W3whereXXref evaluation under a criterion a reference (maximum) value ofreadingW weighting factor of the criterion (in %)Use of OEC as the result of an experimental sampleinstead of several readings from all criteria, offers anobjective method of determiningthe optimum condition based on overall performanceobjectives.When there are multiple criteria of evaluation, theexperimenter can analyze the experiments based onreadings under one category at a timeas well as by using the OEC. If the individualoutcomes differ from each other, the optimumobtained by using OEC as a result should bepreferred.Example: In a cake baking process the factorsare; Sugar, Flour, Butter, Egg, etc.LEVELS ARE:- Values that a factor assumes whenused in the experimentExample: As in the above cake baking processthe levels for sugar and flour could be:2 pounds, 5 pounds, etc. (Continuous level)type 1, type 2, etc. (Discrete level)LIMITS: Number of factors: 2 -63, number of levels:2, 3, and 4.INTERACTION BETWEEN FACTORSTwo factors (A and B) are considered to haveinteraction between them when one has influence onthe effect of the other factor respectively.Consider the factors "temperature" and "humidity"and their influence on comfort level. If thetemperature is increased by, say 20 degrees F, thecomfort level decreases by, say 30% when humidityis kept at 90%. On a different day, if the temperatureis raised the same amount at a humiditylevel of 70%, the comfort level is reported to droponly by 10%. In this case, the factors "temperature"and "humidity" are interacting witheach other.Interaction:-is an effect (output) and does not alterthe trial condition.can be determined even if no columnis reserved for it.can be fully analyzed by keepingappropriate columns empty.affects the optimum condition and theexpected result.Nutek, Inc. Bloomfield Hills, MI. USA. Tel: 1-248-540-4827 Support@Nutek-us.com www.Nutek-us.com 0607 Page 5
NOISE FACTORS AND OUTER ARRAYSNoise factors are those factors:- that are not controllable.- whose influences are not known.- which are intentionally not controlled.To determine robust design, experiments areconducted under theinfluence of various noise factors.An "Outer Array" is used to reduce the number ofnoise conditionsobtained by the combination of various noisefactors.For example:Three 2-level noise factors can be combinedusing an L-4 intofour noise conditions(4 repetitions). Likewiseseven 2-levelnoise factors can be combined into eightconditions(8 repetitions)using an L8 as an outer array.When trial conditions are repeated without theformal "Outer Array"design, the noise conditions are consideredrandom.SCOPE AND SIZE OF EXPERIMENTThe scope of the study, i.e., cost and time availability,are factors that help determine the size of theexperiment. The number of experimentsthat can be accomplished in a given period of time,and the associated costs are strictly dependent onthe type of project under study.The total number of samples available divided by thenumber of repetitions yields the size of the array fordesign. The array size dictates the numberof factors and their appropriate levels included in thestudy.Example: A number of factors are identified for anoptimization study.- Time available is two weeks during which only25 tests can be run.- Three repetitions for each trial condition isdesired.- Array size 25/3 -- 8 L-8 array.- Seven from the identified 2-level factors canbe studied.ORDER OF RUNNING EXPERIMENTSThere are two common ways of running experiments.Suppose an experiment uses an L-8 array and eachtrial is repeated 3 times. Howare the 3x8 24 experiments carried out?REPLICATION - The most desirable way is to runthese 24 in random order.REPETITION - The most practical way may be toselect the trial condition in random order thencomplete all repetitions in that trial.NOTE: In developing conclusions from the results ofdesigned experiments and assigning statisticalsignificance, it is assumed that theexperiments were unbiased in any way, thusrandomness is desired and should be maintainedwhen possible.MINIMUM REQUIREMENT - A minimum of oneexperiment per trial condition isrequired. Avoid running an experiment in an upwardor downward sequence of trial numbers.REPETITIONS AND REPLICATIONSREPETITION: Repeat a trial condition of theexperiment with/without a noise factor (outer array).Example: L-8 inner array and L-4 outer array. 8x4 32 samples. Select a trial condition randomly andcomplete all 4 samples.Take the next trial at random and continue.REPLICATION: Conduct all the trials and repetitionsin a completely randomized order.In the above example, select one sample at a time inrandom order from among the 24 (8x4).NOTE: Results from replication contain moreinformation than those from repetition. Sincereplication requires resetting thethe same trial condition, it captures variation inresults due to experimental set up.Nutek, Inc. Bloomfield Hills, MI. USA. Tel: 1-248-540-4827 Support@Nutek-us.com www.Nutek-us.com 0607 Page 6
AVAILABLE ORTHOGONAL ARRAYSThe following Standard Orthogonal Arrays arecommonly used to design experiments:2-Level Arrays: L-4 L-8 L-12 L-16 L-32 L-643-Level Arrays: L-9 L-18 L-27 (L-18 has one 2level column)4-Level Arrays: L-16 & L-32 ModifiedUPGRADING A COLUMNCOLUMN MODIFICATIONS:PREPARING A 4-LEVEL COLUMN - Select 3 2-levelcolumns that are naturally interacting. Pick two anddiscard the third.Use the two columns to generate a new column.Follow these rules to combine the new columns:TRIANGULAR TABLE/LINEAR GRAPHSTRIANGULAR TABLE OF INTERACTIONS(2-LEVEL COLUMNS)1 2 3 4 5(1) 3 2 5 4(2) 1 6 7(3) 7 6(4) 1(5)6 7 8 9 10 11 12 13 14 157 6 9 8 11 10 13 12 15 144 5 10 11 8 9 14 15 12 135 4 11 10 9 8 15 14 13 122 3 12 13 14 15 8 9 10 113 2 13 12 15 14 9 8 11 10(6) 1 14 15 12 13 10 11 8 9(7) 15 14 13 12 11 10 9 8(8) 1 2 3 4 5 6 7(9) 3 2 5 4 7 6(10) 1 6 7 4 5(11) 7 6 5 4(12) 1 2 3(13) 3 2(14) 1(15)(Interaction tables for 3-level and 4-level factors arenot shown here)LINEAR GRAPHS - Linear graphs are graphicalrepresentations of certain readings of the Triangulartable for convenience of experiment designs.The graphs consist of combination of a line withcircles/balls at the ends. The end points representthe columns where the interacting factorsare assigned and the number associated with theline indicate the column number for the interaction.Old ColumnsNew Column1 1------- 11 2------- 22 1------- 32 2------- 4Example: Suppose factor A is a 4-level factor. Usingcolumns 1 2 3 of an L-16, a new 4-level column canbe prepared and factor A assigned.PREPARING AN 8-LEVEL COLUMN - An 8-levelcolumn can be prepared from three of the seveninteracting columns of an L-16. (Use columns 1 2 &4, discard 3 5 6 & 7.)Follow these rules:Old ColumnsNew Column111122221122112212121212------- ------- ------- ------- ------- ------- ------- ------- 12345678Note: An eight level factor/column is not supportedby QUALITEK-4 software. The above information isfor user reference only.Example: For L-4 Orthogonal array, 1 x 2 3,which will be shown in graph form as31 o-------------------------o 2Complicated Linear Graphs for higher order arraysare not shown here.Nutek, Inc. Bloomfield Hills, MI. USA. Tel: 1-248-540-4827 Support@Nutek-us.com www.Nutek-us.com 0607 Page 7
DUMMY TREATMENTThis method allows a 3-level column to be made intoa 2 -level column or a 4-level column into a 3-levelcolumn (e.g. levels 1 2 3 to 1 2 1').The notation 1' is used to keep track of the changedstatus only. For level assignment 1' 1. The selectionof the level to be treated is arbitrary.Example: Three 3-level factors and one 2-levelfactor.- Use an L-9. Dummy treat any column and assignthe 2-level factor.RESULTS OF MULTIPLE CRITERIAFrequently, your experiment may involve evaluatingresults in terms of more than one criteria ofevaluations. For example, in a cake bakingexperiment, the cakes baked under different recipes(trial conditions) may be evaluated by taste, looksand moistness. These criteria maybe subjective and objective in nature. The bestrecipes can be determined by analyzing results ofeach criterion separately. The recipes foroptimum conditions determined this way may or maynot be the same. Thus, it may be desirable tocombine the evaluations under different criteriainto one single overall criteria and use them foranalysis.To combine readings under different evaluationcriteria, they must first be normalized (unitless), thencombined with proper weighting. Furthermore,all evaluations must be of the same qualitycharacteristic, i.e., either bigger or smaller is a bettertype. When an evaluation is of the oppositeit can be subtracted from a larger constant toconform to the desired characteristic [(X2ref. - X2)instead of X2].http://nutek-us.com/wp-txt.htmlFor the purpose of combining all evaluations into asingle criterion,Assume:X1 Numeric evaluation under criterion 1X1ref Highest numerical value X1 canassumeWt1 Relative weighting of criterion 1Then an Overall Evaluation Criterion (OEC) can bedefined as:OEC (X1/X1ref)xWt1 (X2/X2ref)xWt2 .Nutek, Inc. Bloomfield Hills, MI. USA. Tel: 1-248-540-4827 Support@Nutek-us.com www.Nutek-us.com 0607 Page 8
SIGNAL TO NOISE RATIOS (S/N) FOR STATICAND DYNAMIC SYSTEMSDYNAMIC CHARACTERISTIC(Conduct of experiments and analysis of results)MSD AND S/N RATIOSReference text: Taguchi Methods by Glen S. Peace,Addison Wesley Publishing Company, Inc. NY, 1992(Pages 338-363)NOTES AND RECOMMENDATION ON USE OF S/NRATIOS (Static condition)Recommendation: If you are not looking for a specificobjective, then SELECT S/N ratio based on MeanSquared Deviation (MSD).MSD expression combines variation around the giventarget and is consistent with Taguchi's qualityobjective.S/N based on variance is independent of target valueand points to variation around the target.S/N based on variance and mean combines the twoeffects with target at 0. The purpose is to increasethis ratio ((Vm-Ve)/(nxVe)) and thusa sign is used in front of Log() for S/N. Also, sincefor an arbitrary target value, (Vm-Ve) may benegative, target 0 is used for calculation ofVm. Expressions for all types of S/N ratios areshown on the next screen.RELATIONSHIPS AMONG OBSERVED RESULTS,MSD AND S/N RATIOS(Static condition)MSD ( (Y1-Y0) 2 (Y2-Y0) 2 . (Yn-Y0) 2 )/nfor NOMINAL IS BESTVariance: Ve (SSt - SSm)/(n-1) . forNOMINAL IS BESTVariance and Mean (SSm - Ve)/(n*Ve)(withTARGET 0)where SSt Y1 2 Y2 2 and SSm (Y1 Y2 .) 2/nMSD ( Y1 2 Y2 2 . Yn 2 )/n forSMALLER IS BETTERMSD ( 1/Y1 2 1/Y2 2 . 1/Yn 2 )/n forBIGGER IS BETTERWHAT IS DYNAMIC CHARACTERISTIC?A system is considered to exhibit dynamiccharacteristics when the strengthof a particular factor has a direct effect on theresponse. Such afactor with a direct influence on the result iscalled a SIGNAL factor.SIGNAL FACTOR- is an input to the system. Itsvalue/level may change.CONTROL FACTOR - is also an input to thesystem. Values/level is fixed at the optimum level forthe best performance.NOISE FACTOR - is an uncontrollable factor. Itslevel is random during actual performance.STATIC SYSTEM GOAL - is to determinecombination of control factor levels which producesthe best performance when exposed tothe influence of the varying levels of noise factors.DYNAMIC SYSTEM GOAL - is to find thecombination of control factor levels which producesdifferent levels of performances indirect proportion to the signal factor, but producesminimum variation due to the noise factors at eachlevel of the signal.Example: Fabric dyeing processControl factor: Types of dyes,Temperature, PH number, etc.Signal factor:Quantity of dyeNoise factor:Amount of starchS/N - 10 x Log(MSD). for allcharacteristicsS/N 10 x Log(Ve or Ve and Mean) . forNOMINAL IS BEST only.Note: Symbol ( 2) indicates the value is SQUARED.Nutek, Inc. Bloomfield Hills, MI. USA. Tel: 1-248-540-4827 Support@Nutek-us.com www.Nutek-us.com 0607 Page 9
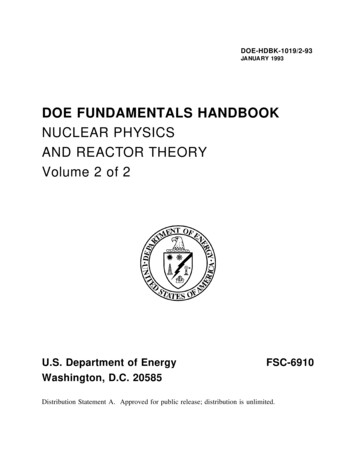
CONDUCTING EXPERIMENTS WITH DYNAMICCHARACTERISTICSWhen carrying out experiments, proper order andsequence of samples tested under each trialcondition must be maintained. The numberof samples required for each trial condition, willdepend on the number of levels of signal factor,noise conditions and repetitions for each cell (a fixedcondition of noise and signal factor).Depending on the circumstances of the input signalvalues and the resulting response data, differentsignal-to-noise (S/N) ratio equations are available.ZERO POINT PROPORTIONAL - Select thisresponse type of equation when response linepasses through the origin. The signal may be known,unknown or vague.Step 1. Design experiment with control factors byselecting your design type (manual or automaticdesign) from the main screen menu.Step 2. Print description of trial conditions byselecting the PRINT option.Step 3. Enter in your descriptions and experimentnotes on the DYNAMIC CHARACTERISTICS screen.REFERENCE POINT PROPORTIONAL - Thisresponse type of equation should be the choice whenthe response line does not go through the origin butthrough a known value of the signal or when signalvalues are wide apart or far away from origin. Whenthe signal values are known, zero point or referencepoint proportional should be considered first. Ifneither is appropriate, the linear equation should beused.* You will need to describe signal and noise factorsand their levels. You will also have to decide on thenumber of levels of signal and noise factors. BUTMOST IMPORTANTLY, you will have to choose thenature of the ideal function (Straight line representingthe behavior Response vs. Signal) applicable to yoursystem.LINEAR EQUATION - is based on the equationrepresnting the least squares of response fit andshould be used where neither zero and referencepoint proportional equation are appropriate. Use itwhen signal values are close together and responsedoes not pass through the origin.Step 4. Strictly follow the prescribed test conditions.Step 5. Enter results in the order and locations (run#)prescribed using the RESULTS option from the mainmenu.SIGNAL-TO-NOISE RATIO EQUATIONS (alternatedynamic characteristic equations)Signal factor may not always be clearly defined orknown. For common industrial experiments, one ormore attributes may be applicable:* TRUE VALUE KNOWN* INTERVAL BETWEEN FACTOR LEVELSKNOWN* FACTOR LEVEL RATIOS KNOWN* FACTOR LEVEL VALUES VAGUEWHEN IN DOUBT plot the response as a function ofthe signal factor values on a linear graph andexamine the y-intercept. If it passes through origin,use ZERO POINT. If the intercept is not throughorigin but the line passes through a fixed point, useREF. POINT. In all other situation use LINEAREQUATION.S/N Ratio Equation and Calculation Stepsy m Beta (M - Mavg) eLinearEqn. (L)y Beta MZero Point (Z)y Beta (M - Mstd.) ystdRef. Point(R)Where y system response (QC),M SignalfactorBeta slope of the ideal Eqn. Mavg Average of signalsystd. avg. response underreference/standard signalMstd reference/standard value of thesignal strengthNotations* multiplication, raised to the power/ division byResponse Components for Each Trial Condition(Layout shown only for trial#1 below)Nutek, Inc. Bloomfield Hills, MI. USA. Tel: 1-248-540-4827 Support@Nutek-us.com www.Nutek-us.com 0607 Page 10
SIGNAL FACTORSignal lev 1Signal lev 2Step 5: Calculate Error VarianceSignal lev 3N1 N2 N1 N2 N1 N2Trl#1 y11, y12, y13, y14. y21, y22, y23, y24. y31,y32, y33, y34.Step 1: Determine r (Start with trial# 1)ro Number of samples tested under each SIGNALLEVEL (Number of NOISE LEVELSxSAMPLES per CELL)M1, M2, M3,. Mk. Signal levels (strengths)N1 & N2 are two levels of the noise factork number of signal levelsMavg (M1 M2 . Mk)/kr ro [ (M1-Mavg) 2 (M2-Mavg) 2 . (MkMavg) 2] . (L)r ro [ (M1-Mstd) 2 (M2-M
Design of Experiments Using the Taguchi Approach : 16 Steps to Product and Process . The book is available directly from the publisher, Society of Manufacturing Engineers (SME ) P.O. Box 6028, Dearborn, Michigan 48121, USA.256 Pages. 50 Illustrations. Order code: 2436-2487. . real life