Transcription
Rushing, Heath; Karl, Andrew; Wisnowski, James. Design and Analysis of Experiments by Douglas Montgomery: A Supplement forUsing JMP(R). Copyright 2013, SAS Institute Inc., Cary, North Carolina, USA. ALL RIGHTS RESERVED. For additional SASresources, visit support.sas.com/bookstore.
ContentsAbout This Book . ixAbout These Authors . xiiiAcknowledgments . xvChapter 1 Introduction . 1Chapter 2 Simple Comparative Experiments . 5Section 2.2 Basic Statistical Concepts. 6Section 2.4.1 Hypothesis Testing . 10Section 2.4.3 Choice of Sample Size . 12Section 2.5.1 The Paired Comparison Problem . 17Section 2.5.2 Advantages of the Paired Comparison Design . 18Chapter 3 Experiments with a Single Factor: The Analysis of Variance . 21Section 3.1 A One-way ANOVA Example . 22Section 3.4 Model Adequacy Checking . 32Section 3.8.1 Single Factor Experiment . 46Section 3.8.2 Application of a Designed Experiment . 52Section 3.8.3 Discovering Dispersion Effects . 54Chapter 4 Randomized Blocks, Latin Squares, and Related Designs . 61Section 4.2 Creating a Latin Square Design in JMP . 67Chapter 5 Introduction to Factorial Designs . 77Example 5.1 The Battery Design Experiment . 78Example 5.2 A Two-Factor Experiment with a Single Replicate. 82Example 5.3 The Soft Drink Bottling Problem . 84Example 5.4 The Battery Design Experiment with a Covariate . 86Example 5.5 A 32 Factorial Experiment with Two Replicates. 89Example 5.6 A Factorial Design with Blocking . 97Rushing, Heath; Karl, Andrew; Wisnowski, James. Design and Analysis of Experiments by Douglas Montgomery: A Supplement forUsing JMP(R). Copyright 2013, SAS Institute Inc., Cary, North Carolina, USA. ALL RIGHTS RESERVED. For additional SASresources, visit support.sas.com/bookstore.
viContentsChapter 6 The 2k Factorial Design . 101Section 6.2 The 22 design . 102Example 6.1 A 23 Design . 107Example 6.2 A Single Replicate of the 24 Design . 109Example 6.3 Data Transformation in a Factorial Design . 114Example 6.5 Duplicate Measurements on the Response . 118Example 6.6 Credit Card Marketing . 125Example 6.7 A 24 Design with Center Points . 128Chapter 7 Blocking and Confounding in the 2k Factorial Design . 131Example 7.1 A 2k Replicated Factorial Design with Blocking . 132Example 7.2 Blocking and Confounding in an Unreplicated Design . 132Example 7.3 A 23 Design with Partial Confounding . 134Chapter 8 Two-Level Fractional Factorial Designs . 141Example 8.1 A Half-Fraction of the 24 Design . 143Example 8.2 A 25-1 Design Used for Process Improvement . 147Example 8.3 A 24-1 Design with the Alternate Fraction . 152Example 8.4 A 26-2 Design . 153Example 8.5 A 27-3 Design . 158Example 8.6 A 28-3 Design in Four Blocks . 160Example 8.7 A Fold-Over 27-4 Resolution III Design . 164Example 8.8 The Plackett-Burman Design . 167Section 8.7.2 Sequential Experimentation with Resolution IV Designs . 168Chapter 9 Three-Level and Mixed-Level Factorial and Fractional FactorialDesigns . 173Example 9.1 The 33 Design . 174Example 9.2 The 32 Design Confounded in 3 Blocks . 177Example 9.3 The Spin Coating Experiment . 178Example 9.4 An Experiment with Unusual Blocking Requirements . 181Chapter 10 Fitting Regression Models . 189Example 10.1 Multiple Linear Regression Model . 190Example 10.2 Regression Analysis of a 23 Factorial Design . 195Example 10.3 A 23 Factorial Design with a Missing Observation . 197Example 10.4 Inaccurate Levels in Design Factors . 198Rushing, Heath; Karl, Andrew; Wisnowski, James. Design and Analysis of Experiments by Douglas Montgomery: A Supplement forUsing JMP(R). Copyright 2013, SAS Institute Inc., Cary, North Carolina, USA. ALL RIGHTS RESERVED. For additional SASresources, visit support.sas.com/bookstore.
Contents viiExample 10.6 Tests on Individual Regression Coefficients . 198Example 10.7 Confidence Intervals on Individual Regression Coefficients . 199Chapter 11 Response Surface Methods and Designs . 201Example 11.1 The Path of Steepest Ascent . 202Example 11.2 Central Composite Design . 204Section 11.3.4 Multiple Responses . 209Example 11.4 Space Filling Design with Gaussian Process Model . 214Example 11.5 A Three-Component Mixture . 218Example 11.6 Paint Formulation . 222Chapter 12 Robust Parameter Design and Process Robustness Studies 227Example 12.1 Two Controllable Variables and One Noise Variable . 228Example 12.2 Two Controllable Variables and Three Noise Variables . 230Chapter 13 Experiments with Random Factors . 239Example 13.1 A Measurement Systems Capability Study . 240Example 13.3 The Unrestricted Model . 242Example 13.5 A Three-Factor Factorial Experiment with Random Factors . 244Example 13.6 Approximate F Tests . 245Chapter 14 Nested and Split-Plot Designs . 251Example 14.1 The Two-Stage Nested Design. 252Example 14.2 A Nested-Factorial Design . 254Section 14.4 The Experiment on the Tensile Strength of Paper . 256Example 14.3 A 25-1 Split-Plot Experiment. 259Chapter 15 Other Design and Analysis Topics . 263Example 15.1 Box-Cox Transformation. 264Example 15.2 The Generalized Linear Model and Logistic Regression . 265Example 15.3 Poisson Regression . 267Example 15.4 The Worsted Yarn Experiment . 269Section 15.2 Unbalanced Data in a Factorial Design . 270Example 15.5 Analysis of Covariance . 271Section 15.3.4 Factorial Experiments with Covariates . 273Index . 277Rushing, Heath; Karl, Andrew; Wisnowski, James. Design and Analysis of Experiments by Douglas Montgomery: A Supplement forUsing JMP(R). Copyright 2013, SAS Institute Inc., Cary, North Carolina, USA. ALL RIGHTS RESERVED. For additional SASresources, visit support.sas.com/bookstore.
viii ContentsRushing, Heath; Karl, Andrew; Wisnowski, James. Design and Analysis of Experiments by Douglas Montgomery: A Supplement forUsing JMP(R). Copyright 2013, SAS Institute Inc., Cary, North Carolina, USA. ALL RIGHTS RESERVED. For additional SASresources, visit support.sas.com/bookstore.
IntroductionThe analysis of a complex process requires the identification of target quality attributesthat characterize the output of the process and of factors that may be related to thoseattributes. Once a list of potential factors is identified from subject‐matter expertise, thestrengths of the associations between those factors and the target attributes need to bequantified. A naïve, one‐factor‐at‐a‐time analysis would require many more trials thannecessary. Additionally, it would not yield information about whether the relationshipbetween a factor and the target depends on the values of other factors (commonlyreferred to as interaction effects between factors). As demonstrated in DouglasMontgomery’s Design and Analysis of Experiments textbook, principles of statistical theory,linear algebra, and analysis guide the development of efficient experimental designs forfactor settings. Once a subset of important factors has been isolated, subsequentexperimentation can determine the settings of those factors that will optimize the targetquality attributes. Fortunately, modern software has taken advantage of the advancedtheory. This software now facilitates the development of good design and makes solidanalysis more accessible to those with a minimal statistical background.Designing experiments with specialized design of experiments (DOE) software is moreefficient, complete, insightful, and less error‐prone than producing the same design byhand with tables. In addition, it provides the ability to generate algorithmic designs(according to one of several possible optimality criteria) that are frequently required toaccommodate constraints commonly encountered in practice. Once an experiment hasbeen designed and executed, the analysis of the results should respect the assumptionsmade during the design process. For example, split‐plot experiments with hard‐to‐change factors should be analyzed as such; the constraints of a mixture design must beincorporated; non‐normal responses should either be transformed or modeled with ageneralized linear model; correlation between repeated observations on an experimentalunit may be modeled with random effects; non‐constant variance in the response variableRushing, Heath; Karl, Andrew; Wisnowski, James. Design and Analysis of Experiments by Douglas Montgomery: A Supplement forUsing JMP(R). Copyright 2013, SAS Institute Inc., Cary, North Carolina, USA. ALL RIGHTS RESERVED. For additional SASresources, visit support.sas.com/bookstore.
2 Design and Analysis of Experiments by Douglas Montgomery: A Supplement for Using JMPacross the design factors may be modeled, etc. Software for analyzing designedexperiments should provide all of these capabilities in an accessible interface.JMP offers an outstanding software solution for both designing and analyzingexperiments. In terms of design, all of the classic designs that are presented in thetextbook may be created in JMP. Optimal designs are available from the JMP CustomDesign platform. These designs are extremely useful for cases where a constraineddesign space or a restriction on the number of experimental runs eliminates classicaldesigns from consideration. Multiple designs may be created and compared withmethods described in the textbook, including the Fraction of Design Space plot. Once adesign is chosen, JMP will randomize the run order and produce a data table, which theresearcher may use to store results. Metadata for the experimental factors and responsevariables is attached to the data table, which simplifies the analysis of these results.The impressive graphical analysis functionality of JMP accelerates the discovery processparticularly well with the dynamic and interactive profilers and plots. If labels for plottedpoints overlap, can by clicking and dragging the labels. Selecting points in a plotproduced from a table selects the appropriate rows in the table and highlights the pointscorresponding to those rows in all other graphs produced from the table. Plots can beshifted and rescaled by clicking and dragging the axes. In many other software packages,these changes are either unavailable or require regenerating the graphical output.An additional benefit of JMP is the ease with which it permits users to manipulate datatables. Data table operations such as sub‐setting, joining, and concatenating are availablevia intuitive graphical interfaces. The relatively short learning curve for data tablemanipulation enables new users to prepare their data without remembering an extensivesyntax. Although no command‐line knowledge is necessary, the underlying JMPscripting language (JSL) scripts for data manipulation (and any other JMP procedure)may be saved and edited to repeat the analysis in the future or to combine with otherscripts to automate a process.This supplement to Design and Analysis of Experiments follows the chapter topics of thetextbook and provides complete instructions and useful screenshots to use JMP to solveevery example problem. As might be expected, there are often multiple ways to performthe same operation within JMP. In many of these cases, the different possibilities areillustrated across different examples involving the relevant operation. Some theoreticalresults are discussed in this supplement, but the emphasis is on the practical applicationof the methods developed in the textbook. The JMP DOE functionality detailed hererepresents a fraction of the software’s features for not only DOE, but also for most otherRushing, Heath; Karl, Andrew; Wisnowski, James. Design and Analysis of Experiments by Douglas Montgomery: A Supplement forUsing JMP(R). Copyright 2013, SAS Institute Inc., Cary, North Carolina, USA. ALL RIGHTS RESERVED. For additional SASresources, visit support.sas.com/bookstore.
Chapter 1 Introduction 3areas of applied statistics. The platforms for reliability and survival, quality and processcontrol, time series, multivariate methods, and nonlinear analysis procedures are beyondthe scope of this supplement.Rushing, Heath; Karl, Andrew; Wisnowski, James. Design and Analysis of Experiments by Douglas Montgomery: A Supplement forUsing JMP(R). Copyright 2013, SAS Institute Inc., Cary, North Carolina, USA. ALL RIGHTS RESERVED. For additional SASresources, visit support.sas.com/bookstore.
4 Design and Analysis of Experiments by Douglas Montgomery: A Supplement for Using JMPRushing, Heath; Karl, Andrew; Wisnowski, James. Design and Analysis of Experiments by Douglas Montgomery: A Supplement forUsing JMP(R). Copyright 2013, SAS Institute Inc., Cary, North Carolina, USA. ALL RIGHTS RESERVED. For additional SASresources, visit support.sas.com/bookstore.
Simple Comparative ExperimentsSection 2.2 Basic Statistical Concepts . 6Section 2.4.1 Hypothesis Testing . 10Section 2.4.3 Choice of Sample Size . 12Section 2.5.1 The Paired Comparison Problem . 17Section 2.5.2 Advantages of the Paired Comparison Design . 18The problem of testing the effect of a single experimental factor with only two levelsprovides a useful introduction to the statistical techniques that will later be generalizedfor the analysis of more complex experimental designs. In this chapter, we developtechniques that will allow us to determine the level of statistical significance associatedwith the difference in the mean responses of two treatment levels. Rather than onlyconsidering the difference between the mean responses across the treatments, we alsoconsider the variation in the responses and the number of runs performed in theexperiment. Using a t‐test, we are able to quantify the likelihood (expressed as a p‐value)that the observed treatment effect is merely noise. A “small” p‐value (typically taken tobe one smaller than α 0.05) suggests that the observed data are not likely to haveoccurred if the null hypothesis (of no treatment effect) were true.A related question involves the likelihood that the null hypothesis is rejected given thatit is false (the power of the test). Given a fixed significance level, α (our definition ofwhat constitutes a “small” p‐value), theorized values for the pooled standard deviation,and a minimum threshold difference in treatment means, it is possible to solve for theminimum sample size that is necessary to achieve a desired power. This procedure isuseful for determining the number of runs that must be included in a designedexperiment.Rushing, Heath; Karl, Andrew; Wisnowski, James. Design and Analysis of Experiments by Douglas Montgomery: A Supplement forUsing JMP(R). Copyright 2013, SAS Institute Inc., Cary, North Carolina, USA. ALL RIGHTS RESERVED. For additional SASresources, visit support.sas.com/bookstore.
6 Design and Analysis of Experiments by Douglas Montgomery: A Supplement for Using JMPIn the first example presented in this chapter, a scientist has developed a modifiedcement mortar formulation that has a shorter cure time than the unmodifiedformulation. The scientist would like to test if the modification has affected the bondstrength of the mortar. To study whether the two formulations, on average, producebonds of different strengths, a two‐sided t‐test is used to analyze the observations from arandomized experiment with 10 measurements from each formulation. The nullhypothesis of this test is that the mean bond strengths produced by the two formulationsare equal; the alternative hypothesis is that mean bond strengths are not equal.We also consider the advantages of a paired t‐test, which provides an introduction to thenotion of blocking. This test is demonstrated using data from an experiment to test forsimilar performance of two different tips that are placed on a rod in a machine andpressed into metal test coupons. A fixed pressure is applied to the tip, and the depth ofthe resulting depression is measured. A completely randomized design would apply thetips in a random order to the test coupons (making only one measurement on eachcoupon). While this design would produce valid results, the power of the test could beincreased by removing noise from the coupon‐to‐coupon variation. This may beachieved by applying both tips to each coupon (in a random order) and measuring thedifference in the depth of the depressions. A one‐sample t‐test is then used for the nullhypothesis that the mean difference across the coupons is equal to 0. This procedurereduces experimental error by eliminating a noise factor.This chapter also includes an example of procedures for testing the equality of treatmentvariances, and a demonstration of the t‐test in the presence of potentially unequal groupvariances. This final test is still valid when the group variances are equal, but it is not aspowerful as the pooled t‐test in such situations.Section 2.2 Basic Statistical Concepts1.Open Tension-Bond.jmp.2.Select Analyze Distribution.3.Select Strength for Y, Columns.4.Select Mortar for By. As we will see in later chapters, these fields will beautomatically populated for data tables that were created in JMP.Rushing, Heath; Karl, Andrew; Wisnowski, James. Design and Analysis of Experiments by Douglas Montgomery: A Supplement forUsing JMP(R). Copyright 2013, SAS Institute Inc., Cary, North Carolina, USA. ALL RIGHTS RESERVED. For additional SASresources, visit support.sas.com/bookstore.
Chapter 2 Simple Comparative Experiments 75.Click OK.6.Click the red triangle next to Distributions Mortar Modified and select UniformScaling.7.Repeat step 6 for Distributions Mortar Unmodified.8.Click the red triangle next to Distributions Mortar Modified and select Stack.9.Repeat step 8 for Distributions Mortar Unmodified.10. Hold down the Ctrl key and click the red triangle next to Strength. SelectHistogram Options Show Counts. Holding down Ctrl applies the commandto all of the histograms created by the Distribution platform; it essentially“broadcasts” the command.Rushing, Heath; Karl, Andrew; Wisnowski, James. Design and Analysis of Experiments by Douglas Montgomery: A Supplement forUsing JMP(R). Copyright 2013, SAS Institute Inc., Cary, North Carolina, USA. ALL RIGHTS RESERVED. For additional SASresources, visit support.sas.com/bookstore.
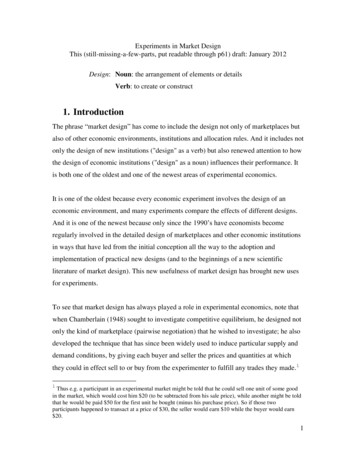
8 Design and Analysis of Experiments by Douglas Montgomery: A Supplement for Using JMPIt appears from the overlapped histograms that the unmodified mortar tends to producestronger bonds than the modified mortar. The unmodified mortar has a mean strength of17.04 kgf/cm2 with a standard deviation of 0.25 kgf/cm2. The modified mortar has a meanstrength of 16.76 kgf/cm2 with a standard deviation of 0.32 kgf/cm2. A naïve comparisonof mean strength indicates that the unmodified mortar outperforms the modified mortar.However, the difference in means could simply be a result of sampling fluctuation.Using statistical theory, our goal is to incorporate the sample standard deviations (andsample sizes) to quantify how likely it is that the difference in mean strengths is due onlyto sampling error. If it turns out to be unlikely, we will conclude that a true differenceexists between the mortar strengths.11. Select Analyze Fit Y by X.12. Select Strength for Y, Response and Mortar for X, Grouping.Rushing, Heath; Karl, Andrew; Wisnowski, James. Design and Analysis of Experiments by Douglas Montgomery: A Supplement forUsing JMP(R). Copyright 2013, SAS Institute Inc., Cary, North Carolina, USA. ALL RIGHTS RESERVED. For additional SASresources, visit support.sas.com/bookstore.
Chapter 2 Simple Comparative Experiments 9The Fit Y by X platform recognizes this as a one‐way ANOVA since the response,Strength, is a continuous factor, and the factor Mortar is a nominal factor. When JMP isused to create experimental designs, it assigns the appropriate variable type to eachcolumn. For imported data, JMP assigns a modeling type—continuous, ordinal,or nominal—to each variable based on attributes of that variable. A differentmodeling type may be specified by right‐clicking the modeling type icon next to acolumn name and selecting the new type.13. Click OK.14. To create box plots, click the red triangle next to One‐way Analysis of Strengthby Mortar and select Quantiles.Rushing, Heath; Karl, Andrew; Wisnowski, James. Design and Analysis of Experiments by Douglas Montgomery: A Supplement forUsing JMP(R). Copyright 2013, SAS Institute Inc., Cary, North Carolina, USA. ALL RIGHTS RESERVED. For additional SASresources, visit support.sas.com/bookstore.
10 Design and Analysis of Experiments by Douglas Montgomery: A Supplement for Using JMPThe median modified mortar strength (represented by the line in the middle of the box)is lower than the median unmodified mortar strength. The similar length of the twoboxes (representing the interquartile ranges) indicates that the two mortar formulationsresult in approximately the same variability in strength.15. Keep the Fit Y by X platform open for the next exercise.Section 2.4.1 Hypothesis Testing1.Return to the Fit Y by X platform from the previous exercise.2.Click the red triangle next to One‐way Analysis of Strength by Mortar and selectMeans/Anova/Pooled t.Rushing, Heath; Karl, Andrew; Wisnowski, James. Design and Analysis of Experiments by Douglas Montgomery: A Supplement forUsing JMP(R). Copyright 2013, SAS Institute Inc., Cary, North Carolina, USA. ALL RIGHTS RESERVED. For additional SASresources, visit support.sas.com/bookstore.
Chapter 2 Simple Comparative Experiments 11The t‐test report shows the two‐sample t‐test assuming equal variances. Since we have atwo‐sided alternative hypothesis, we are concerned with the p‐value labeled Prob t 0.0422. Since we have set α 0.05, we reject the null hypothesis that the mean strengthsproduced by the two formulations of mortar are equal and conclude that the meanstrength of the modified mortar and the mean strength of the unmodified mortar are(statistically) significantly different. In practice, our next step would be to decide from asubject‐matter perspective if the difference is practically significant.Before accepting the conclusion of the t test, we should use diagnostics to check thevalidity of assumptions made by the model. Although this step is not shown for everyexample in the text, it is an essential part of every analysis. For example, a quantile plotmay be used to check the assumptions of normality and identical population variances.Though not shown here, a plot of the residuals against run order could help identifypotential violations of the assumed independence across runs (the most important of thethree assumptions).3.Click the red triangle next to One‐way Analysis of Strength by Mortar and selectNormal Quantile Plot Plot Quantile by Actual.The points fall reasonably close to straight lines in the plot, suggesting that theassumption of normality is reasonable. The slopes of the lines are proportional to thestandard deviations in each comparison group. These slopes appear to be similar,supporting the decision to assume equal population variances.Rushing, Heath; Karl, Andrew; Wisnowski, James. Design and Analysis of Experiments by Douglas Montgomery: A Supplement forUsing JMP(R). Copyright 2013, SAS Institute Inc., Cary, North Carolina, USA. ALL RIGHTS RESERVED. For additional SASresources, visit support.sas.com/bookstore.
12 Design and Analysis of Experiments by Douglas Montgomery: A Supplement for Using JMP4.Select Window Close All.Section 2.4.3 Choice of Sample Size1.To determine the necessary sample size for a proposed experiment, select DOE Sample Size and Power.2.Click Two Sample Means.3.Enter 0.25 for Std Dev, 0.5 for Difference to detect, and 0.95 in Power. Noticethat the Difference to detect requested here is the actual difference betweengroup means, not the scaled difference, δ, described in the textbook.Rushing, Heath; Karl, Andrew; Wisnowski, James. Design and Analysis of Experiments by Douglas Montgomery: A Supplement forUsing JMP(R). Copyright 2013, SAS Institute Inc., Cary, North Carolina, USA. ALL RIGHTS RESERVED. For additional SASresources, visit support.sas.com/bookstore.
Chapter 2 Simple Comparative Experiments 134.Click Continue. A value of 16 then appears in Sample Size. Thus, we shouldallocate 8 observations to each treatment (n1 n2 8).5.Suppose we use a sample size of n1 n2 10. What is the power for detectingdifference of 0.25 kgf/cm2? Delete the value 0.95 from the Power field, changeDifference to detect to 0.25, and set Sample Size to 20.6.Click Continue.Rushing, Heath; Karl, Andrew; Wisnowski, James. Design and Ana
2 Design and Analysis of Experiments by Douglas Montgomery: A Supplement for Using JMP across the design factors may be modeled, etc. Software for analyzing designed experiments should prov