Transcription
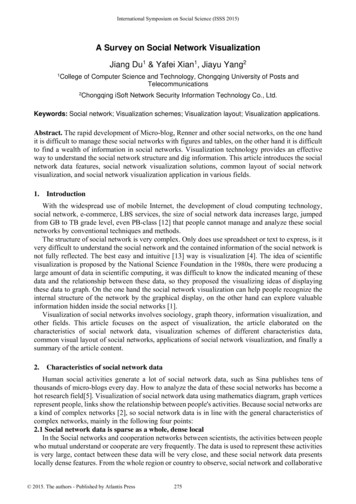
International Symposium on Social Science (ISSS 2015)A Survey on Social Network VisualizationJiang Du1 & Yafei Xian1, Jiayu Yang21Collegeof Computer Science and Technology, Chongqing University of Posts andTelecommunications2ChongqingiSoft Network Security Information Technology Co., Ltd.Keywords: Social network; Visualization schemes; Visualization layout; Visualization applications.Abstract. The rapid development of Micro-blog, Renner and other social networks, on the one handit is difficult to manage these social networks with figures and tables, on the other hand it is difficultto find a wealth of information in social networks. Visualization technology provides an effectiveway to understand the social network structure and dig information. This article introduces the socialnetwork data features, social network visualization solutions, common layout of social networkvisualization, and social network visualization application in various fields.1.IntroductionWith the widespread use of mobile Internet, the development of cloud computing technology,social network, e-commerce, LBS services, the size of social network data increases large, jumpedfrom GB to TB grade level, even PB-class [12] that people cannot manage and analyze these socialnetworks by conventional techniques and methods.The structure of social network is very complex. Only does use spreadsheet or text to express, is itvery difficult to understand the social network and the contained information of the social network isnot fully reflected. The best easy and intuitive [13] way is visualization [4]. The idea of scientificvisualization is proposed by the National Science Foundation in the 1980s, there were producing alarge amount of data in scientific computing, it was difficult to know the indicated meaning of thesedata and the relationship between these data, so they proposed the visualizing ideas of displayingthese data to graph. On the one hand the social network visualization can help people recognize theinternal structure of the network by the graphical display, on the other hand can explore valuableinformation hidden inside the social networks [1].Visualization of social networks involves sociology, graph theory, information visualization, andother fields. This article focuses on the aspect of visualization, the article elaborated on thecharacteristics of social network data, visualization schemes of different characteristics data,common visual layout of social networks, applications of social network visualization, and finally asummary of the article content.2.Characteristics of social network dataHuman social activities generate a lot of social network data, such as Sina publishes tens ofthousands of micro-blogs every day. How to analyze the data of these social networks has become ahot research field[5]. Visualization of social network data using mathematics diagram, graph verticesrepresent people, links show the relationship between people's activities. Because social networks area kind of complex networks [2], so social network data is in line with the general characteristics ofcomplex networks, mainly in the following four points:2.1 Social network data is sparse as a whole, dense localIn the Social networks and cooperation networks between scientists, the activities between peoplewho mutual understand or cooperate are very frequently. The data is used to represent these activitiesis very large, contact between these data will be very close, and these social network data presentslocally dense features. From the whole region or country to observe, social network and collaborative 2015. The authors - Published by Atlantis Press275
network of scientists is less contact between the various regions, social network data as a wholeexperience the feature of sparse.2.2 Social network data have time characteristicSocial network activity is often occured with a time, this time records the whole process ofactivities, studying of social networks often start from this time. For example, when analyzing themicro-blog public opinion, when, who issued, the number of people forwarding, each time of theseactions. Then analyzing the information in chronological order, we can have a certain understandingof the propagation of public opinion.2.3 Social network data have hierarchical attributeThe social network of social structure and family relationships have grade level. A hierarchycontains the following sub-level, as well as the second son of the following sub-level hierarchy. Forexample, a company's organizational structure, generally divided into chariman, middle manager, thegeneral staff of the three levels, these social networks have a property of hierarchical structure.2.4 Social network data have network attributeThe main participants of the Internet network, social networks, collaboration networks, diseasetransmission networks is human, exchanging activities between people staggered overlap. The linksof visual image between nodes mutually cross, intricate, such social network have networkproperties.3.social network visualization schemesWith a variety of features, one visual scheme does clearly not present the characteristics of thevarious types of social network data. Different characteristics data need different visualizationschemes. This section describes some common social network visualization schemes.3.1 Node link diagramNode link diagram organizes the data into a structure similar to graph, nodes and links representdata items and relations between them, as shown in Figure 1. Node link diagram is used to visualizedata with hierarchical attributes, using the form of a tree diagram layout – tree, the data can bevisually show hierarchical relationships, the corporate organizational structure shown in Figure 2. Itis also commonly used to visualize network data, the social relationships structure shown in Figure 3.Figure 1. Node link diagramFigure 2. Corporate organizational structure276
Figure 3. Social relationship graph3.2 MatrixNode link diagram can show small amount of hierarchy data, network data and there is a lot ofspace between the branches figure. When the amount of data is large, intertwined branches willbecome chaotic. Matrix would be a good solution to this problem, all the nodes as a matrix of rowsand columns, the matrix value represent the relationship between the nodes, so that the large amountof data, close relationship data can be clearly visualized, as shown in Figure 4.Figure 4. Matrix of interlocking nodes3.3 Time line graphFor the data which has time attribute, information is placed in the horizontal axis coordinatesystem by chronological order, the time is regard as a clue to study social network, the timeline graphshown in Figure 5. The main problem of time line graph is that the limited length of the time axis isdifficult to display all the information when the time is too long .Figure 5. Iphone Publish Time line graph3.4 Mixed graphThe section of papers mentioned that the social network data have overall sparse, dense localfeatures. Theses current visualization scheme cannot clearly visualize these data, researchers haveproposed a hybrid visualization scheme, the node link diagram visualizes sparse data and matrixvisualizes dense data, mixed graph can clearly visualizes this feature of social network data ,as shownin Figure 6.277
Figure 6. Mixed graph4.The layout of social network visualizationThe layout of diagram is the basis of social network visualization layout, the layout of the relatedresearch has been very mature, this paper discusses common social network visualization layoutfocused on the characteristics of social network data.4.1 Force directed layoutThe basic idea of force directed layout is to regard graph as a physical system which the vertex actas steel ring, the edge act as spring, when the system is given an initial state, the role of the springtension will lead to the steel ring moving, it does not stop until the total energy of the system isreduced to the minimum value. Force directed layout is the basis of social network data layout, manylayout algorithms are evolved based on it.4.2 Hierarchical layoutHierarchical layout is mainly for social network data with a hierarchical attribute. Node linkdiagram with the layout of tree structure, each layer of the tree diagram representing the data of perlayer, the hierarchical data is been clearly visualized.4.3 Network layoutNetwork Layout mainly visualize the social network with network characteristics, the node linkdiagram was regarded as network to play in a plane, avoiding links cross and nodes overlap.5.The application of social network visualizationCurrently, there are many scholars applying social network visualization to the study of socialnetwork. Correa et al. use the centrality of node connection in the visualization network to metric keynodes in social networks. Li, X. et al. who solves the problem that the searching result is too large andcomplex in the large-scale social network application, recommending the interesting information ofuser with combining personalization and visualization. Yang, Y.B. et al. who combine social networkvisual analysis and data mining theory, analyzing the data of 1417 cases of terrorist attacks during theyear 1980-2002 with the relevant geographic information, obtained significant results. Huang, M.L.et al. presents a graphical visualization technology of large-scale based on social networkvisualization joined with hierarchical clustering.6.ConclusionThis paper discusses the characteristics of social network data, the related technology, researchand application of social network visualization. Social network visualization , to a certain extent,reduce the difficulty of social network analysis.References[1] Ahmed, A. Dywer, T. Hong, S.H. et al. 2005. Visualization and Analysis of Large and ComplexScale-free Networks. In: EUROGRAPHICS-IEEE VGTC Symposium on Visualization.[2] Barabasi, A.L. & Bonabeau, E. 2003. Scale-free networks. Scientific American. 288: 60 69.278
[3] Correa, C.D. Crnovrsanin, T. & Ma, K.L. 2012. Visual Reasoning about Social Networks UsingCentrality Sensitivity. IEEE Transactions on Visualization and Computer Graphics. 18(1):106-120.[4] Defanti, T.A. Brown, M.D. & McCormick, B.H. 1989. Visualization: Expanding scientific andengineering research opportunities. Computer. 22(8): 12-16.[5] Ding, Z.Y. & Jia Y. 2014. Survey of Data Mining for Microblogs. Journal of Computer Researchand Development. 51(4): 691-706.[6] Eades, P. A heuristic for graph drawing. Congresses Nutnerant-iunt, 1984, 42: 149 160.[7] Henry, N. Fekete, J.D. 2006. Matrix Explorer: A dual-representation system to explore socialnetworks. IEEE Trans. on Visualization and Computer Graphics. 12(5):677 684.[8] Henry, N. Fekete, J.D. McGuffin, M.J. 2007. Node Trix: A hybrid visualization of socialnetworks. IEEE Trans. on Visualization and Computer Graphics. 13(6):1302 1309.[9] Herman, I. Melancon, G. Marshall, M.S. 2000. Graph visualization and navigation ininformation visualization: A survey. IEEE Trans. On Visualization and Computer Graphics.6(1):24 43.[10] Huang, M.L. & Nguyen, Q.V. 2008. Large Graph Visualization by Hierarchical Clustering.Journal of Software. 19(8): 1933-1946.[11] Li, X. & Cao, L. et al. 2014. Visualization Method of Data Personalized Recommendation inSocial Network. Computer Engineering. 40(3): 46-50.[12] Meng, X.F. & Ci, X. 2013. Big Data Management: Concepts, Techniques and Challenges.Journal of Computer Research and Development. 50(1):146-169.[13] Ren, Y.G. & Yu, G. 2004. Research and Development of the Data Visualization Techniques.Computer Science. 31(12):92-96.[14] Robertson, G. G. Mack inlay, J.D. Caed, S.K. Cone trees: Animated 3D visualizations ofhierarchical information [A]. Proceedings of the SIGCHI Conference on Human Factors inComputing Systems[C]. New York: ACM, 1991.189-194.[15] Wang, Z.J. & Huang, W.L. 2013. Research on the Application of Big Data Technology in QuerySystem of Flow Detail Records for Mobile Users. Information and communication technology.[16] Wu, P. & Li, S.K. et al. 2011. Layout of Algorithm Suitable for Structural Analysis andVisualization of Social Network. Journal of Software. 22(10): 2467-2475.[17] Yang, Y.B. & Liu B. et al. 2014. Review of information Visualization. Journal of HebeiUniversity of Science and Technology. 35(1):91-102.[18] Yang, Y.B. & Li, N. et al. 2008. Networked Data Mining Based on Social NetworkVisualizations. Journal of software. 19(8): 1980-1994.[19] Zhang, X. & Yuan, X.R. 2012. Tree map Visualization. Journal of Computer-Aided Design &Computer Graphics. 24(9): 1113-1124.279
2.3 Social network data have hierarchical attribute The social network of social structure and family relationships have grade level. . Research and Development of the Data Visualization Techniques. Computer Science. 31(12):92-96. [14] Robertson, G. G. Mack inlay, J.D. Caed, S.K. Cone trees: Animated 3D visualizations of hierarchical .