Transcription
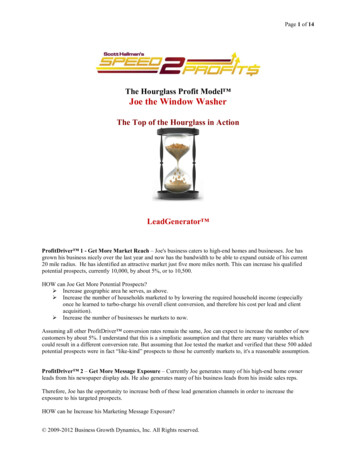
Electrophotonic Experiments during Dr Joe Dispenza workshopFebruary 20-23, 2013AbstractDuring 5 days workshop a series of experiments were conducted with Electrophotonic “BioWell” Camera [1-3] (see descriptionin the Appendix). BioWell camera allows to measure Human Energy Field and record time dynamics of the environmentalenergy with a special sensor “Sputnik”. All measurements are done in automatic mode using Internet for data processing onserver. Human measurements were done before the beginning of the workshop and by the end. A group of people weremeasured every day by night.Sputnik sensor was positions at the back of the stage where Joe was presenting before the audience of about 150 people. Everysession included collective meditation accompanied by music.ResultsStrong responses of Sputnik sensor was recorded during every session of the workshop. All changes were statistically significant.Analysis of these data allows us to conclude that in the process of Joe Dispenza workshop effect of space conditioning wasrecorded. Every person, being present in this conditioned space, feels the influence and transforms in this field, which adds anextra effect to the meditation session.Measurements of the Human Energy Field before and after the workshop demonstrate overall increase of energy for majority ofparticipants and balancing of Chakras.1
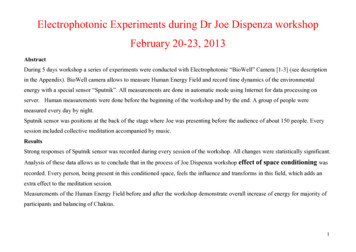
Sputnik sensorFig.1. An example of time dynamics of sensor parameters.Every 5 seconds Sensor measures time-line of several parameters and their Standard Deviation (fig.1). After recording is finishedresearcher puts benchmarks for the significant moments of the session (beginning of presentation, breaks, beginning and end ofmeditation, etc). Program calculates parameters for every marked interval and evaluates statistical difference between intervals.Data are presented as an Energy of light in Joules.2
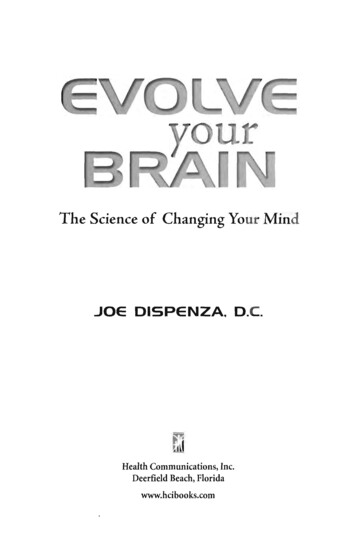
02-21 first dayFig. 2. Statistical processing of data 02-21 morning session 3 h 30 min. Intervals: 1 – beginning; 2 – Joe starts; 3 – Joe presents;4 - break; 5.6 – meditation. Results of statistical processing are presented under the graph. Two intervals are different if p 0.05.Numbers in brackets indicate the number of experimental points in the particular interval (readings are taken every 5 seconds).3
Fig.3. Statistical processing of data 02-21 evening session 3 h 46 min. Intervals: 1 – beginning; 2 – dancing; 3,4 – Joe presents; 5- break; 6 – Joe presents; 7 – meditation; 8 – end of session. Results of statistical processing are presented under the graph. Twointervals are different if p 0.05. Numbers in brackets indicate the number of experimental points in the particular interval(readings are taken every 5 seconds).As we see from the above graphs, in the first day energy in the room was decrising in the process of presentation and meditationboth in the morning and in the evening sessions. Initial level was practically the same, which means that in the brake energy wasrestored back to the initial level.4
02-22 second dayFig.4. Statistical processing of data 02-22 morning session 3 h 26 min. Intervals: 1 – beginning; 2 – dancing; 3,4, 5 – Joepresents; 6 – meditation; 7 – end of session. Results of statistical processing are presented under the graph. Two intervals aredifferent if p 0.05. Numbers in brackets indicate the number of experimental points in the particular interval (readings are takenevery 5 seconds).5
As we see, in the morning session the overall level of energy was higher than in the previous day, and energy was decreasingduring the session. The main decrease was in the process of collective mediation.Fig.5. Statistical processing of data 02-22 evening session 3 h 23 min. Intervals 1 -4 periods of the session 1 hour each. Results ofstatistical processing are presented under the graph. Two intervals are different if p 0.05. Numbers in brackets indicate thenumber of experimental points in the particular interval (readings are taken every 5 seconds).6
As we see from the above graphs energy in the room at the second sessions 02-22 start increasing (fig.5). Sameeffect was measured on the next day (fig.6). By the end of the session the level of energy decreased to he level ofthe first day. These effects correlated with Dr Joe Dispenza course of training.02-23 third dayFig.6. Statistical processing of data 02-23 from 10.40 till 17.12. 1 – meditation for 2 hours; 2 – discussion; 3 - break 1 h; 4 –meditation for 1 h; 5 – Joe’s presentation for 1h; 6 – end of workshop.7
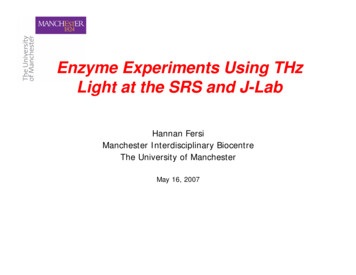
Let us present all these data together (fig.7).Fig.7. Statistical processing of Sputnik sensor data from 3 days of the workshop.8
As we see from this graphs fig.7, in the process of every workshop energy in the room changed dramatically, reducing in the firsttwo days and slowly increasing during the second session of the second day and in the third day. During lunch brakes (marked bydashed lines) energy restored practically to the initial value of the day. Interesting, that in the second day energy was higher, thanin the first day, but by the end of the third day it decreased practically to the background value of the first day.Analysis of these data allows us to conclude that in the process of Joe Dispenza workshop effect of space conditioning wasrecorded. Every person, being present in this conditioned space, feels the influence and transforms in this field, which adds anextra effect to the meditation session. Space conditioning may be kept in the room for many hours, which may be the reason ofstrong energy increase at the second day.At the moment it is difficult to present conceptual explanation of the effect of space conditioning. We should especially take intoconsideration ideas of Professor William Tiller, reflecting on the concurrent conditioned space measurements projects during theEric Pearl workshop [3]:“The periods of audience-focused attention upon the on-stage speaker signals that group entrainment leading to significantgrowth of group coherence is occurring. This leads to high information production rate events. Macroscopic spatial informationentanglement appear to be generating reduced contrast in the magnitudes of various event signatures”.Is it true or not, we will see later, but it is clear that presented data open up new understanding of our reality and the role ofconsciousness in the world.9
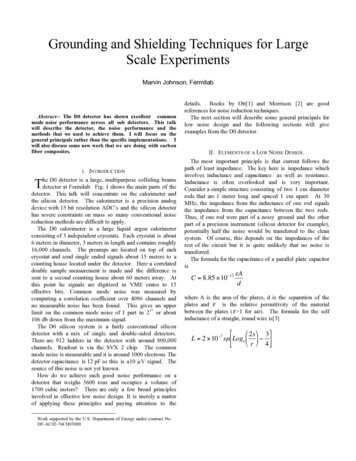
Human response to the workshop110 people were measured with EPI before the workshop 02-20 and at the last day of the workshop 02-23. 17 people weremeasured every day.Fig.8. Energy (Joules) for 105 people before and after the workshop.10
As we see from the graphs fig.8, after the workshop for 95% of people energy increased, same effect was detected for all thechakras, while stress level did not change (fig.9).Fig.9. Stress Coefficient before and after the workshop.11
Energy of Chakras before and after workshop for 103 people12
13
14
15
16
17
18
Chakras BalancingFor most people after the workshop Chakras became balanced (see some examples below).02-2302-2019
20
21
22
23
24
25
Day-by-day analysis17 people have been measured with EPI initially and every day after the first session. As we see from the graph for 16 people adrop of energy on the second day was detected, and then energy increased day-by-day, reaching its maximum by the end of theworkshop. It is interesting that the energy of space increased in the second day, so these effects may not be attributed to theinstrumental effects.Energy for 17 people in 4 days26
Energy of the Cerebral zone had increase in the last day for 11 people from 17, which may be interpreted like different responseof people’s consciousness on the training. Really, we would have expected stronger subconscious reaction.Energy of Cerebral cortex for 17 people in 4 days.27
Energy of the immune system increased for all tested people in the second day, but then dropped down for 8 people, stayed thesame for 6 people and increase for 3 people.Energy of immune system for 17 people in 4 days28
Change of Chakras position in 4 days.02-2002-2102-2202-2329
30
31
32
33
34
35
36
References1. Korotkov K. Non-local Consciousness Influence to Physical Sensors: Experimental Data. Philosophy Study, ISSN 2159-5313 September 2011,Vol. 1, No. 4, 295-3042. Korotkov K., De Vito D., Arem K., Madappa K., Williams B., Wisneski L. Healing Experiments Assessed with Electrophotonic Camera.Subtle Energies & Energy Medicine V 20, N 3, pp 1- 15, 20103. Science Confirms Reconnective Healing: Frontier Science Experiments. Authored by Dr. Konstantin Korotkov. 2012. 152 p. Amazon.comPublishing.37
Electrophotonic Experiments during Dr Joe Dispenza workshop February 20-23, 2013 Abstract During 5 days workshop a series of experiments were conducted with Electrophotonic “BioWell” Camera [1-3] (see description in the Appendix). BioWell camera allows to measure Human Energy Field and record time dynamics of the environmental energy with a special sensor “Sputnik”. All measurements .