Transcription
Adopting quality engineering best practicesMark Geurts MS DABR, Associate ResearcherUniversity of Wisconsin-MadisonNCCAAPM Spring Meeting, April 27, 2018
ANSI/ISO/ASQ 9000The ISO 9000 family addresses various aspects ofquality management and contains standards andtools for companies and organizations who want toensure that their products and services consistentlymeet customer’s requirements, and that quality isconsistently improved.
Process IdentifyFailuresReduceRiskAnalyzeEffects
Ishikawa’s Fundamental Tools of Quality1. Flowcharts2. Pareto charts3. Cause/effect diagrams4. Control charts5. Check sheets6. Scatter diagrams7. Histograms“as much as 95 percent of all quality-relatedproblems in the factory can be solved withseven fundamental quantitative tools.”- Kaoru Ishikawa
Process Mapping (Flow Charts)Goals of process mapping: Communications will be understood All information and resources forprocedure are ready That all know who does what when All training has been completed
Process Mapping StepsAdditional Resources1. Establish flowchart/map purposeKolarik, W. J. (1995). Creating Quality: Concepts,2. Define map boundaries3. Observe processSystems, Strategies, and Tools. New York: McGraw-Hill.Barnes, R. M. (1980). Motion and Time Study Designand Measurement of Work. 7th ed. New York: JohnWiley & Sons.4. Establish gross process flow5. Develop map details6. Check for validity/completenessHughes, T. A. (1995). Measurement and Control Basics.2nd ed. Research Triangle Park, NC: Instrument Societyof istools/overview/flowchart.html
Failure IdentificationOnce the procedure is known, walk through eachstep and identify failures. Common tools include: Fault trees Activity network diagrams Check sheets Pareto chartswww.iso.org
Fault TreesFault trees help people discover, visualize, andcommunicate logical hierarchical relationshipsbetween critical events or objectives Use logical operators, such as AND or OR gates, toconnect lower-level events with higher events Once the logic has been described, quantificationcan take place and risk level assessedasq.org
Fault Trees A fault tree does not contain all possible failure modes or all possiblefault events that could cause system failure Fault trees are capable of considering/modeling human error,hardware and software failures, and environmental causes Top level issues typically go into FMEA/FMECAs, while lower levelshelp identify occurrence probability and opportunities for QA/QC
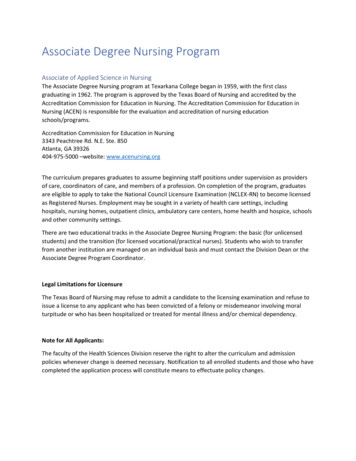
Activity Network Diagrams
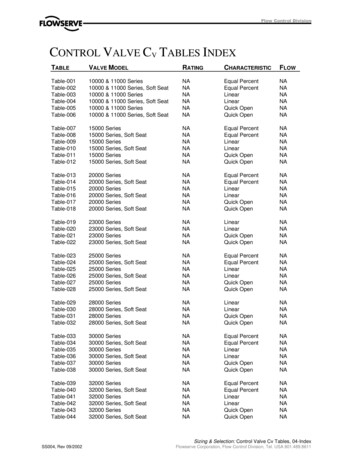
Process Capacity100% Higher variability processes Reducing variability (to bediscussed later) will improveprocess capacityProcess Capacityslow down fasterNo Variability80%Low VariabilityHigh Variability60%40%20%0%Process Utilization
Effects AnalysisDuring the design phase of the process, it isimportant to identify potential failures and theircauses to eliminate critical failures. Commontools include: FMEA FMECA HAZOPxkcd.com/1312/
FMEA/FMECA A Failure Mode and Effects Analysis (FMEA) is a process used to detail whaterrors can occur and what effects they can cause Various failures and causes are compared by ranking the occurrenceprobability, severity, and detection probability The product of all three values is the Risk Priority Number (RPN) FMECA includes a criticality analysis, the product of occurrence and severity
FMEA Standards and Resources Military Standard: MIL-STD 1629A Society for Automotive Engineers Standard: SAE J1739 The Joint Commission: www.jointcommission.org Institute for Healthcare Improvement (IHI): www.ihi.org AAPM Task Group 100: www.aapm.orgdefense.gov
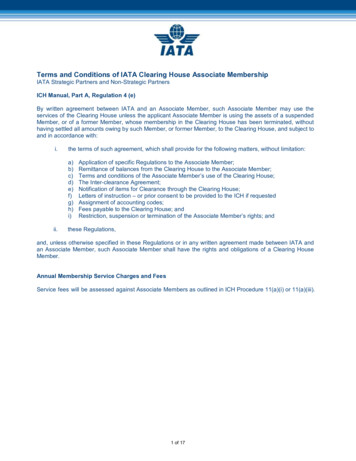
Sample FMEA Form
Scale Recommendations The scale range should be appropriate forthe process being evaluated The scale must not vary between failuremodes or between individuals When data is less available, scoresbecome more biased by individuals When bias occurs, consider normalization(range scaling, rank-order, etc.)xkcd.com/1468/
Often occurrence and detection are afunction of severity Try to discretize the distribution as muchas possible given the data available Consider (at minimum) both the highestseverity and highest overall RPNIncreasing Probability of Occurrence Risk DiscretizationHigh RiskMediumRiskLowRiskIncreasing Severity of Harm/Consequence fda.gov
Palady’s Strategy for FMEA Action1. Eliminate the occurrence2. Reduce the severity3. Reduce the occurrence4. Improve detectionPalady, P. (1997). Failure Modes and Effects Analysis: PracticalApplications. Ann Arbor, MI: Library of Congress.FMEA 2100What order should these failures beaddressed?
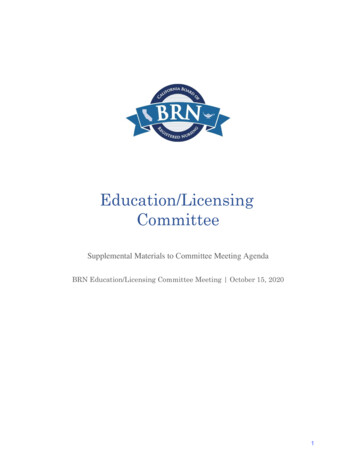
SOD Coding Strategy25120 possible combinations that are not20evenly distributed15 Prioritize failure modes by sorting firstby severity, then occurrence, thendetectabilityFrequency A 1-10 scale of S, O, and D only yields105002004006008001000Risk Priority NumberWheeler, D. M. (2011). Problems With Risk Priority Numbers Avoiding more numerical jabberwocky. Quality Insider (June): Epub.
Common Deficiencies of FMEAs Only as effective as the team’s understanding of the process Highlight the highest risks, not the “lowest hanging fruit” It is difficult to keep one from getting unmanageably large RPNs will not tell you how safe your process is, only how much you arerelatively impacting your risk by implementing changes An FMEA is not static; it must be repeated after making changes
Risk Reduction TechniquesThe preventing faults is accomplished by:1. Eliminating progenitor causes(consider AND/OR gates)2. Interrupting the propagation(add QA/QC)x
Risk Reduction Techniques Find common faults (i.e. operator error) Correct any environmental problems(inexpensive and effective) You can never eliminate human errorexcept by eliminating the humans Design the process to be resilient tohuman error
Core Components of AAPM TG 1001. Standardized procedures“Redundancy is not2. Adequate training of staffuseless duplication”3. Maintenance of hardware and software- Robert Loevinger4. Clear lines of communication among staff5. Adequate resources to perform the jobHuq, M. S. (2016), The report of Task Group 100 of the AAPM: Application of riskanalysis methods to radiation therapy quality management. Med. Phys., 43: 4209–4262.“Useless duplication isnot redundancy”- Bruce Thomadsen
ISMP Order of EffectivenessType of ActionExamples1. Forcing Functions and ConstraintsInterlocks, barriers, computerized order entry withfeedback2. Automation and ComputerizationBar codes, automated monitoring, computerizedentry without feedback3. Standard procedures and protocolsChecklists, alarms, labels, signs, establishedcommunication/escalation pathways4. Independent check systems/redundanciesRedundant measurements, independent review5. Rules and PoliciesStaffing/scheduling, time outs, preventativemaintenance inspections, equipment QA6. Education and TrainingTraining, experienceInstitute for Safe Medicine Practices (1999). Medication error prevention “toolbox”. www.ismp.org
Quality Controls and AssuranceFailure Quality control and assurance actionsare added to a process to reduce risk Quality controls focus on reducing theProcessQAInput 2QCoccurrence probability Quality assurance increases thedetection probabilityInput 1
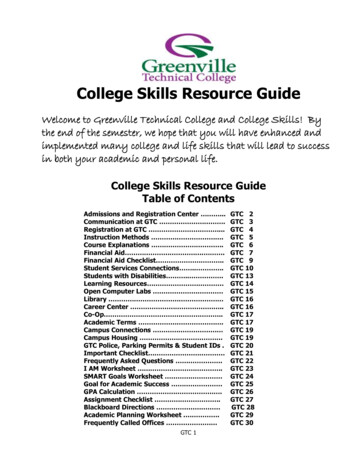
QA or QC? QC typically requires more resourcesFrequency of Errors Caught in Radiotherapy QA detection adds time to a procedureas the process must be repeated If you are catching many error with QA,move resources to QC If you are not picking up error with QA,question its utility or change frequencyFord (2012). IJROBP 84: e263-9
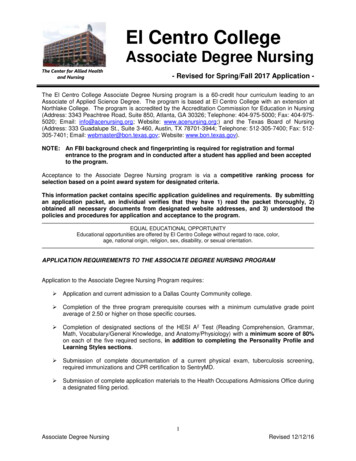
QA Frequencyprocedure is performed QA frequency can vary based onaccepted level of risk (FMEA,inspection sampling theory, etc.) Full time QA can be consideredQC for the downstream processProbability that all runs passed QC is conducted every time aOperating Characteristic CurveFailure occurrence probabilityN number of runsn frequency of QAc number of QA measurements that are allowed to fail
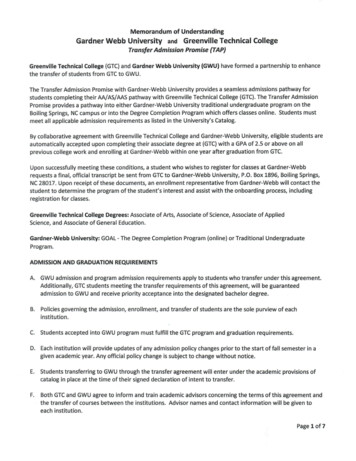
Quality Control Checklists Checklists reduce the risk of slips oromissions in a process Avoid too much detail; users will“check through” too quicklyAdditional ResourcesGawande, A. (2009). The Checklist Manifesto: Howto Get Things Right. Metropolitan Books, New York.Pronovost, P., and Vohr, E. (2010). Safe Patients,Smart Hospitals: How One Doctor's Checklist CanHelp Us Change Health Care from the Inside Out1ed. Hudson Street Press. Adding form input to high risk stepscauses user to pause, validate Checklist should be physical or digitalde los Santos, E. F., et al. (2015), Medical PhysicsPractice Guideline 4.a: Development,implementation, use and maintenance of safetychecklists. Journal of Applied Clinical MedicalPhysics, 16: 37–59.
Checklist Design
Statistical Process Control SPC is quantitative problem solving, consisting of diagnostictechniques to assist in locating problem sources andprescriptive techniques to help solve problems Control charts are commonly used to compare a measurementto a defined Lower (LCL) and Upper Control Limit (UCL) Control limits are either defined using dataset range or variance
Range Control Chart ExampleCBC Turnaround (min) in an ERControl Charts for Mean and Range
Attribute Control Charts (p-charts)Surgical Site Infection RatesControl Chart for Infection Probability
Rules for Determining Process Control1.One point more than 3 from the centerline (either side)2.Seven points in a row on one side of the centerline3.Six points in a row, all increasing or all decreasing4.Fourteen points in a row, alternating up and down5.Two out of three points more than 2 from the centerline (same side)6.Four out of five points more than 1 from the centerline (same side)7.Fifteen points in a row within 1 of the centerline (either side)8.Eight points in a row more than 1 from the centerline (either side)Automotive Industry Action Group. 1995. MeasurementSystem Analysis Reference Manual. Detroit, MI: AIAG.
Process and Performance Capabilitycompares the tolerance (the width of the engineeringspecifications) with the natural process tolerance. Given Lower(LSL) and Upper Specification Limits (USL):6
Other Process Capability Indices1.2.is the inverse ofpenalizes a process who’s mean is off center:̿33.,̿3also considers deviation from a target :6̿
Out of Control Processes If the process is out of control, or the trueprocess varianceis unknown, thesame indices can be used by replacingwith the sampled variance The process index names change fromto, etc.
Six Sigma6σ is not a standalone method; rather, it combines the 6σbusiness strategy with existing quality tools, DMAIC, with thegoal of achieving 6σ metrics: Process capability indices of 3.4 errors per million opportunities2.0 and1.5
ppm rateSix Sigma MetricsSigma level (with 1.5 σ shift)F. W. Breyfogle III, Implementing Six Sigma (John Wiley & Sons, 1994).Copyright Motorola
Key References1.American Society for Quality (2018). Learn About Quality. Retrieved fromhttp://asq.org/learn-about-quality.2.Borror, C. M. (2009). The Certified Quality Engineer Handbook: ASQ Quality Press.3.Thomadsen, B. (2015). Elements of Quality and Safety in Healthcare (First Edition):University Readers.Unless noted, graphics in this presentation have been taken from the abovereferences per the Fair Use guidelines in Circular 21 of the Copyright Office.https://www.copyright.gov/circs/circ21.pdf
Apr 27, 2018 · FMEA/FMECA A Failure Mode and Effects Analysis (FMEA) is a process used to detail what errors can occur and what effects they can cause Various failures and causes are compared by ranking the occurrence probability, severity, and detectionprobability The prod