Transcription
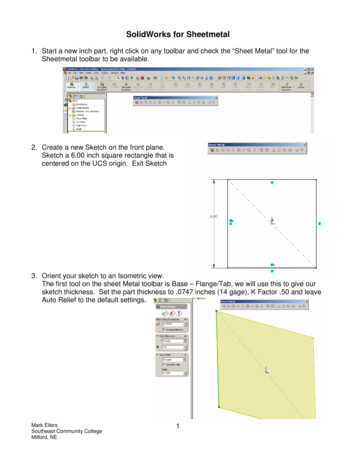
Engineering Sketch Generation for Computer-Aided DesignKarl D.D. WillisPradeep Kumar Jayaraman Joseph G. LambourneAutodesk ResearchHang ChuYewen PuEngineering SketchGeneratorSKETCH GENERATION3D SYNTHESIS3D COMPOSITIONFigure 1: We tackle the problem of learning based engineering sketch generation as a first step towards synthesis and composition of solid models with an editable parametric CAD history.AbstractEngineering sketches form the 2D basis of parametric Computer-Aided Design (CAD), the foremost modeling paradigm for manufactured objects. In this paper wetackle the problem of learning based engineering sketchgeneration as a first step towards synthesis and composition of parametric CAD models. We propose two generative models, CurveGen and TurtleGen, for engineeringsketch generation. Both models generate curve primitiveswithout the need for a sketch constraint solver and explicitly consider topology for downstream use with constraintsand 3D CAD modeling operations. We find in our perceptual evaluation using human subjects that both CurveGenand TurtleGen produce more realistic engineering sketcheswhen compared with the current state-of-the-art for engineering sketch generation.1. IntroductionParametric Computer-Aided Design (CAD) is the foremost 3D modeling paradigm used to design manufacturedobjects from automobile parts, to electronic devices, to furniture. Engineering sketches form the 2D basis of paramet-ric CAD, and refer specifically to composite curves madeup of 2D geometric primitives (e.g. lines, arcs, circles),topological information about how the primitives connecttogether, and constraints defined using topology (e.g. coincidence, tangency, symmetry). Engineering sketches canbe extruded or revolved to generate simple 3D solid bodies(Figure 1), and in turn combined using Boolean operationsto build up complex shapes [22]. This workflow is common to all parametric CAD software and supported by allthe major solid modeling kernels. Consequently, the ability to generate high quality engineering sketches is a majorenabling technology for the automatic generation of solidmodels with an editable parametric CAD history.Engineering sketch generation can be applied in a number of CAD workflows. For example, a long sought-aftergoal is the ability to automatically reverse engineer a parametric CAD model from noisy 3D scan data [1]. Oneway to realize this goal is to generate 2D CAD sketchesfrom sparse scan data, just like human designers would,and apply suitable modeling operations to reconstruct the3D CAD model. Engineering sketch generation can also beapplied to auto-completion of user input. The ability to infer repetitive commands based on visual or geometric inputcould significantly ease user burden when producing complex engineering sketches. Another sought-after capabil-
ity is the generation of engineering sketches from approximate geometry like free-hand drawings. Often referred to asbeautification, a generative model for engineering sketchescould potentially improve user workflows over traditionalapproaches [9].Despite recent advances with 2D vector graphic generation using data-driven approaches [21, 3, 26], there existslimited research on synthesizing engineering sketches directly. This is a challenging problem because engineeringsketches contain disparate 2D geometric primitives coupledwith topological information on how these primitives areconnected together. The topology information is critical toensure: 1) geometric primitives can be grouped into closedprofile loops and lifted to 3D with modeling operations, and2) constraints can be correctly defined using the topology,for example, two lines can be constrained to intersect at 90 if their endpoints are known to coincide. With the availability of large-scale engineering sketch and parametric CADdatasets [27, 35], we believe a data-driven approach thatlearns a generative model is a promising avenue to explore.In this paper, we propose two generative models, CurveGen and TurtleGen, for the task of engineering sketch generation. CurveGen is an adaptation of PolyGen [23], whereTransformer networks are used to predict the sketches autoregressively. While PolyGen generates polygonal meshvertices and indexed face sets, CurveGen generates vertices lying on individual curves and indexed hyperedge setsthat group the vertices into different curve primitives (line,arc, circle). This approach generates not only the individual curve geometry, but also the topology linking different curves, a vital requirement of engineering sketches.TurtleGen is an extension of TurtleGraphics [11], wherean autoregressive neural network generates a sequence ofpen down, pen draw, pen up commands, creating a seriesof closed loops which forms the engineering sketch. Wefind in our perceptual evaluation using human subjects thatboth CurveGen and TurtleGen produce more realistic engineering sketches when compared with the current state-ofthe-art for engineering sketch generation. Importantly, bothCurveGen and TurtleGen can generate geometry and topology directly without the expense of using a sketch constraintsolver. This paper makes the following contributions: We introduce two generative models which tackle theproblem of engineering sketch generation without theuse of a sketch constraint solver. We use a novel sketch representation with our CurveGen model that implicitly encodes the sketch primitivetype based on hyperedge cardinality. We show quantitative and qualitative results for engineering sketch generation, including the results ofa perceptual study comparing our generative modelswith a state-of-the-art baseline.2. Related WorkWith the advent of deep learning a vast body of workhas focused on generation of novel raster images. By contrast, significantly fewer works have tackled image generation using parametric curves such as lines, arcs, or Béziercurves. Parametric curves are widely used in 2D applications including vector graphics, technical drawings, floorplans, and engineering sketches—the focus of this paper. Inthis section we review work related to engineering sketchgeneration and its application to the synthesis and composition of solid CAD models.Vector Graphics Vector graphics are used extensivelyin commercial software to enable the resolution independent design of fonts, logos, animations, and illustrations.Although a rich body of work has focused on freeformsketches [36, 37], we narrow our focus to structured vector graphics that consider shape topology, connectivity, orhierarchy relevant to engineering sketches.Fonts are described with curves that form closed loopprofiles and can contain interior holes to represent letters ofdifferent genus (e.g. b or B). SVG-VAE [21] is the first workto learn a latent representation of fonts using a sequentialgenerative model for vector graphic output. DeepSVG [3]considers the structured nature of both fonts and icons witha hierarchical Transformer architecture. BézierGAN [4]synthesizes smooth curves using a generative adversarialnetwork [12] and applies it to 2D airfoil profiles. More recently, Im2Vec [26] leverages differentiable rendering [20]for vector graphic generation trained only on raster images.Common in prior research is the use of Bézier curves.Line, arc, and circle primitives are preferred in engineering sketches as they are easier to control parametrically,less prone to numerical issues (e.g. when computing intersections, offsetting, etc.) and can be lifted to 3D prismatic shapes like planes and cylinders rather than NURBSsurfaces. In contrast to prior work, we pursue engineeringsketch generation with line, arc, and circle primitives andexplicitly consider topology for downstream application ofconstraints and use with 3D CAD modeling operations.Technical Drawings and Layout Technical drawingstake the form of 2D projections of 3D CAD models, often with important details marked by dimensions, notes,or section views. Han et al. [13] present the SPARE3Ddataset, a collection of technical drawings generated from3D objects with three axis-aligned and one isometric projection. The dataset is primarily aimed at spatial reasoningtasks. Pu et al. [25] show how freehand 2D sketches canbe used to assist in the retrieval of 3D models from largeobject databases. Their system allows designers to makefreehand sketches approximating the engineering sketches
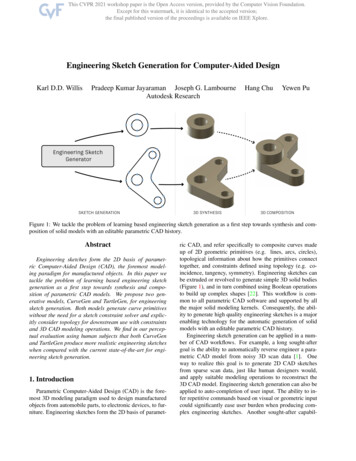
which would be used in the construction of a 3D model.Egiazarian et al. [5] address the long standing problem ofimage vectorization for technical drawings. They predictthe parameters of lines and Bézier curves with a Transformer based network, then refine them using optimization.In contrast, our system focuses on the generation of newsketch geometry suitable for use with 3D CAD modelingoperations.An emerging area of research considers learning basedapproaches to generative layout for graphic design [18, 38,17] and floor plans [24, 15]. Although a different domainthan engineering sketches, these works output high levelprimitives (e.g. rooms in a floor plan) that must be correctlyconnected to the overall layout and obey relevant constraints(e.g. number of bedrooms). Layout problems have similarities to engineering sketches where connectivity betweenparts of the sketch and relationships, such as parallel, symmetric, or perpendicular curves, are critical when designing.Program Synthesis Another potential approach to engineering sketch generation is program synthesis. Recentwork in this domain leverages neural networks in combination with techniques from the programming language literature to generate or infer programs capable of representing 2D [7, 8, 28] or 3D [28, 32, 6, 16] geometry. One canview engineering sketch generation as a program synthesis task where the geometry is represented as a sequenceof programmatic commands that draw vertices and curves,constructing the sketch one piece at a time. Future applications of program synthesis would allow us to model morecomplex operations with programmatic constructs, such asrepetitions (loops), symmetries (constraints), and modifications (refactoring and debugging).Reverse engineering Another important field is reverseengineering 3D models from scan data or triangle meshes[2]. Typically 2D poly-linear profiles are generated by intersecting the mesh data with a plane, and then line and arcprimitives can be least squares fitted in a way which respectsa series of constraints [1]. Generative models which can beconditioned on approximate data provide an approach towards automating this part of the reverse engineering procedure. Recent learning-based approaches have tackled thechallenge of reverse engineering parametric curves [10, 34],paving the way for reconstruction of trimmed surface models [19, 30, 31, 29]. In contrast to these works, we focuson 2D sketch generation as a building block towards thesynthesis and composition of solid models, with parametricCAD history, using common modeling operations.Engineering Sketches Most closely related to our workis SketchGraphs [27], a recently released dataset and baseline generative model for the task of engineering sketch rtex(128,128)Arc(86,85)(86,43)(255,43)CircleFigure 2: A hypergraph representation of a sketch consisting of three lines (2 vertices), an arc (3 vertices), and a circle(4 vertices).eration. The SketchGraphs dataset consists of engineeringsketches made by users of the Onshape CAD software. TheSketchGraphs generative model works by predicting the underlying geometric constraint graph, and relies on a sketchconstraint solver to determine the final configuration of thesketch. Unlike SketchGraphs we directly predict geometry and are not reliant on a sketch constraint solver. Weobserve qualitatively that our methods naturally generategeometry which conforms to the regular patterns seen inengineering sketches, such as horizontal and vertical linesand symmetries. The network can be considered to encodethe constraint information implicitly in the geometric coordinates, allowing constrained sketches to be recovered in apost-processing step if required. We compare our work directly to SketchGraphs and present results that show we areable to produce more realistic engineering sketch output.3. Method3.1. Engineering Sketch RepresentationTo create an engineering sketch representation we consider a number of factors. 1) Engineering sketches are composed primarily from lines, arcs, and circles, while ellipsesand splines are used less frequently [27, 35]. 2) Engineering sketches must obey constraints such as forming closedprofiles, coinciding the end points, and forming 90 degreeangles. 3) As the constraints remove many degrees of freedom, engineering sketches are both structured and sparsewhen compared to free-form sketches or vector graphics.We present two representations of engineering sketches thataccount for these design considerations: Sketch Hypergraphrepresentation (used by CurveGen) and Turtle Graphics representation (used by TurtleGen).Sketch Hypergraph Representation Under this representation, a sketch is represented as a hypergraph G (V, E) where V {v1 , v2 , . . . , vn } denotes the set of nvertices, each vertex vi (xi , yi ) consists of a vertex id iand its corresponding location xi , yi . E denotes a set of hy-
peredges that connects 2 or more vertices to form geometricprimitives. The primitive curve type is implicitly definedby the cardinality of the hyperedge: line (2), arc (3), circle(4). Arcs are recovered by finding the circle that uniquelypasses through the 3 vertices. Circles are recovered by aleast squares fitting due to the over-parameterization by 4points. Figure 2 shows the sketch hypergraph representation, consisting of 9 vertices and 5 hyperedges. In addition,the vertices are quantized to a 256 256 grid to bias the generative model into generating few distinct coordinates bylearning to produce repeated (x, y) values.3.2.1CurveGenCurveGen is our adaptation of the PolyGen [23] architecture applied to engineering sketch generation. CurveGengenerates the sketch hypergraph representation directly. Aswith the original PolyGen implementation, we break thegeneration of G into two steps based on the chain rule: 1)generate the sketch vertices V , 2) generate the sketch hyperedges E conditioned on the vertices:p(G) p(E V ) p(V ) , {z } {z }CurvemodelTurtle Graphics Representation The Turtle Graphicsrepresentation uses a sequence of drawing commands,which can be executed to form an engineering sketch in thehypergraph representation. Intuitively, the turtle representation can be thought of as a sequence of pen-up, pen-moveactions, which iteratively draws the engineering sketch oneloop at a time. It is used by Ellis et al. [8] to generate compositional and symmetric sketches. Specifically, the drawing commands of turtle graphics are specified by the following grammar:T urtleLoopDrawLoopStartLineArcCircle [ Loop ]LoopStart [Draw]Line Arc Circleloopstart( )line( )arc( , )circle( , , , )(int, int)Here, a T urtle program consists of a sequence of Loops,each loop consists of a start command LoopStart, followedby a sequence of [Draw] commands. The pen initiallystarts at (0, 0). The LoopStart command starts a new loopby lifting the current pen, displacing/teleporting it by andputting it back down. The Draw command can be one ofthree primitives Line, Arc, and Circle, each parameterizedby a different number of displacements, which extend thecurrent loop without lifting the pen, displacing it relativeto the current pen location. After a loop is completed, thepen returns/teleports back to (0, 0). As with the hypergraphrepresentation, values are quantized to a 256 256 grid.The loops are ordered so that ones closest to (0, 0), wheredistance is measured between the loop’s closest vertex to(0, 0), are drawn first. We provide an example program inSection A.1 of the Supplementary Material.3.2. Generative ModelsWe design and compare two different neural architectures on the task of engineering sketch generation: CurveGen and TurtleGen.Vertexmodelwhere p(·) are probability distributions. Figure 3 illustrates the two step generation process starting with the vertex model (left) and then the curve model (right). The final stage of recovering the curve primitives from the hyperedges is done as a post-process. We use the vertex model directly from PolyGen with 2D vertex coordinates and adaptour curve model from the PolyGen face model to work with2D curves. We use 3 Transformer blocks in the vertex decoder, curve encoder, and curve decoder Transformer models [33]. Each block includes a multihead attention with8 heads, layer normalization and a 2-layer multilayer perceptron (MLP) with 512D hidden, and 128D output dimensions. Dropout with rates 0.2 and 0.5 are applied in eachblock of the vertex and curve models, respectively, right after the MLP. The vertex and curve models are both trainedby negative log likelihood loss against the ground truth data.Once the neural network is trained, we perform nucleussampling [14] to directly generate samples in the hypergraph sketch representation. We refer the reader to Nashet al. [23] for further details.3.2.2TurtleGenThe neural network for generating a program in the Turtlerepresentation is a sequence generator. The sequence of turtle commands are encoded as a sequence of discrete valuedtokens, where each of the commands loopstart, line, arc,circle, along with two tokens for sequence start and end,are represented as 1-hot vectors. The quantized integer coordinates are encoded as two 1-hot vectors for x and y each.For any given sketch in the hypergraph representation, werandomize the turtle sequence generation by randomly selecting the loop order, loop’s starting vertex, and the direction of drawing the loop. We discard long sequences over100 turtle commands.The neural network is a simple 9-layer Transformer with512D hidden and 128D output dimensions. The networkhas seven linear branches of input and output, where thefirst branch corresponds to the type of command, and theremaining six branches correspond to three x and y coordinates. Commands with less than three points are padded
(y,x)PREDICTION(y,x)NextCurveVertex TransformerCONDITIONINGVertex TransformerCurve TransformerCurve TransformerCurve TransformerCurve Transformer(y,x)Vertex ModelCurve ModelFigure 3: CurveGen, our variant of the PolyGen [23] architecture, first generates sketch vertices (left), and then generatessketch curves conditioned on the vertices (right).with zeros. The input branches are concatenated and addedwith the conventional positional embedding after a linearlayer, before they are fed into the Transformer network. Theoutput branches are connected to the Transformer encoding at the previous sequence step. We store the first threeground-truth turtle steps from the training set as a fixed dictionary, which we randomly sample from to preconditionthe auto-regressive model at sampling time. Each sampledsequence is then executed to recover the sketch hypergraphrepresentation, and define the geometry and topology.4. ResultsWe now present quantitative and qualitative resultson the task of engineering sketch generation, comparingthe CurveGen and TurtleGen generative models with theSketchGraphs [27] generative model.4.1. Data PreparationWe use the pre-filtered version of the SketchGraphs [27]dataset that contains 9.8 million engineering sketches with16 or fewer curves. We remove duplicates from the datasetto promote data diversity during training, and ensure evaluation on unseen data at test time. We consider two sketches tobe duplicates if they have identical topology and similar geometry. To detect similar geometry, sketches are uniformlyscaled and the coordinates are quantized into a 9 9 grid.Vertices are considered identical if they lie in the same gridsquare. The same quantization is also applied to the radiiof circles and arcs. Lines are considered identical if the endpoints are identical. Arcs additionally check for an identicalquantized radius. Circles check the center point and radius.We do not consider a sketch unique if both the topology andgeometry match, but curve or vertex order is different. Using this approach we find that duplicates make up 87.01%of the SketchGraphs data. We remove all duplicates, invaliddata (e.g. sketches with only points) and omit constructioncurves. We use the official training split and after filteringhave 1,106,328 / 39,407 / 39,147 sketches for the train, validation, and test sets respectively.4.2. Experiment SetupWe train the CurveGen model on the SketchGraphs training set. Unlike the ShapeNet dataset used to train the original Polygen model, the SketchGraphs data does not haveany notion of classes and represents a more challenging,but realistic scenario where human annotated labels are unavailable. We train for 2 million iterations with a batch sizeof 8 using 4 Nvidia V100 GPUs. We use the Adam optimizer with learning rate 5e-4, and apply to the curve modeldata a jitter augmentation with the amount sampled from atruncated normal distribution with mean 0, variance 0.1 andtruncated by the bounding box of the sketch vertices. Training time takes approximately 48 hours. We save the modelwith the lowest overall validation loss for evaluation.We train the TurtleGen model on the same data. To ensure fair comparison, we train the model with a batch sizeof 128 for a total of 0.5 million iterations, which exposesthe model to the same number of training data samples asCurveGen. Training is done with a single Nvidia V100GPU and takes around 48 hours. We use the Adam optimizer with a learning rate of 5e-4, as well as a learning ratescheduler that decreases the learning rate by a factor of 0.5when the validation loss plateaus. Validation is conductedonce every 500 training iterations. We save the model withthe lowest overall validation loss for evaluation.We train the SketchGraphs generative model using theofficial implementation with and without duplicates. Wetrain for 150 epochs, as in the original paper, on a singleQuadro RTX 6000 GPU. Training time takes approximately27 hours. Following the advice of the SketchGraphs authors, we adjust the learning rate scheduler to reduce thelearning rate at epochs 50 and 100. All other hyperparameters and settings follow the official implementation, in-
Table 1: Quantitative sketch generation results. Bits per Vertex and Bits per Sketch are the negative log-likelihood calculatedover the test set; both are not directly comparable and reported separately for the vertex/curve models used in CurveGen.Unique, Valid, and Novel are calculated over 1000 generated sketches.ModelParametersBits per VertexBits per SketchUnique %Valid %Novel %CurveGenTurtleGenSketchGraphsSketchGraphs (w/ .75 / 0.202.27-176.69 / 65.8074.0090.9080.6069.1049.704.3.1MetricsFor quantitative evaluation we report the following metrics. Bits per Vertex is the negative log-likelihood of testexamples averaged per-vertex and converted from nats tobits; lower is better. Bits per Sketch is the negative loglikelihood of test examples averaged per-sketch as a wholein bits; lower is better. For CurveGen we report the bits forboth the vertex and curve models. Unique is the percentageof unique sketches generated within the sample set. We usethe duplicate detection method described in Section 4.1 tofind the percentage of unique sketches. A lower value indicates the model outputs more duplicate sketches. Valid isthe percentage of valid sketches generated. Invalid sketchesinclude curve fitting failures, curves generated with 4 vertices, or identical vertices within a curve. Novel is the percentage of novel sketches generated that are not identicalto sketches in the training set. We again use the duplicatedetection method described in Section 4.1. We evaluatethe bits per vertex/sketch metrics on the withheld test set.All other metrics are evaluated on 1000 generated samples.We include non-Valid sketches, which often contain validcurves, when calculating the Unique and Novel metrics.4.3.2Quantitative ComparisonTable 1 shows the results comparing CurveGen and TurtleGen with the SketchGraphs generative model. The parameter count for each model is provided for reference. Due todifferences in sketch representation and terms in the negative log likelihood loss, the bits per vertex and bits persketch results are not directly comparable between models, and only provided here for reference. For the SketchGraphs model, the prediction of numerical node featuresadds an additional term into the loss, giving a higher bits persketch value than reported in the SketchGraphs paper. Invalid sketches occur most frequently with TurtleGen, whereidentical vertices within a curve are often predicted. Invalid4.4. Perceptual EvaluationTo understand how engineering sketches generated byeach model compare to human designed sketches, we perform a perceptual evaluation using human subjects. In ourtwo-alternative forced choice study, each participant is presented with one human designed and one generated engineering sketch and asked: “Which sketch is more realistic?". Brief instructions are provided, including an illustration of an engineering sketch used in context, similar to Figure 1. We evaluate 1000 unique generative sketches fromeach model, with a consistent set of 1000 human designedsketches from the SketchGraphs test set. For each pair ofsketches, we log the responses of three human subjects and50%Indistinguishable from Human er Agreement %4.3. Quantitative Resultssketches from SketchGraphs are commonly due to arcs ofnear zero length. For the novel metric, it is reasonable to expect generative models to produce some identical sketchesto those in the training data, such as simple circles, rectangles, and combinations thereof. The low percentage ofnovel sketches generated by SketchGraphs when trained onthe dataset with duplicates suggests that the model memorizes sketches which are duplicated in the training data. Removing duplicates from the data helps improve variety inthe output. For the remainder of the paper we report resultsfrom all models trained without duplicates.Realistic Sketch % vs. Human Designedcluding the prediction of numerical node features. Theseprovide improved geometry initialization before the data ispassed to the OnShape constraint solver.10%CurveGen TurtleGen SketchGraphs0%CurveGen TurtleGen SketchGraphsFigure 4: Results from our perceptual evaluation usinghuman subjects to identify the most realistic engineeringsketch. Left: The percentage of generated sketches classedas more realistic than human designed sketches. Right: Thepercentage of inter-rater agreement.
Human DesignedCurveGenTurtleGenSketchGraphsFigure 5: Qualitative sketch generation results. From left to right: human designed sketches from the SketchGraphs dataset,randomly selected sketches generated using the CurveGen, TurtleGen, and SketchGraphs generative models.
Figure 6: Examples of 3D geometry produced by extruding the closed profiles of sketches generated from CurveGen.use the majority answer. We conduct the study using workers from Amazon Mechanical Turk. Figure 4, left showsthe percentage of generated sketches classed as more realistic than human designed sketches; higher values are better. A value of 50% indicates the generated sketches areindistinguishable from human design. Figure 4, right showsthe inter-rater agreement calculated as a percentage betweeneach of the three human subjects. A lower value indicatesthere is more confusion between the generated and humandesigned sketches. The study results show that human subjects find CurveGen output to be the most realistic of thegenerated engineering sketches.4.5. Qualitative ResultsUnconstrainedFigure 5 shows human designed sketches from theSketchGraphs dataset beside randomly selected validsketches generated using the CurveGen, TurtleGen, andSketchGraphs generative models. We observe that CurveGen in particular is able to consistently produce sketcheswith closed loops, symmetrical features, perpendicularlines, and parallel lines. We provide additional qualitativeresults in Section A.2 of the supplementary material.Sketch to Solid CAD Models A key motivation of thecurrent work is to enable the synthesis and composition ofsolid CAD models. In Figure 6 we demonstrate how engineering sketches generated by CurveGen with closed loopprofiles can be lifted into 3D using the extrude modelingoperation in a procedural manner.Sketch Constraints The geometric output of our generative models can be post-processed to apply sketch constraints and build a constraint graph. Figure 7 shows howthe auto-constrain functionality in Autodesk AutoCAD canenforce parallel and perpendicular lines within a given tolerance. The unconstrained output from CurveGen is shownon the top row, and has a number of lines that are close toperpendicular. The auto-constrained output on the bottomrow snaps these lines to perpendicular and establishes constraints for further editing.Auto-constrained5. ConclusionFigure 7: Comparison of sketches generated by CurveGenbefore (top) and after (bottom) applying automatic constraints in Autodesk AutoCAD.In this paper we presented the CurveGen and TurtleGengenerative models for the task of engineering sketch generation and demonstrated that they produce more realistic output when compared with the current state-of-the art. We believe engineering sketches are an important building blockon the path to synthesis and composition of solid modelswith an editable parametric CAD history. Promising futuredirections include modeling higher-order constructs such asconstraints and repetitions in the underlying design.
R
Parametric Computer-Aided Design (CAD) is the fore-most 3D modeling paradigm used to design manufactured objects from automobile parts, to electronic devices, to fur-niture. Engineering sketches form the 2D basis of paramet-ric CAD, and refer specifically to composite curves made u