Transcription
JOURNAL OF LIGHTWAVE TECHNOLOGY, VOL. 12, NO. 5, MAY 1994803Evaluation of Absorption and EmissionCross Sections of Er-Doped LiNb03 forApplication to Integrated Optic AmplifiersChi-hung Huang, Leon McCaughan, Member, ZEEE, and Douglas M. Gill-Abstract-The polarization-dependentabsorption and emissionspectra of the 4113/2-4115/2transition (A1.5 pm) in singlecrystal bulk Er:LiNbOs have been measured. Low-temperature(10 K) measurements of the Stark split energy levels of these twomanifolds indicate at least two Er3 sites. McCumber theory isapplied to determine the Er:LiNb03 absorption and emissioncross sections. These values are used to calculate the gain characteristics of Er:LiNbOs channel waveguides. Calculations indicatethat a gain of 10 dB is achievable in a waveguide of severalcentimeters using -20-mW pump power.I. INTRODUCTIONRARE-EARTH doped materials have received renewedattention because of the availability of a broad rangeof diode laser pumps. Recent research interest has focusedon Er-doped materials because the 4113/2 4115/2 transitionof Er3 emits at X 1.5 pm, a wavelength useful for fibercommunications. The most notable achievement so far hasbeen the Er-doped glass fiber [l]. Fiber lasers [2], [3] andtraveling-wave amplifiers [4], [5] have been demonstratedand modeled [ 6 ] , [7]. Recently, work has also begun on Erdoped Ti:LiNb03 waveguide devices. These devices have thepotential for co-integration with other optical devices, such asoptical switches and modulators. Stimulated emission [8] andlaser operation [9] based on this material have been realized.Unlike silica fiber, LiNbO3 is a crystalline material. Eratoms in a LiNbO3 host are likely to have well-definedlattice site locations, reducing the inhomogeneous broadening,and should therefore have better pumping and amplificationefficiencies than Er-doped fibers. Er:LiNb03 devices demonstrated to date have been made with planar-doped substrates.Planar-doped or bulk-doped L i m o 3 , however, is not optimalfor integrated optical circuits, in general, since it requiresthat the entire waveguide circuit be pumped to transparency.Equally restrictive, the transverse distribution of the activemedium cannot be optimized. Recently, we have demonstrateda method for locally incorporating significant concentrationsManuscript received June 17, 1993; revised October 18, 1993. This workwas supported in part by NSF under Grants ECS-9204852, and a NewportResearch Award (to D. M. Gill).C . Huang and L. McCaughan are with the Department of Electricaland Computer Engineering, University of Wisconsin-Madison, Madison, WI53706, USA.D. M. Gill is with the Material Science Program, University of Wisconsin-Madison, Madison, WI 53706, USA.IEEE Log Number 9215934.of Er3 by way of co-diffusion with Ti [lo] as an effort toprovide a more flexible doping scheme.In order to predict the gain of devices with a nonuniformlydistributed active medium, a knowledge of the absorptionand emission cross sections is essential. In this paper twomethods of determining these cross sections are discussed.We have found the generally used Ladenburg-Fuchtbauerrelationship [ 111, [ 121 to be inappropriate for this case. Instead,we apply McCumber theory [13] using the Stark split 4113/2and 4115/2 energy levels measured from 10 K polarizedabsorption and emission spectra. Employing these cross sections (assuming that bulk-doped Er:LiNbOs yields the samecross section values as in locally doped waveguides), wecalculate the gain characteristics, with consideration of theamplified spontaneous emission (ASE), of Er-doped LiNbO3channel waveguides by applying steady-state rate equationsand simplified optical mode and Er3 concentration profilesin the waveguides.11. THEORYThe optical gain of a medium is defined aswhere I u ( z ) is the light intensity at frequency v along the zdirection. If the gain is provided by the transition between twoquantum states of the active material, then the gain coefficientcan be written asy(v) Nuaem(v) - Nlaab(v)(2)where Nl, Nu, a,,(v) and Oab(v) are the populations ofthe lower and upper energy states, and the emission andabsorption cross sections, respectively. In order to predict thegain coefficient of a device with a nonuniformly distributedactive medium, such as optical fibers or waveguides, it isfirst necessary to measure the material cross sections and thenintegrate the spatial overlap between the population profilesand the optical fields to obtain the effective gain of thestructure.We now consider the Er3 41,3/2-4115/2transition as athree-level laser system. These two states are separated byan energy difference ( A E 0.8 eV) which is large comparedto kBT at or below room temperature. The population of the4115/2ground state can therefore be approximated by NlNo0733-8724/94 04,00 0 1994 IEEE-
804JOURNAL OF LIGHTWAVE TECHNOLOGY, VOL. 12, NO. 5, MAY 1994(the concentration of the active medium) when the material isnot pumped. The absorption cross sectioncan be obtained by measuring the absorption coefficienta ( v ) --y(v) of the material.A problem arises when determining the emission crosssection, since in general it is difficult to determine Nu andNl accurately when the material is being pumped. One optionfor measuring the cross sections is based on the Ladenburg-Fuchtbauer (L-F) relationship [ 111, [ 121 obtained fromthe basic Einstein transition equations [ 141andare the partition functions for these two manifolds. If we multiply the numerator and the denominator of (6) by the commontermexp [(EuL- h v ) / k T(which]is independent ofthe states U and Z), (6) becomes(4)Here n is the refractive index, Xab and A,, are the peakwavelengths of these two spectra, and gu and 91 are thedegeneracies of the upper and lower states, respectively. Ais the radiative transition rate of these two states, and is equalto 1 / (T is the spontaneous emission lifetime) when noother process (nonradiative transition, etc.) takes place. Theabsorption and emission spectra l a b ( X ) and lem(X) can bemeasured on an arbitrary linear scale, and the integration iscarried out over the whole spectrum of the transition.The L-F relationship is an approximation based on twoimportant assumptions: a) the material is isotropic, or atleast the spectra along all polarization directions are takento be identical [15]; and b) in the case where the states arecomprised of a manifold of levels, the transition rates (A,l)between any two levels (Fig. 1) are assumed to be equal[16]. As is shown below, neither of these two assumptions areappropriate for Er-doped LiNbO3. Indeed, it has been foundthat L-F equation is not applicable for E? in glass becauseof its temperature-dependent fluorescence lifetime [ 171. Toovercome the problems of the L-F theory for nonisotropictransitions between degenerate or near-degenerate states, McCumber [I31 derived a relation to determine the emissioncross section from the measured absorption cross section.Consider a transition between a specific level U in the uppermanifold and a specific level Z in the lower manifold. Theabsorption and emission cross sections for these two levelsare taken to be equal, C T ( Y I oul(vUl), )so long as themeasurements are made along a common optical propagationdirection and polarization. (This is equivalent to B12 BZ1,the Einstein transition coefficients for a single-level-to-singlelevel transition.) Assuming that the state population withineach manifold has a Boltzmann distribution profile (Fig. 1),the “effective” cross sections for the total transition betweenthese two manifolds can be described as a summation of allthe individual cross sections, with the Boltzmann populationof the initial state as a weighting factor [ 181g e m (U) cucl exp (-Eu/kBT)uul(v)Pupperwhere E isLthe energy separation between the lowest levelsof the two manifolds. We can see from Fig. 1 thathv - EUL E, - El.(11)Substituting (1 1) and (7) into (IO), and usingolu )(. flu1 (v),oem( U) becomesThe partition functions Plowerand Puppercan be determinedfrom (8) and (9) once the energy levels within these twomanifolds are known. The emission cross section can thenbe obtained from the measured absorption cross section using(12). It should be noted that this formula is an exact expressiononly for cross sections which are comprised of oul(v)with Sfunction lineshapes. If the lineshapes are homogeneously orinhomogeneously broadened, the exponential function in (12)will decrease the magnitude of the cross section at wavelengthsshorter than the peak wavelength of each transition, andincrease the magnitude at longer wavelengths. In our case,where the linewidth is less than 5 nm, worst case distortioncaused by the finite linewidth is calculated to be less than 5%,and it is effectively zero at the peak wavelengths (in whichwe are most interested).111. EXPERIMENTALRESULTSA bulk-doped LiNb03 sample (from Tianjin University,China) with an Er concentration of 1.0 mol% Er3 (1.9x 1020cm-3 f2% as confirmed by neutron activation analysismeasurement) was optically pumped from the ground stateto the 4F9/2manifold by a dye laser providing a pump wavelength of 655.7 nm. Fluorescence spectra of the 4113/2-4 I15/2transition were measured by a 0.5-m grating spectrometer with(6) a resolution of 2 A. The lifetime was measured to be 4.3 msusing a 1.48-pm laser diode pump. Absorption spectra of the
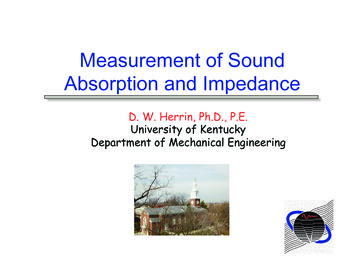
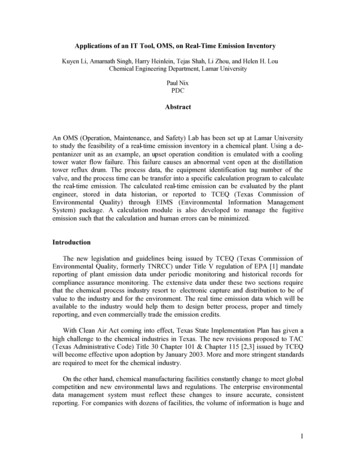
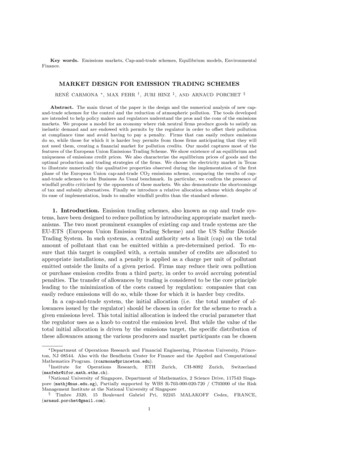
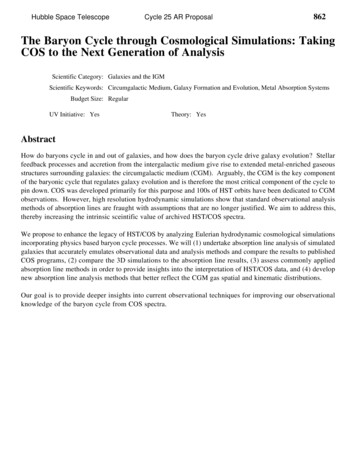
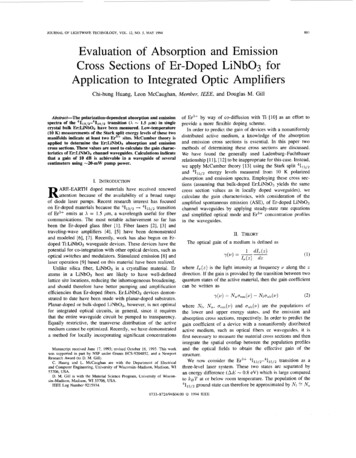
HUANG er al.: ABSORPTION AND EMISSION CROSS SECTIONS OF Er-DOPED LiNbO38057IElIEu O-Lexp(-E, / kJ) .-c.ca,c4 -a,3 -c2 -0v)c-a,2exp(-E,/ kJ)Fig. 1 . The Stark split energy level diagram of E? ions. There are 7states in the 4113/2 manifold and 8 states in the 4115/2 manifold. In thermalequilibrium the state population in each manifold is described by Boltzmanndistribution.3020IIi“1201L.-1-00 -0I1500I115501600Wavelength (nm)Fig. 3. Emission spectra (4113/2 4115/2 transition) of Er:LiNbOsmeasured at 10 K. The exact wavelengths of these peaks can be found inFig. 4.at least 11 peaks, more than the degeneracy (seven) of the4113p manifold. The Er atoms therefore occupy more than onesite in the LiNb03 crystal [19]. The absorption and emissiontransition lines corresponding to the assignments in Figs. 2 and3 are illustrated in Fig. 4. For comparison, the Er3 energylevels measured in other host materials as well as in L i m o 3are listed in Table I. Note that the measurements of LiNb03by Gabrielyan [22] were made at 77 K and used unpolarizedspectra. At this temperature the second lowest level of eachmanifold may be sufficiently populated to produce additionalpeaks, and the unpolarized thermally broadened spectra may-2leave some peaks unresolved.145015001550From Figs. 2 and 3 we can see that the L-F relationshipWavelength (nm)isnot appropriate for this system because the absorption andFig. 2. Absorptions pectra (411s/2 ‘11312 transition) of Er:LiNbOsmeasured at 10 K. The exact wavelengths of these peaks can be found in emission spectra exhibit different lineshapes along differentFig. 4.polarizations, meaning that the Er3 ions are in an anisotropicenvironment. In addition, from the direct 300 K absorptionmeasurements (Fig. 5, using (3)) we found that the peak crosssample were obtained using a monochromator with a broad- sections derived from L-F relation (4) are 3040% smallerband tungsten-halogen light source. Spectra were measured than the measured values as shown in Table 11.both at 300 and 10 K. The 10 K absorption and emissionMcCumber theory is used, instead, to obtain the emissionmeasurements are used to identify the energy levels of both cross section from the measured absorption cross section (Fig.manifolds. At extremely low temperature the population in 5). Assuming, for simplicity, equal populations of two sites,both manifolds essentially condenses to their respective lowest the partition function ratio is calculated to be Plower/Pupper energy states, so the peak wavelengths of the fluorescence 0.80 at 300 K from the energy levels in Table I. (Note that ifspectra represent the energy difference between the lowest we consider only one site, the partition function ratio changesstate of the 4113/2 manifold and the multiple states in the by less than 2%.) The derived emission cross sections at 3004115/2 manifold. Conversely, the 10 K absorption spectral K along the three polarization directions are shown in Fig. 6.peaks represent the energy difference between the lowest state The highest emission cross section value at 1531 nm is alongof the 4115/2 manifold and the multiple states in the 4113/2 the a polarization (2.25 x lo-’’ cm’), which means that a zmanifold.propagating waveguide on an 2-cut LiNb03 substrate shouldThe 10 K absorption and emission spectra along three have the largest optical gain. In this polarization the absorptiondifferent polarizations ( a , and T [15]) are shown in Figs. cross section (and therefore the pumping efficiency) at 14852 and 3. Eight Stark split energy levels are found in the nm has a relatively high value (0.5 X O - ’ cm’). Note that4115/2ground state as expected. (Three weak peaks not seen in the peak aem(v)values along a (TE) and T (TM) polarizationsFig. 3 were measured from the 4111/2-4115/2 emission spectra in a z-cut substrate is consistent with the lasing results at A and indicated in Fig. 4.) In Fig. 2, however, we observe 1563 and 1576 nm reported in [23].
806JOURNAL OF LIGHTWAVE TECHNOLOGY, VOL. 12, NO. 5, MAY 19944.0IIIII1550160016503.5 h:N3.0-2.5-0"b7Xvn 2.0brn1.5-1.0 - 00.5 - 040336 133018340.0 - 01450156AlA2A3A4 MA6 A7E2 E3 E4E6Fig. 5 . Absorption cross section (4115/2 4113/2 transition) of Er:LiNb03measured at 300 K from bulk-doped crystals with 1.0 mol% Er? (1.9x lo2' cmP3). Cross section values are claculated from (3).E8Fig. 4. The energy levels and the center wavelengths of the measuredabsorption and emission lines from Figs. 2 and 3.TABLE ISTARKENERGYLEVELS(in cm-') of 4i13/2-4 II5l2 MANIFOLDSOF Er? IONSMEASUREDIN DIFFERENTHOSTMATERIALS(Er203 1201, LaF3 1211, L i o 3 1221, and this paper.)Er2 0LiNbO3(77 2201411189666240254, 2802351078762(6524)0253, 272218, 231102, 11279, 916124(6529)0%5/25054902651598875384434003 7610000TABLE I1ABSORPTIONCROSSSECTIONPEAKVALUESAT 1531 nm OBTAINEDFROM MEASLTREMENTAND FROM LANDEN URG-FUCHTBAUERRELATIONSHIPALONGTHREEDIFFERENT POLARIZATIONS(The sample has an Er concentration of 1.9 x IOzoand measured fluorescence lifetime of 4.3 ms.)oabPolarizationKUCY1500Wavelength (nm)127610Energy (an"1IMeasured1.25 x O - O1.92 X O - * 2.75 x O - OL-F Equation0.88 X O - O1.14 xlO-*O1.66 x O - ODifference29.6%40.6%39.6%nonuniform active medium distribution, the gain equation canbe written as an overlap integralwhere Ps,p(z)is the total signal or pump power in thewaveguide's longitudinal direction z , and fS,*(z,y ) is theoptical intensity profile normalized over the waveguide crosssection area, S, wheres,f s , p ( x , Y)dY 1.To find the local gain coefficients for both signal and pumppower, we use the steady-state rate equation for a three-levellaser systemwhereTis the lifetime of the upper state, andare the local intensity of the signal and pump fields, respectively. (In this equation we ignore the stimulated emissioninduced by the pump field, and assume the pump state population relaxes to the upper state quickly compared to the lifetimeof the upper state.) At local equilibrium, we have dN,/dt 0.Since the active medium concentration is just the sum of theground state and upper state populations, NO NlNu,from (14) we get oab(vs)& [aern(vs) a a b ( s l & aab(up)&Nu aab(Vp)&IV. GAINCALCULATTONOF LiNbO3 CHANNELWAVEGUIDES andWe now calculate gain in a Ti-diffused waveguide which hasbeen nonuniformly co-doped with Er. For an optical signalpropagating in the z direction of a channel waveguide withaern(us)&Nl aab(up)& [gern(vs) f "ab(vs)]& No (15)No. (16)
HUANG er al.: ABSORPTION AND EMISSION CROSS SECTIONS OF Er-DOPED LiNbOaN-563.5I3.0-2.5-IIII807For a Ti-diffused waveguide, the fundamental mode of theoptical intensity profile f s , p ( zy), can be modeled [24] by theequation0725D1.5 -2.0Ewhere C1 is the normalization constant for fs,p. W, and DIare the half-width and the full-depth constants of the intensityprofile, respectively, which are determined from the diffusionconditions, material properties, and wavelength. Assuming aninfinite Er source, the surface in-diffused Er concentrationprofile can be written [25] as1.0 - 00.5 - 00.0-0III1I14501500155016001650Wavelength (nrn)Fig. 6. Derived emission cross section (41,3pEr:LiNb03 at 300 K. 4115/2 transition) ofThe signal gain is given bywhere WN is the width of the Er film before diffusion, andD N is the l/e depth after diffusion. C2 is scaled so thatthe maximum of No(x,y) is N m a x , which depends on thegem (vs)gab( V p )- g a b ( Us)diffusibility and solubility of Er, and is at ( 2 ,y) (0,O) forNO,gab(Vp)&f [gem(Vs)Cab(Vs)] fsurface in-diffusion. Using the values of f s , p ( x ,y), N o ( z ,y),(17) and the input signal and pump power at z 0, together withthe boundary conditions P&,(z 0) 0 and P,,&(z and the pump power loss coefficient isL ) 0 for ASE, we can numerically solve the coupleddifferentialequations (13) and (19) to find the signal gain, - Y ( V p ) nab(Vp)Nlpump power, and ASE at any distance z of the waveguide.gab(vp) gab(vp)gem(Vs)j&We use the following particular waveguide parameters forNO.[gern(vs)gab(vs)]&fgab(vp)&our calculations: signal wavelength 1.531 pm, pump wave(18) length 1.485 pm, WI 4 pm, and DI 4 pm for bothsignal and pump field, W , 4 pm, and 7 4.3 ms asNote that amplified spontaneous emission (ASE) is not consid- measured from our sample. The crystallographic orientation isered in the above derivation. At the gain region higher than 20 2-cut with z propagation, which has the best cross-sectiondB, however, ASE can significantly reduce the effective gain values as determined above. In the following graphs, thedue to saturation. To take ASE into account, we can write the abscissa is plotted as a (Length) x (Nmax)product. Fig. 7forward-traveling (P&E)and the backward-traveling (PiSE) shows the effect of diffusion depth DN on the small-signalASE signal as follows:gain with 20-mW pump power. We can see that uniformlydoped waveguides provide the largest differential gain overshort waveguide lengths. However, for a given amplifier lengthand pump power, maximizing the gain requires a carefulF m P o f s ( z ,Y ) C e m ( v s ) N u ( z , 2)) dx dy.choice of Er concentration profile. For longer lengths, a(19) reasonable active medium distribution is the one that matchesThe second term in the integrand is attributed to the sponta- the optical intensity profile of the pump [7]. The dashed line inneous emission power generated by the upper state population. Fig. 7 shows the gain of such a speculative Er profile. We alsom is the number of modes supported in the waveguide, which found that (calculations not shown), because the lateral andis 2 in a single-mode guide due to the two fundamental vertical diffusion coefficients are approximately the same, theTE and TM modes. PO( hvsAveg) is obtained from the initial Er strip width ( W N )has little effect on the gain wheneffective linewidth (AV,,) [6] of the emission lineshape to the diffusion depth (DN) is larger than the lateral optical modesimplify the required calculation for the whole spontaneous size (WI).emission spectrum. For a-polarization, AV,, 2.5 x 10l2 HzFig. 8 shows the dependence of gain on pump poweris calculated from Fig. 6 and used in our following calculation (using a diffused Er profile with D N 4 pm from [lo]).examples. Meanwhile, all the 1, terms in (14)-(18) must be Under these conditions the pump power required to reachreplaced by 01, IisE I,-,, to take the saturation effect transparency is 5 mW. A very reasonable gain performanceby ASE into account.can be achieved with 20-30-mW pump power. For example,r(vs) Nuuern(Vs) - N l g a b ( V s )&5 5 5 9
JOURNAL OF LIGHTWAVE TECHNOLOGY, VOL. 12, NO. 5 , MAY 199480830-Mode-match ength x A',,,,,1Pump 20mWUniform Er3.53.0( x 1 0 2 1 crn-2)Gain versus (Length) x (,Vmax) product at several Er diffusion depths (D.w). The following conditions are used: W1 4 pm, Di 4 pm,l & ' 4 pm, and pump power 20 mW. The dashed line has an Er profile the same as the pump optical field. The results for uniformly dopedsample are also shown for comparison.Fig. 7.4540I(III(I,III-IIPump power-40mW 30mW --5I.I.Iusing 20-mW pump power on a 3-cm-long waveguide withsurface Er concentration of 1.9 x lo2' cmP3 (1.O mol%) willproduce 10-dB gain for y-polarized light in an 2-cut substrate.For comparison, if we use z-polarized light in a z-cut substrate,the signal gain will be reduced to 6 dB. It should be noted thatthe gain coefficients are calculated for small input signal. Forthe previous conditions, an input signal power of 0.5 mWwill saturate the output gain to half of its original value. Notethat the gain saturation observed in Fig. 8 is due to ASE.product used in our example (5.7For the (Length) x (Nmax)x1020 cm-2), the ASE power is 7 pW for 20-mW pumppower.We can estimate the pumpoutput relation of lasers basedon this material by calculating the output ASE power with theboundary conditions that PLsE(z 0) R1PisE( z 0) andPisE(z L ) Rz PLsE(z L ) , where RI and R2 are themirror reflectances of the laser endfaces. Calculation shows.I.I.I20mW-10mW-,that a threshold pump power -10 mW and a slope efficiency23% can be obtained for an Er:LiNbOs laser with 95% : 95%endface reflectances and a single-path pumping scheme, using 5.7 x lo2' cm-2.(Length) x (Nmax)V. CONCLUSIONThe energy levels of the 4113/2 and 4115/2 manifoldsof single-crystal bulk Er:LiNbOs were obtained from lowtemperature spectroscopy. At least two Er3 sites appearto be present in the LiNbO3 host. Absorption and emissioncross sections along the various crystallographic axes weredetermined from McCumber theory. The peak emissioncross section value (2.25 x O - Ocm2) of Er:LiNbO3 ata polarization is about 3 times that of Er-doped fibers [17].Not unexpectedly, the linewidth (- 3 nm) is narrow comparedto the 10-nm width in silica fibers. With regard to pumpingefficiency, the absorption cross section (0.5 x O - Ocm2) atN
HUANG et al.: ABSORPTION AND EMISSION CROSS SECTIONS OF Er-DOPED LiNbOa1485 nm is 2.5 times larger than that in a silica-glass host.Model calculations based on these results predict IO-dB gaincan be achieved in a waveguide Ofcentimeters using20 mW of pumppowerandmoderateEr3 concentration. It.may therefore be possible to fabricate short, integrable, 1.5-pmoptical amplifiers and lasers for Ti:LiNb03 integrated optics.REFERENCESB, J , i ‘*Al reviewi , of the fabricationproperties of erbiumdoped fibers for optical amplifiers,” J. Lightwave Technol. , vol. 9, no.2, pp. 220-238, 1991.K. Iwatsuki, “Er-doped superfluorescent fiber laser pumped by 1.48 p mlaser diode,” Photon.Lett,,2, no, 4, pp, 237-238, 1990.L. Reekie, I. M. Jauncey, S . B. Poole, and D. N. Payne, “Diode-laserpumped operation of an Er3 -doped single-mode fibre laser,” Electron.Lett. , vol. 23, no. 20, pp. 1076-1077, 1987.E. Desurvire, J. R. Simpson, and P. C. Becker, “High-gain erbiumdoped traveling-wave fiber amplifier,” Oat. Lett. , vol. 12, no. 11, pp.888-890, 1987.T. Kashiwada, M. Shigenmatsu, T. Kougo, H. Kanamori, and Nishimura,“Erbium-doped fiber amplifier pumped at 1.48 p m with extremely highefficiency,” Photon. Technol. Lett. , vol. 3, no. 8, pp. 721-723, 1991.C. R. Giles and E. Desurvire, “Modeling erbium-doped fiber amplifiers,”J. Lightwave Technol., vol. 9, no. 2, pp. 271-283, 1991.J. R. Armitage, “Three-level fiber laser amplifier: A theoretical model,’’Appl. Opt., vol. 27, no. 23, pp. 48314836, 1988.S . Helmfrid, G. Arvidsson, J. Webjom, M. Linnarsson, and T. Pihl,“Stimulated emission in Er:Ti:LiNbOs channel waveguides close to 1.53pm transition,” Elecrron. Lett. , vol. 27, no. 11, pp. 913-914, 1991.R. Brinkmann, W. Sohler, and H. Suche, “Continuous-wave erbiumdiffused L i m o 3 waveguide laser,” Electron. Lett. , vol. 27, no. 5, pp.4 1 5 4 1 7 , 1991.D. M. Gill, A. Judy, L. McCaughan, and J. C. Wright. “Method for thelocal incorporation of Er into L i m o s guided wave optic devices by Tico-diffusion,” Appl. Phys. Lett., vol. 60, no. 9, pp. 1067-1069, 1992.J. N. Sandoe, P. H. Sarkies, and S. Parke, “Variation of Er3 crosssection for stimulated emission with glass composition,” J. Phys. D:Appl. Phys. , vol. 5, pp. 1788-1799, 1972.R. R. Jacobs and M. J. Weber, “Induced-emission cross sections forthe 4F3/2 - 4 113/2 transition in neodymium laser glasses,’’ J. QuantumElectron., pp. 846-847, 1975.D. E. McCumber, “Einstein relations connecting broadband emissionand absorption spectra,” Phys. Rev., vol. 136, no. 4A, pp. A956A957,1964.See, for example, J. T. Verdeyen,Laser Electronics, 2nd ed. EnglewoodCliffs, NJ: Prentice-Hall, 1989, ch. 7.See, for example, B. Henderson and G. F. Imbusch, Optical Spectroscopy of Inorganic Solids. Oxford, UK: Oxford Univ. Press, 1989,ch. 4.E. Desurvire, “Study of the complex atomic susceptibility of erbiumdoped fiber amplifiers,” J. Lightwave Technol., vol. 8, no. 10, pp.1517-1527, 1990.W. L. Barnes, R. I. Laming, E. J. Tarbox, and P. R. Morkel, “Absorptionand emission cross section of E? doped silica fibers,’’ J. QuantumElectron., vol. 27, no. 4,pp. 1004-1009, 1991.S . S . Payne, L. L. Chase, L. K. Smith, W. L. Kway, and W. F.Krupke, “Infrared cross-section measurements for crystals doped withE , Tm3 and Ho3 ,” J. Quantum Electron. , vol. 28, no. 11, pp.2619-2630, 1992.D. M. Gill, J. C. Wright, C. Huang, and L. McCaughan, manuscript inpreparation.8091201 J. B. Gruber, J. R. Henderson, M. Muramoto, K. Rajnak, and J. Conway,“Energy levels of single-crystal erbium oxide,” J. Chem. Phys., vol. 45,no. 2, pp. 477432, 1966.1211 W. F. Krupke and J. B. Gruber, “Absorption and fluorescence spectra ofE? ( 4 f ” ) in LaF3,” J . Chem. Phys., vol. 39, no. 4,pp. 1024-1029,1963.A, A, Kaminskii, and L, Li, “Absorption and lumi1221 v, T,nescence spectra and energy levels of Nd3 and Er3 ions in LiNbOscrystals,” Phys. Status Solidi A , vol. 3, pp. K37-K41, 1970.[23] P. Becker, R. Brinkmann, M. Dinand, W. Sohler, and H. Suche, “Erdiffused Ti:LiNbOs waveguide laser of 1536 and 1576 nm emissionwavelengths,” Appl. Phys. Lett., vol. 61, no. 11, pp. 1257-1259, 1992.[241 S. K. Korotky, W. J. Minford, L. L. BuhL M. D. Divino, and R.C. Alferness, “Mode size and method for estimating the propagationconstant of single-mode Ti:LiNbOs strip waveguides,” J. Quantumno. lo, pp. 1796-1801, 1991.I251 G. B. Hocker and W. K. Burns, “Mode dispersion in diffused channelwaveguides by the effective index method,” Appl. Opt., vol. 16, no. 1,pp. 113-118, 1977.Chi-hung Huang was born in Taipei, Taiwan, onMay 21, 1965. He received the B.S. degree inelectronics engineering from the National ChiaoTung University, Hsinchu, Taiwan, in 1987, andthe M.S. degree in electrical engineering from theUniversity of Wisconsin, Madison, in 1992.He is currently working toward the Ph.D. degreeat the University of Wisconsin, Madison. His research interests include the applications of nonlinearproperties in integrated optics and fiber communications.-Leon McCaughan (M’84) received the M.S. degreein physics and the Ph.D. degree in biophysics fromthe University of Michigan, Ann Arbor.From 1979 to 1980, he held a postdoctoral appointment with Brookhaven National Laboratory.From 1980 to 1984, he was with Bell Laboratories,where he was engaged in the research and development of integrated optic devices. He is currentlya Professor in the Department of Electrical andComputer Engineering at the University of Wisconsin, Madison. His research includes guided waveintegrated optics, nonlinc:ar optics, and fiber optics.Douglas M. Gill was born in Syracuse, NY, onSeptember 5, 1962. He received the B.S. degreein physics from the State University of New York,College at Buffalo, in 1987, and the M.S. degree inmaterial science from the University of WisconsinMadison, in 1989.Currently, he is engaged in research towardsthe Ph.D. degree at the University of WisconsinMadison. His current research interests include thestudy of integrated optics with localized gain. Hewas the recipient of an OSA Newport fellowship.
D. M. Gill is with the Material Science Program, University of Wiscon- sin-Madison, Madison, WI 53706, USA. IEEE Log Number 9215934. Member, of Er3 Optic Amplifiers ZEEE, and Douglas M. Gill by way of co-diffusion with Ti [lo] as an effort to provide a more flexible doping scheme.