Transcription
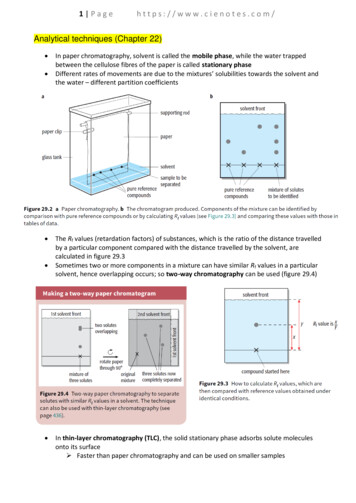
1 Pagehttps://www.cienotes.com/Analytical techniques (Chapter 22) In paper chromatography, solvent is called the mobile phase, while the water trappedbetween the cellulose fibres of the paper is called stationary phaseDifferent rates of movements are due to the mixtures’ solubilities towards the solvent andthe water – different partition coefficientsThe Rf values (retardation factors) of substances, which is the ratio of the distance travelledby a particular component compared with the distance travelled by the solvent, arecalculated in figure 29.3Sometimes two or more components in a mixture can have similar Rf values in a particularsolvent, hence overlapping occurs; so two-way chromatography can be used (figure 29.4)In thin-layer chromatography (TLC), the solid stationary phase adsorbs solute moleculesonto its surface Faster than paper chromatography and can be used on smaller samples
2 Pagehttps://www.cienotes.com/ Polar molecules have greater attraction towards the stationary phase (adsorbedmore strongly onto its surface); therefore travels more slowly resulting toseparations; identified by calculating the Rf values Gas-liquid chromatography (GLC) uses partitioning to separate and identify thecomponents in a mixture; a gaseous sample enters the column, where the sample is movedthrough an inert gas carrier; method used for gases, liquids and volatile solids (vapourform) The detector detects the retention time (time taken for component to pass throughthe column); the area under each peak corresponds to the amount of soluteemerging from the columnThe chromatogram obtained using the same carrier gas, flow rate, stationary phase andtemperatureFigure 29.11 shows a chromatogram obtained using GLC:Determination of percentage composition of a mixture by GLC: The composition peaks are identified The areas under each peak recorded is proportional to the amount of soluteemerging from the column The area of each is measured by (as they are roughly triangular):
3 Pagehttps://www.cienotes.com/ The percentage composition given by: Low-resolution proton NMR spectrum: Shows a single peak for each non-equivalent hydrogen atom The area under each peak tells us the relative number of equivalent 1H atomsresponsible for the particular chemical shift Largest peak: –CH3 hydrogen atoms; middle peak: –CH2 hydrogen atoms; smallestpeak: –OH hydrogen atoms The type of H atom present can be checked against tables of data (ppm value)High-resolution proton NMR spectrum: The splitting pattern of a peak depends on the number of hydrogen atoms on theadjacent carbon atom(s); using the n 1 rule, where n is the number of 1H atoms onthe adjacent carbon atom E.g. ethanol (CH3CH2OH) The CH3 peak is split into three because there are two 1H atoms on the adjacent CH2group; n 1 3 (triplet)
4 Pagehttps://www.cienotes.com/ The CH2 peak is split into four as there are three 1H atoms on the adjacent CH3group; n 1 4 (quartet) The –OH signal apeears as a single peak, as the –OH proton excahngws rapidly withprotons in water present: Exchanges also occur with amines and amides which contain –NH– groupThese peaks will disappear from the spectra by the addition of deuteriumoxide, D2O, to the sample Exchanges reversibly with the protons in the –OH or –NH– groups D2O atoms do not absorb in the same region of the electromagneticspectrum as protons, hence the disappearanceCarbon-13 NMR spectroscopy: Analysis of carbon-13 NMR spectra is similar to that of proton NMR, looking tomatch different chemical shifts to characteristic molecular environments Signals produced are discrete vertical lines on the spectra (no splitting patterns) Heights of the lines are not proportional to the number of equivalent 13C atomspresent The solvent used to prepare the samples for 13C NMR analysis is CDCl3 E.g. propanone (CH3)2CO
5 Pagehttps://www.cienotes.com/ E.g. propanone (CH3)2CO Tetramethylsilane, TMS, as the standard for chemical shift measurements at 0 ppm in bothproton NMR and 13C NMRDeuterated solvents, e.g. CDCl3, when obtaining an NMR spectrum as it will not interferewith the spectrum, no peaks produced from the solventMass spectroscopy: The peak at the highest mass-to-charge ratio is caused by the molecular ion (M ),giving the relative molecular mass of the sample Very small peak beyond the molecular ion peak at a mass of [M 1] caused by the1.10% carbon-13 present in any organic compound, hence number of carbon atoms(n) in a molecule is given by:
6 Pagehttps://www.cienotes.com/ A sample containing chlorine or bromine atoms will form [M 2] peak which isbeyond the molecular ion peak, due to their isotopes Imagine a sample of chloromethane, CH3Cl; molecules of CH335Cl (75%) and molecules ofCH337Cl (25%). The molecular ion will be CH335Cl , and two units beyond that on the massspectrum will be the peak for CH337Cl The peak for CH337Cl will be one-third the height of the molecular ion – the [M 2] peak In the mass spectrum of bromomethane, CH3Br, we will have two molecular ion peaks ofapproximately the same height – one for CH379Br and the other for CH381Br – the [M 2]peak If the [M 2] peak is one-third the height of the M peak, this suggests the presenceof one chlorine atom per molecule If the [M 2] peak is the same as the height of the M peak, this suggests thepresence of one bromine atom per molecule
7 Pagehttps://www.cienotes.com/
1 P a g e h t t p s : / / w w w . c i e n o t e s . c o m / Analytical techniques (Chapter 22) In paper chromatography, solvent is called the mobile phase, while the water trapped between the cellulose fibres of the paper is called stationary phase Different rates of movements are