Transcription
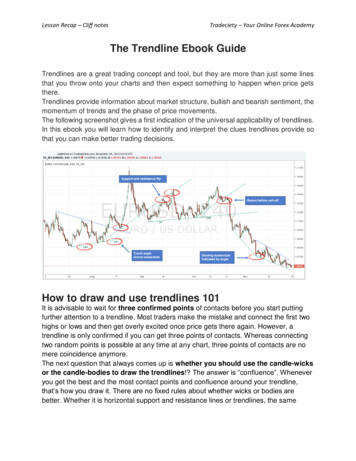
Lesson Recap – Cliff notesTradeciety – Your Online Forex AcademyThe Trendline Ebook GuideTrendlines are a great trading concept and tool, but they are more than just some linesthat you throw onto your charts and then expect something to happen when price getsthere.Trendlines provide information about market structure, bullish and bearish sentiment, themomentum of trends and the phase of price movements.The following screenshot gives a first indication of the universal applicability of trendlines.In this ebook you will learn how to identify and interpret the clues trendlines provide sothat you can make better trading decisions.How to draw and use trendlines 101It is advisable to wait for three confirmed points of contacts before you start puttingfurther attention to a trendline. Most traders make the mistake and connect the first twohighs or lows and then get overly excited once price gets there again. However, atrendline is only confirmed if you can get three points of contacts. Whereas connectingtwo random points is possible at any time at any chart, three points of contacts are nomere coincidence anymore.The next question that always comes up is whether you should use the candle-wicksor the candle-bodies to draw the trendlines!? The answer is “confluence”. Wheneveryou get the best and the most contact points and confluence around your trendline,that’s how you draw it. There are no fixed rules about whether wicks or bodies arebetter. Whether it is horizontal support and resistance lines or trendlines, the same
Lesson Recap – Cliff notesTradeciety – Your Online Forex Academyprinciples apply; you should never trade off of single lines on your charts. Price alwaysmoves in zones.The screenshot below shows two trendlines, the upper one only connected the first twohighs but it missed all the following price action. The lower trendline was drawn afterthree points of contacts and does not only focus on the wicks – it captured price actionmuch clearer.Upper and lower trendlinesThe next question that comes up is whether you draw trendlines connecting the lows orthe highs. The answer is very straight forward:There is no right or wrong and it does not really matter whether you use the highs or thelows. The only exception is spotting trend breaks; to spot trend breaks, you have toconnect the highs in a downtrend and the lows in an uptrend.The screenshot below shows that during downtrends, we used the highs to drawtrendlines and the lows during uptrends. However, in later examples we will switch to adifferent approach – it always depends on what you want to analyze and how YOU feelmost comfortable. As with all trading indicators and tools, they are not meant to providesignals, but to help you analyze market data and price action.
Lesson Recap – Cliff notesTradeciety – Your Online Forex AcademyThe slope and angles of trendlines – trend strengthThe slope – or the angle – of trendlines immediately tells you how strong a trend is.A large angle on a lower trendline in an uptrend means that the lows are risingsignificantly fast and that the momentum is high. The screenshot below shows anuptrend with steadily increasing angles of trendlines. The trend is gaining momentumand the trendlines visualize it perfectly.
Lesson Recap – Cliff notesTradeciety – Your Online Forex AcademyThe next screenshot shows the opposite; a downtrend with multiple trendlines that showdecreasing angles. Obviously, the trend is losing momentum.The break of a market structureNow we can slowly start putting it all together to make more sense of the charts. Thescreenshot below shows a market with several confirmed trendlines – all have morethan 3 points of contacts as indicated by the green checkmarks.
Lesson Recap – Cliff notesTradeciety – Your Online Forex AcademyA trend is a market structure (other market structures are ranges or consolidations). Thetrendline confirms the trend market structure through validating higher lows. A break ofa market structure is a break of a trendline. The screenshot below shows the alwaysrepeating market cycles:Trend – trendline support – break of market structure – new trend – new trendline– break of resistanceThe next screenshot shows a similar market behavior. The large red arrows show thelonger-term trends. However, in the meantime, you can observe the short-term cyclesrepeating themselves over and over again; trend – break – new trend Trendlines alone may not be sufficient as a stand-alone trading system, but they are agreat addition in your arsenal and trendlines can help you interpret market structure ona whole new level.The trendline-flipWhen talking about trendlines we can’t miss the support-and-resistance-flip. This is apattern which you can observe frequently and it is worth paying attention to. Trading isall about building confluence and stacking the odds in your favor and the trendline-flip isa great tool to build additional confluence.The screenshot below shows when support turned into resistance and vice versa. Thetrendline flip is ideal for conservative traders who do not want to trade the initialbreakout of a trendline, but are looking for additional confirmation.
Lesson Recap – Cliff notesTradeciety – Your Online Forex AcademyHow to use trendlines – putting it all togetherTrendlines are a universal trading tool and they offer different information. You can usetrendlines in many different ways and we have summarized the most important factsabout trendlines: Always wait for 3 points of contacts to draw a valid trendline It does not matter if you use candle bodies or wicks to draw trendlines When drawing trendlines, there is no right or wrong. It has to make sense to you The angle of a trendline shows how fast a trend is moving Multiple trendlines in a trend provide information about slowing or gainingmomentum The market cycle of: trend – break – new trend can be observed usingtrendlines
Lesson Recap – Cliff notes Tradeciety – Your Online Forex Academy The Trendline Ebook Guide Trendlines are a great trading concept and tool, but they are more than just some lines that you throw onto your charts and then expect something to happen when price gets there. Trendlines provide information about market structure, bullish and bearish sentiment, the momentum of trends and the .