Transcription
Using Augmented Holographic UIs toCommunicate Automation Reliability in PartiallyAutomated DrivingMahdi EbnaliShiva PourfalatounUniversity at BuffaloColorado State University,Amherst, NY 14260, USAFort Collins, COmahdiebn@buffalo.edushivapf@colostate.eduRazieh FathiSanaz MotamediRochester Institute ofUniversity of Florida,Technology, Rochester, NYGainesville, FLrxfvcs@rit.edusmotamedi@ufl.eduRichard LambNeurocognition ScienceLaboratory, East CarolinaUniversity, Greenville, NClambr19@ecu.eduAbstractWorkshop proceedings Automation Experience across DomainsIn conjunction with CHI'20, April 26th, 2020, Honolulu, HI, USACopyright 2020 for this paper by its authors. Use permitted underCreative Commons License Attribution 4.0 International (CC BY 4.0).Website: rs are assumed to actively supervise the road inpartially automated driving, but a growing body ofresearch shows that they become more complacent insystem operation and fail to continuously monitor theroad, which results in mode confusion. Lack oftransparent communication of automation mode and itslevel of reliability has been discussed as a mainunderlying cause of these challenges. Our study
assessed a concept of augmented reality lane marking(AR-LM) to communicate the status of automation andits level of reliability. In a partially automated drivingsimulator study, participants’ glance behavior, takeovertime in critical events, hazard detection, andautomation perception were collected in two groups(control and AR-LM). The results indicated an effect ofthe AR-LM UI on takeover time, gaze time on the road,and automation trust. Our findings suggest that the ARLM concept can potentially assist drivers in maintainingtheir visual attention to the road in low-reliability andfailure conditions. However, this UI concept may alsocause lower hazard detection when automation isrunning in high-reliability mode.Author KeywordsAugmented reality; Partial driving automation; Level ofreliability; User experience; Gaze behavior; Trust;Takeover.CSS Concepts Human-centered computing Human computerinteraction (HCI) Interface Paradigms;Mixed/augmented realityIntroductionTechnological advancement over the past years has ledto significant growth of driver assistance systems andthe emergence of autonomous vehicles. It is predictedthat full driving automation will be commonplace on theroads in the future [1]. However, nowadays, automateddriving continues to be challenged by technicalconstraints [2], ethical issues [3], and human factorsconsiderations [4]. While vehicle automationtechnology will continue to mature along with advancesin computer vision and artificial intelligence, it is harderto overcome challenges in user interaction with suchsophisticated systems, as unique challenges arise withincreased automation. In particular, the reliance on thehuman driver to supervise the automation and tomanually control the car in some limited drivingmodes—as is the case in many commercially availableautomated vehicles—have been associated with issuesrelated to driver states, such as erratic workload, lossof situation awareness (SA), vigilance decrements andautomation complacencyHighly automated driving is expected to becommercially available in the market in the near future;however, vehicles equipped with partial drivingautomation are available in the current market, and agrowing body of studies investigate opportunities toimprove this system. Based on the definition providedby SAE, partially automated vehicles are equipped withspeed controlling and lane-keeping functions butrequires that the driver continuously monitors the roadand takes over the vehicle control when it surpasses itsoperational design domain.Although drivers are assumed to actively supervise theroad in partially automated driving mode, they showedto become more complacent in system operation andfailed to monitor the system continuously[5] and as aresult, they maintained lower situational awareness [6].Lower situation awareness in partial driving automationhas been associated with mode confusion, where thedriver doesn’t understand what mode the vehicle isdriving[7]. Beyond the unpleasant automated drivingexperience when mode confusion occurs, the modeconfusion also has been reflected in previous literatureas a primary reason for incidents and accidents invarious domains of human-automation interaction[8].
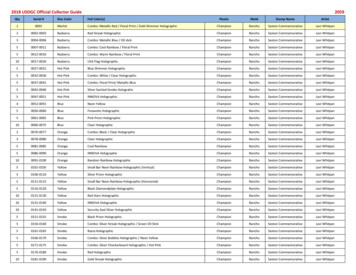
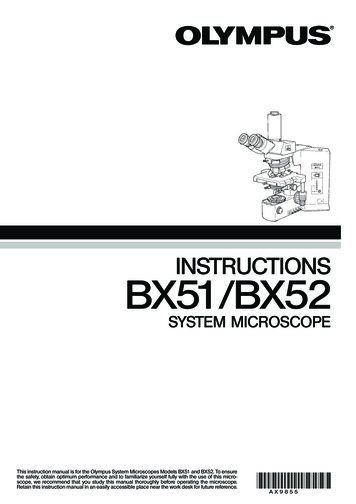
Several reasons have been discussed in the currentbody of literature as the potential underlying factors ofmode confusion. Reduction of driving workload inautomated driving on one hand, and having access toseveral electronic devices and displays, on the otherhand, encourage the driver to spend more time out ofthe driving loop and stay engaged in non-drivingrelated secondary tasks (NDSTs). This insufficientmonitoring behavior could lead to mode confusion.Moreover, drivers in such situations may not be wellprepared to regain vehicle control when a suddenchange on the road ahead (e.g., missed lane markingor a cut-in vehicle) has prompted an emergencytakeover request.Figure 1: Driving simulator andfour AOIs specified for eyemovement dataFigure 2: Tobii Eye TrackingGlasses 2Misunderstanding of the internal user interfaces (UIs)has been mentioned as another constraint in partiallyautomated driving [7]. Most of the current partiallyautomated vehicles in the market use visual warningand or a combination of visual and auditory feedback tocommunicate automation modes. However, sometimesthese modalities are not straightforward enough tocommunicate the status of automation, or they may notbe salient enough to capture the driver's attention [7].Moreover, previous studies have reported thepotentially confusing or startling effects of these typesof warnings, especially when warnings are notpresented to the driver in a timely manner[9].Furthermore, most of the current UIs are binary andwill only present whether the automation is on or off.Lack of transparent communication regarding the levelof reliability of the automation may mislead the driverand result in the occurrence of mode confusion. Forexample, the drive may expect that the automationreliably operates the vehicle in a particular segment ofthe road (e.g., on a high curvature), but due totechnical limitations, the automation may operate thecar with lower certainty.Lastly, partial driving automation is mostly designed ina way that the driver’s inputs to the steering wheel andpedals deactivate the automation. Although this featurehelps users to take over the vehicle control easily,inadvertent torque inputs may also deactivate theautomation. In this case, the driver may not realize thistransition and fail to regain control or re-activate theautomation properly.Regarding the challenges mentioned above, ensuringthat drivers have a clear understanding of theautomation mode and remain attentive during partiallyautomated driving is one of the most importantresearch topics which need further investigation.Designing appropriate UIs to communicate automationmode and its reliability could avoid mode confusion,encourage drivers to monitor the road continuously,and safely take over the vehicle control when it isrequired. Augmented reality-based UIs could be apotential solution to intuitively visualize the statue ofautomation, which, compared to the conventional visualUIs, requires less visual attention shifting from the roadto the instrument cluster[10]. Moreover, the level ofreliability of the automation could be projected to thewindshield to provide the driver with a moretransparent view of automation status. Regarding thesepotential premises, the objectives of the currentresearch were to explore the effects of the AugmentedReality-based Lane Marking (AR-LM) concept on thedriver’s glance behavior, takeover time in criticalevents, hazard detection, and automation perception
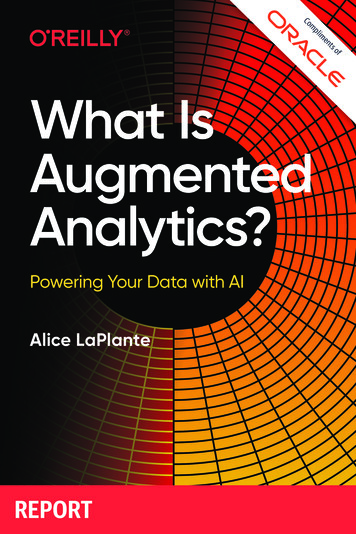
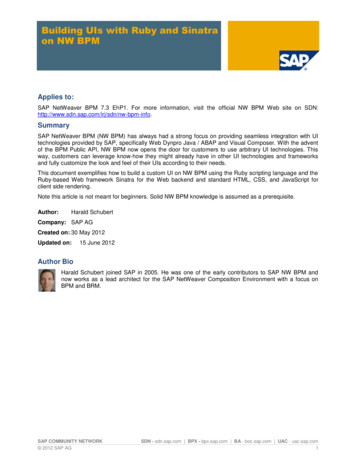
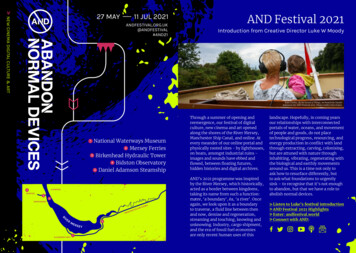
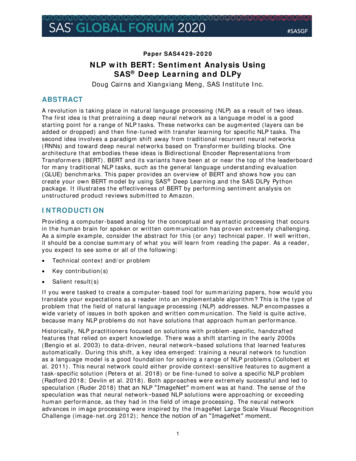
during the level 2 automated driving in a simulatedenvironment.MethodsFigure 3: The concept of AR-LMto communicate the statue ofautomation and its level ofreliability in three conditions: a)high reliability, b) low reliability,c) failureMethodA total of 15 subjects, 7 males and 8 females, betweenthe ages of 21 to 34 (M 26.02, SD 4.55)participated in the study. Participants were recruitedusing online postings on public forums. All participantspossessed a valid driver’s license and had a normal orcorrected-to-normal vision (determined through nearand far visual acuity and contrast sensitivity). Allparticipants had little or no automated drivingexperience. At the beginning of each experimentalcondition, all participants received the same pre-writtentextual instruction about how to use the simulator.ApparatusThis experiment was performed using a fixed-basedsimulator, which was designed in the Unity 3D andoperated on Dell Optiplex 7010 (Intel Quad-Core i73470 3.2GHz, 16GB RAM) workstation running Windows10. Two widescreen displays showed the visualsimulation imagery, rendered at 60 Hz (Figure 1). Thesimulator was able to provide two driving modes:partial driving automation and manual driving. Basedon the features outlined for level 2 automation in SAEJ2016, the automated mode supported simultaneouslongitudinal and lateral control. Participants were ableto engage and disengage automaton by pressing thesame button located on the right side of the steeringwheel. Disengagement was also possible throughpressing the brake ( 10% of braking length) orturning the steering wheel more than ( 7 degrees). ATobii Eye Tracking Glasses 2 (Figure 2) also recordedparticipants’ glance behavior, and the Tobii Labsoftware was used to analyze the data. To make eyemovement data easier to interpret, we specified fourarea-of-interests (AOIs) including road scenery, phonedisplay, instrument cluster, and hazard perceptionareas (Figure 1).UIsFigure 3 shows the concept of AR-LM to communicatethe statue of automation and its level of reliability inthree conditions: a) high-reliability, b) low-reliability,and c) failure. Participants in the control group wereinformed about automation mode in high-reliabilityconditions with a green color UI on the instrumentcluster. In addition to this UI, participants in the AR-LMgroup were also provided with a holographic ARprojecting a green bar on the forward road scenery(Figure 3-a). In low-reliability modes, the visual UI onthe instrument cluster remained in green color in bothgroups; however, participants in the AR-LM group wereprovided with a holographic AR projecting a yellow baron the forward road scenery (Figure 3-b). Once thevehicle passed the high curvature section of the road,the holographic yellow bar turned to a holographicgreen bar indicating the high-reliability mode. In failuremodes (missing lane marking and obstacle ahead), anauditory feedback was provided for both groups in theform of sequences of three tonal beeps (each beep at800 Hz and lasting 0.1s) with a time budget of 10seconds. The visual UI located on the instrumentcluster also turned to red. In the AR-LM group, besidesthese auditory and visual feedbacks, participants wereprovided with a holographic AR projecting a red bar onthe forward road scenery (Figure 3-c).
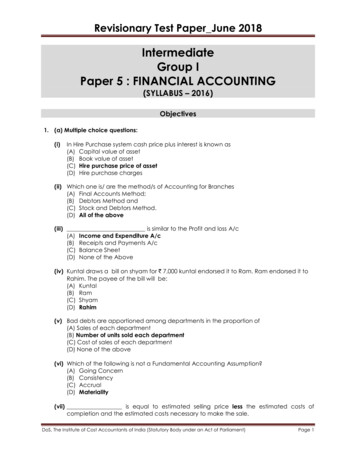
Design of experimentThe driving test consisted of 15 miles long (10 minutesmanual driving and 20 minutes automated driving) on ahighway was simulated while participants drove in apartial driving automation mode. As shown in Figure 4,automated driving scenarios included three types ofautomation modes: high-reliability in straight or lowcurvature sections of the road, low-reliability in highcurvature section of the road, and failure when the lanemarking has faded out or an object blocked the forwardroad. Each participant experienced two low-reliabilitymodes and two failure modes. In the failure modes,participants were responsible to take over the vehiclecontrol in a timely manner. The rest of the automateddriving session was in high-reliability mode. Whiledriving in automated mode, participants in both groupswere asked to watch a video of the Our Planet series onNetflix, which was displayed on the phone. They wererequested to watch this video in a self-paced manner.Figure 4: Driving scenariosincluding three types ofautomation modes- highreliability: straight road or lowcurvature, low reliability: highcurvature, and failure: lanemarking has faded out orobstacle aheadIndependent variablesAs the between-subject factor, visualization ofautomation status (with and without AR information)was an independent variable; and takeover time, gazetime, hazard detection, automation perception weredependent variables. Automation perception also wasmeasured after the driving tests using an 11-itemquestionnaire regarding automation trust, automatonacceptability, and ease of use in a scale 1 (I stronglydisagree) to 7 (I strongly agree).ResultsTakeover timeThe average takeover time of both failure events forthe AR-LM group (Mean 2.1 s, SD 0.8 s) was lessthan the takeover time for the control group (Mean 2.9 s, SD 0.95 s, p 0.05). The result of pairwisecomparisons for the type of takeover showed nosignificant difference in takeover time betweenobstacle-ahead events in the AR-LM group (Mean 2.4s, SD 0.88 s) and control group (Mean 2.1 s, SD 0.83 s, p 0.09). However, takeover time of missinglane marking events in the control group (Mean 3.1 s,SD 1.01 s) was significantly longer than this measurein the AR-LM group (Mean 1.9 s, SD 0.71 s, p 0.05).Gaze behaviorGaze time on three AOIs (road scenery, instrumentcluster, and phone display) in three modes ofautomation (high-reliability, low-reliability, and failure)were investigated. In general, compared to the controlgroup, the AR-LM concept resulted in significantlyshorter gaze time on the road scenery (control: M 919.6 s; SD 32.5 s; AR: M 869.2 s; SD 28.1 s,p 0.01), the instrument cluster (control: M 52.9s;SD 17 .4 s; AR: M 23 s; SD 8.5 s, p 0.01), andlonger gaze time on the phone display (control: M 207.5s; SD 19 s; AR: M 235.8 s; SD 15 s,p 0.01).Moreover, as shown in Figure 5, investigating averagegaze time for each automation mode revealedsignificantly longer gaze time on the road scenery inthe low-reliability mode (control: Mean 82.8 s, SD 20.1 s, AR: Mean 112.3 s, SD 19.5 s, p 0.05) andfailure mode (control: Mean 18.4 s, SD 5.9 s, AR-LM:Mean 34.6 s, SD 8.4 s, p 0.05) when participantswere provided with AR-LM support. Compared to thecontrol group, participants in the AR-LM group showedlonger gaze time on the phone display when the vehiclewas running in straight/low curvature roads (highreliability mode). There was no significant difference in
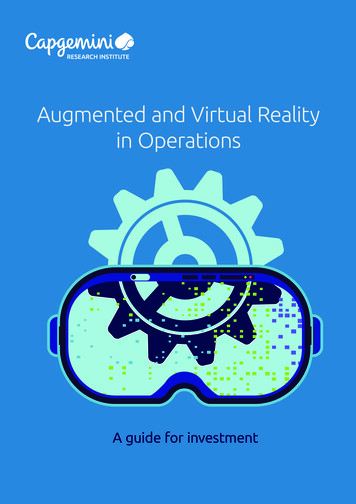
gaze times on the instrument cluster in low-reliabilitymode between two groups. Participants in both groupsalso did not show different gaze behavior on the phonedisplay in failure modes.DiscussionIn addition, compared to the control group, gaze datarevealed that participants in the AR-LM group looked atthe phone display for a longer time. Considering thisfinding and trust data, it seems AR information led tohigher automation trust, and as a result, participantspreferred to spend more time engaged in watching thevideo. To have a deeper understanding of gazebehavior, we also analyzed the gaze time dataseparated for each automation mode. Interestingly, theresults showed that when the level of reliabilitydecreased (in high curvature section of the road), theAR-LM UI caused participants looked at the roadscenery for a longer time. The reason for this behaviormight be that the yellow holographic AR conceptcaptured participants’ visual attention and then theyinterpreted an association between this change and thehigh curvature section of the road. Similar benefit of ARinformation was observed in failure events. When theparticipants were provided with a red holographic AR,they spent longer time looking at the road scenery andless time on the phone display. Although these findingscould be considered as positive effects of AR-LM incommunicating the level of uncertainty of partialdriving automation, the application of AR-LM should beconsidered with the potential costs of longerengagement in secondary tasks when automation isrunning in high-reliability mode.Our findings suggest that the holographic AR concept ofthe lane marking had a significant effect on takeovertime. On average, participants in the AR-LM groupstarted to take over the vehicle control 0.8 secondsearlier than those in the control group. It seems ARinformation regarding automation mode and its level ofThe results also showed a shorter average gaze time onthe hazard perception AOI in the AR-LM group. Twoparticipants in this group also did not look at the hazardperception AOI at all. We only considered one hazardperception event which was appeared when theNo significant difference was observed in gaze timebetween two types of failure events (missing lanemarking and obstacle ahead) in the AR-LM group;however, participants in the control group looked at theroad scenery for longer time in the obstacle aheadevent (Mean 9.2 s, SD 2.1 s), compared to themissing lane markings event (Mean 6.3 s, SD 3.1 s,p 0.05). Regarding hazard detection event, the resultsshowed a shorter fixation time in the hazard detectionAOI when participants were provided with AR-LMsupport (control group: M 7.2 s, SD 1.5 s; AR-LMgroup: Mean 3.1 s, SD .93 s, p 0.01).Automation PerceptionThe results of the automation perception questionnaire(Figure 6) showed a significant difference in automationtrust between AR-LM and control groups (p 0.026).Participants also reported slightly higher ease of use forAR intervention, though the difference was onlymarginally significant (p 0.054). Automationacceptability in the AR-LM group was not significantlydifferent from participants in the control group.(p 0.9).Figure 5: Gaze time on roadscenery, instrument cluster, andphone display AOIsreliability helped participants to react faster in takeoverevents.
Figure 6: Results of automationperception questionnaireautomation was running in high-reliability mode (greenholographic AR concept). Two possible reasons mayexplain this finding. First, the AR-LM UI over-captureddrivers’ visual attention to a particular part of the roadscenery. In this case, caution must be exercised in theapplication of AR-based UIs to avoid potentialdistracting effects of AR information. As the secondreason, higher trust achieved in the AR-LM groupcaused participants to stay for a longer time engaged insecondary tasks. In this case, researchers anddesigners need to consider the costs associated without-of-the-loop performance problems. This potentialcomplacency could reduce drivers’ situationalawareness and impair driving performance especially incritical transition tasks [6].The results partially support our assumption regardingthe effectiveness of the AR-LM concept on automationperception. Compared to the control group, participantswho received AR information reported higherautomation trust after the driving test. This finding issupported by a recent experimental study[10] and alsoa theoretical link between trust of in-vehicle technologyand warning system reliability described by [11].Reliability information provided in the AR-LM conceptmay help participants to understand the system betterand build higher trust in partial diving automation. Inaddition, more transparent visualization of automationmode and its level of reliability supported in ARinformation has been associated with a lower likelihoodof mode confusion and ultimately low trust [12].Ease of use was also marginally higher in the AR-LMgroup. Participants who received AR information weremore likely to find the system easier to use. Previousstudies evaluated ease of use as a component ofacceptance [10] and reported higher ease of use whenautomation modes were presented using AR concepts.Our results, however, did not show a meaningfuldifference in acceptance data between the control andAR-LM groups. This finding is confusing because wefound higher trust and ease of use in the AR-LM group,and according to the Technology Acceptance Model(TAM) [13], it seems reasonable to expect higheracceptance in this group. One explanation for this resultis that although trust and acceptance are interrelatedconcepts; they do not necessarily follow the samepattern[14]. Several sources of variability such asindividual differences in prior experiences, intention touse technology, and perceived attractiveness maycontribute to this result. Attractiveness and intent aretwo other components of TAM, which we did notmeasure in this study. Considering the importance ofacceptance in technology usage, more studies arerequired to investigate underlying components oftechnology acceptance and its association with trust.ConclusionThis paper has reported on a driving simulator studyconducted with 15 participants to investigate whether aholographic AR prototype could be used tocommunicate automation mode and its level ofreliability. The results indicate that participants whowere provided with AR-LM UIs looked longer at theroad scenery in low reliability and failure situations.Moreover, they were better prepared to switch tomanual control than participants who did not receiveAR information. However, AR-LM led to less roadmonitoring behavior when automation was running inhigh-reliability mode. Moreover, participants in the ARLM group were more likely to miss hazard detectionevents. In our future work, we will investigate these
limitations with a larger sample in more critical andnon-critical situations.References9.1.2.3.4.5.6.7.8.Walker, G.H. and N.A. Stanton, Humanfactors in automotive engineering andtechnology. 2017: CRC Press.Litman, T., Autonomous vehicleimplementation predictions. 2017: VictoriaTransport Policy Institute Victoria, Canada.Faulhaber, A.K., et al., Human decisions inmoral dilemmas are largely described byutilitarianism: Virtual car driving studyprovides guidelines for autonomous drivingvehicles. Science and engineering ethics,2018: p. 1-20.Casner, S.M., E.L. Hutchins, and D. Norman,The challenges of partially automateddriving. Communications of the ACM, 2016.59(5): p. 70-77.Baee, S., et al., EyeCar: Modeling the VisualAttention Allocation of Drivers in SemiAutonomous Vehicles. arXiv preprintarXiv:1912.07773, 2019.Eriksson, A. and N.A. Stanton, Takeovertime in highly automated vehicles:noncritical transitions to and from manualcontrol. Human factors, 2017. 59(4): p.689-705.Banks, V.A., et al., Is partially automateddriving a bad idea? Observations from anon-road study. Applied ergonomics, 2018.68: p. 138-145.Saffarian, M., J.C. de Winter, and R. Happee.Automated driving: human-factors issues10.11.12.13.14.and design solutions. in Proceedings of thehuman factors and ergonomics societyannual meeting. 2012. Sage PublicationsSage CA: Los Angeles, CA.Abe, G. and J. Richardson, Alarm timing,trust and driver expectation for forwardcollision warning systems. Appliedergonomics, 2006. 37(5): p. 577-586.von Sawitzky, T., et al. Increasing trust infully automated driving: route indication onan augmented reality head-up display. inProceedings of the 8th ACM InternationalSymposium on Pervasive Displays. 2019.Lee, J.D. and K.A. See, Trust in automation:Designing for appropriate reliance. Humanfactors, 2004. 46(1): p. 50-80.Parasuraman, R., T.B. Sheridan, and C.D.Wickens, A model for types and levels ofhuman interaction with automation. IEEETransactions on systems, man, andcybernetics-Part A: Systems and Humans,2000. 30(3): p. 286-297.Davis, F.D., User acceptance of informationtechnology: system characteristics, userperceptions and behavioral impacts. 1993.Koustanaï, A., et al., Simulator training witha forward collision warning system: Effectson driver-system interactions and drivertrust. Human factors, 2012. 54(5): p. 709721.
University, Greenville, NC lambr19@ecu.edu Shiva Pourfalatoun Colorado State University, Fort Collins, CO shivapf@colostate.edu Sanaz Motamedi University of Florida, Gainesville, FL smotamedi@ufl.edu Abstract Drivers are assumed to actively supervise the r