Transcription
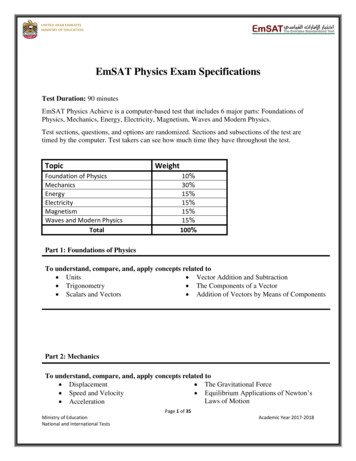
Phys 1405Conceptual PhysicsWorkbookTyler Junior College, Spring 2015by Karen Williams & Jim Sizemore, Tyler Junior CollegeAcknowledgements: These labs have been developed over a number of years by numerouscollaborators whose names have been lost and forgotten. Our thanks go to those unsung heroeswho have contributed to this work. Portions of this work are used by permission and/or fair useof Doug Parsons & Gene Branum (TJC), Dr. Bob Abel (Olympic College), The Science Source,Cenco Physics, Vernier, and AAPT.Main site: http://iteach.org/funphysicist/ with links to this workbook. Actual addresses:PDF version: 83539/conceptual physics workbook.pdf andWord version: 83539/conceptual physics workbook.docxPhoto Good Vibrations by Thomas Alper, AAPT High School Photo Winner, West BocaRaton High School, Marc Bjorkland TeacherIn the photo, the finger issliding around the rim ofthe crystal wine glassfilled with water. As thefinger applies pressure asit circles the rim, theglass vibrates and thevibrating glass causes thewater to vibrate. Theexcited water shoots outof the glass in alldirections just as thephoto shows. Not onlydoes the water shootout, but the glass creates a high pitched sound because of the natural resonance of theglass being hit as the glass is vibrated. The pitch of the sound can be changed by theamount of water in the glass.This work is licensed under a Creative Commons AttributionNonCommercial-ShareAlike 3.0 Unported License.Modified January 4, 2015(check back of page for more assignments)Page 1 of 262
Recommend Printing Instructions Yes to “Front & Back (recommended)” – that is, 2 sided copies Collate Do not staple Do not Hole Punch Spiral Binding No to Colored Paper – plain white No to Color printing Deliver to bookstoreSpecial Instructions1. PLEASE MAKE EVERY EFFORT TO DELIVER THIS TO THE BOOKSTORE BY THE FIRST DAY OF CLASS2. BINDING ON LEFT SIDE LIKE A REGULAR BOOK – NOT ON RIGHT3. Print in black & white4. If possible print all copies from file-don't make Xerox & copy (due to photos/graphics not copying well).5. GRAY cardstock front and back.6. Print so odd numbered pages are on the right.7. Deliver one copy to your name , your office ( your mailroom )TJC Bookstore InformationTJC Course Name: Conceptual PhysicsTJC Course Number: PHYS 1405Instructor's Name: list names of all instructors Bookstore Up-Charge (if known): 5.00Note to Instructors:1. If the number of weeks in a semester is insufficient to do all the labs, then one of thefirst two labs (Measurements or Density and Archimedes’ Principle), or the SpecificHeat lab may be omitted.2. This lab book is designed to follow Paul Hewitt’s “Conceptual PhysicsFundamentals” textbook.3. Contact Jim Sizemore for quizzes that correspond to this lab book.4. Instructors may also choose to require preliminary questions be turned in at thebeginning of the lab. This document is a work in progress, however, and this maynot be appropriate for all labs.5. The “Momentum, Energy, and Collisions” lab it calls for repeating runs. For thesake of time these repeats may be omitted if the students have good runs.6. Also in the “Momentum, Energy, and Collisions” the vector nature of momentum isused only once and then mostly ignored. This is intentional to determine if studentsaccommodate this. Various hints are given, such as calling for students to record thedirection of motion. There is no column for this – students must record motion fromleft-to-right as “ ” and right-to-left as “-”. Instructors, watch out for this as studentsperform the experiment.7. The “Vector Force Table” lab should not be done prior to the third week so that thetopic is discussed in lecture prior to the lab.8. The “Density and Archimedes’ Principle” lab fits with Hewitt’s Chapter 2 (atoms) orChapter 7 (fluids).9. The “Free Fall” lab fits with Hewitt’s Chapter 3 (constant acceleration) or Chapter 6(gravity).Modified January 4, 2015(check back of page for more assignments)Page 2 of 262
Table of ContentsLabPageScientific Method and MeasurementsDensity and Archimedes’ PrincipleDensity and Specific Gravity61621Graphing Displacement, Velocity, and Acceleration23Vector Force Table34Free Fall41Work, Power, and Conservation of Energy51Momentum, Energy and Collisions59Specific Heat of Substances67Specific heats for various substances at 20 C70Batteries, Bulbs, and Circuits72Electrical & Magnetic Fields80Measuring the Speed of Sound91Reflection Laboratory97Refraction Laboratory104Spectroscopy Laboratory115Appendix A: Lecture Activities129Which Way Does the Moon Move?130Project133Planning for College136Philosophy of Science Debate140Mass of a penny143How to Weigh Air148Roadrunner151Roadrunner Speed154How Fast Must Supergirl Jump157Treasure Hunt160Supergirl's Force163Rocket Report166Supergirls Momentum168Supergirls Energy170Supergirls Power172Rolling Races174Moon Guns178Torque on Yo-YoModified January 4, 2015180(check back of page for more assignments)Page 3 of 262
Centripetal Force on Yo-Yo182Fluids185Yo-yo Pendulum188Slinky Wave Conceptual190Wave Phenomena193Sound Resonance197Electricity200Series Circuits203Parallel Circuits208Speed of Light213Solar Car217Heat220Entropy223Electrical Energy225Resistance229Magnetism234Electrical Oscillation236AM Radio Antenna240Optics243Interference245X-ray Vision249Relativity252Supergirl's Photons255Sun’s Energy258Appendix B: SOLVE Method261Profits from the sale of this lab manual will go toward student activities and professionaldevelopment.Modified January 4, 2015(check back of page for more assignments)Page 4 of 262
Page left intentionally blankModified January 4, 2015(check back of page for more assignments)Page 5 of 262
Conceptual Physics WorkbookScientific Method and Measurements/ /Names – 3 to 5 people per group,/ at 6 split into 2 groupsClass: Section: Date:PurposeThe purpose of this lab exercise is to 1) illustrate that we cannot rely on human intuitionand perception as a reliable method of making physical measurements, 2) estimate andmeasure objects for length, height, depth, volume, area, mass, and density, and 3)familiarize students with the SI System of measurements and unit conversions.Materials and ApparatusBlock of wood, triple beam balance, pencil, metric ruler, meter stickIntroductory InformationDefinitions: Intuition – the ability to know without the need for critical reasoning. Perception – awareness that comes about through the use of senses. Measurement – the magnitude, dimension, quantity, or capacity referenced by astandard. Mass – a property of physical objects that measures the amount of matter theycontain. Weight – a measure of the heaviness of an object taking into account thegravitational pull of the earth. SI – abbreviation for Système International, an international system of units ofmetric measure accepted and used by scientists throughout the world; also known asthe “metric system”. Metric System – a decimal system of units based on the meter as the unit of length,the kilogram as the unit of mass, and the second as the unit of time. BE System – the British-English system of units; a system of units based on the footas a unit of length, the slug as the unit of mass, and the second as the unit of time. Density – a measure of an object’s mass per unit volume. The density of an objectequals its total mass divided by its total volume. Error – an unwanted by-product of any measurement that occurs because ofphysical limitations of any measuring device. Two methods to quantify error are: 1)percent error if a standard value for the measured quantity is known, or 2) percentdifference if a standard value for the measured quantity is unknown. Percent Error – also known as deviation. Percent error is a measure of the accuracyof any measured value. It is easily determined by comparing the positive differencebetween an accepted standard value and a measured value to the accepted valueitself. In mathematical terms, percent error is an expression of the amount ofdeviation from the accepted value, expressed as a percentage. Expressedmathematically, percent error is:Modified January 4, 2015(check back of page for more assignments)Page 6 of 262
Percent Difference – a measure of the accuracy of a measured quantity that isused whenever a standard value is not known. Percent difference is the positivedifference between two measurements divided by the average of the twomeasurements. Percent difference is expressed mathematically as:ProcedureMatters of Perception1. A) Look at lines A and B below. Without measuring either line, estimate which linelooks longer. Write your answer in the box to the right.ABB) Now measure each line. Which line is actually longest? Write your answer in thebox to the right.Modified January 4, 2015(check back of page for more assignments)Page 7 of 262
2. A) Look at lines a and b below. Without measuring either line, estimate which linelooks longest. Write your answer in the box to the right.abB) Now measure each line. Which line is actually longest? Write your answer in thebox to the right.Making Length Measurements3. Obtain a wooden block from your instructor. Without actually measuring yourwooden block, use only your eyes to estimate (in centimeters) the length, width, andheight of your wooden block. (Let “length” be the longest side, “width” be the sidethat is in between the “length” and the “height”.) Record your length, width, andheight estimates in the Estimated column of Data Table 1. Be sure to include theunits of each measurement.4. Now actually measure (in centimeters) the length, width, and height of the woodenblock. Record your measurements in the SI column of Data Table 1. Be sure toinclude units.5. Calculate and record in the right-hand-column of Data Table 1 the percent differencebetween your estimated and measured values for each measurement recorded in DataTable 1.Making Mass Measurements6. This time, estimate the mass (in kilograms) of the wooden block, without actuallymaking the measurement. Record your estimated mass in Data Table 2.7. Now actually measure the mass (in kilograms) of the wooden block. Record the massof the wooden block in Data Table 2.8. Calculate and record in the right-hand column of Data Table 2 the percent differencebetween your estimated and measured values for the mass.Non-Fundamental Physical Quantities9. Using measurements recorded in Data Table 1, calculate the area of the one largestside of your block of wood. Record your finding in Data Table 3. Be sure to recordthe correct unit.Modified January 4, 2015(check back of page for more assignments)Page 8 of 262
10. Using measurements recorded in Data Table 1, calculate the volume of your block ofwood. Record your finding in Data Table 3. Be sure to record the correct unit.11. Now, calculate the density of your block of wood, using the mass of the block ingrams. Record your finding, with the correct unit, in Data Table 3. If you haveforgotten the definition of density, refer to the Introductory Information at thebeginning of this lab exercise.12. Once you have filled in the first column of Data Table 3, report your findings on theboard for all to see. Once all of the lab groups have reported their findings, you cancalculate the class averages. Record the averages in the second column of Data Table3.13. Using the class average values for area, volume, and density as the accepted values,calculate the percent error between your measured area, volume, and density and theaccepted values. Be careful: percent error is not the same as percent difference.14. Complete this lab by answering the questions.Data TablesData Table 1 – Length MeasurementsEstimatedLengthSI (Metric)% DifferenceSI (Metric)% DifferenceWidthHeightData Table 2 – Mass MeasurementEstimatedMassData Table 3Your MeasurementClass Average% ErrorAreaVolumeDensityModified January 4, 2015(check back of page for more assignments)Page 9 of 262
Questions1. How accurate were your perceptions and estimates in this lab? What could possiblyhappen if we don’t measure things but only use estimated values?2. If a block of wood were 6 inches by 4 inches by 2 inches, what would be the block’svolume in SI units (m3)? HINT: 1 inch 2.54 cm (Show your work!)Modified January 4, 2015(check back of page for more assignments)Page 10 of 262
3. If a person weighs 150 lbs, what is their mass in kilograms? (Show your work!)4. By what factor would the area of the largest face of your block change if the length,width, and height of the block were each doubled?Modified January 4, 2015(check back of page for more assignments)Page 11 of 262
5. By what factor would the volume of your block change if the length, width, andheight of the block were each doubled?6. If the type of the wood the block were made from did not change, but the length,width, and height of the wooden block were each doubled, how would the density ofthe block change?Modified January 4, 2015(check back of page for more assignments)Page 12 of 262
7. Using SI units and without actually making a measurement, estimate the volume of thephysics lab room in which you are currently located.8. Using SI units, measure the volume of the physics lab room in which you arecurrently located.Modified January 4, 2015(check back of page for more assignments)Page 13 of 262
9. What is the percent difference between your estimated and measured volumes above?(Show your work!)Lab 1 Follow-upOne of the main purposes of this lab was to introduce you to the metric system and unitconversions. You will be using the metric system and conversions throughout theremainder of this course, so if you are still not comfortable with this process, pleasereview the concepts again before the next class.Modified January 4, 2015(check back of page for more assignments)Page 14 of 262
Page left intentionally blankModified January 4, 2015(check back of page for more assignments)Page 15 of 262
Conceptual Physics WorkbookDensity and Archimedes’ Principle/ /Names – 3 to 5 people per group,/ at 6 split into 2 groupsClass: Section: Date:PurposeThe purpose of this lab is to learn how to find the density of materials, and to investigateArchimedes’ principle and the buoyant force. The procedure is outlined in very generalterms below. You must use your own knowledge and skills to decide how to make manyof these measurements.I.II.MaterialsA. Wood block B.D. RulerE.G. Catch Beaker H.Metal blockC.Mass BalanceF.2 N Spring Scale I.Graduated CylinderOverflow Beaker5 N Spring ScaleDensityDensity is defined as the amount of mass in a unit of volume. So to calculate thedensities of the materials below, we must know the mass of the material and thevolume of the object. You will have a meter stick and a triple-beam balance touse in obtaining your measurements. Attach additional pages well organized torecord intermediate data.A.Find the density of the wood block.Mass (g)Density (g/cm3)Volume (cm3)B.Find the density of the metal block. Can you identify the metal using thechart in your book?Mass (kg)Density (kg/m3)Volume (m3) Type of metal?C.Find the density of 50 ml of water in the graduated cylinder. Compare itto the accepted value (you can find it in your book) by calculating thepercent difference. (1 ml 1 cm3 0.000001 m3)MassMeasured DensityVolumeAccepted DensityPercent errorModified January 4, 2015(check back of page for more assignments)Page 16 of 262
1.Describe step-by-step the procedure that you used to find the density of the woodblock and the metal block.2.Describe step-by-step the procedure that you used to find the density of the water.Modified January 4, 2015(check back of page for more assignments)Page 17 of 262
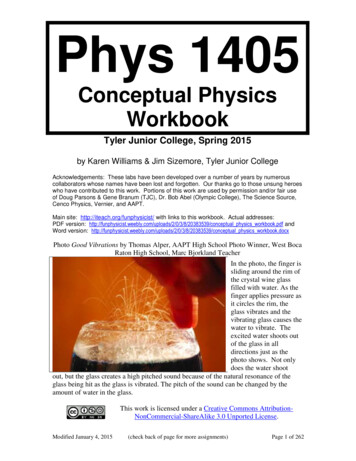
3.List some possible reasons for the error that you obtained in your measurement ofthe density of the water.III.Archimedes’ Principle and the Buoyant ForceArchimedes’ principle states that the buoyant force on an object immersed in afluid is equal to the weight of the fluid that the object displaces.A.Procudure 1: Using the small beakers to catch the water that is displacedwhen the blocks are lowered into the cans, and with careful massmeasurements, the weight of the water can be determined, thusdemonstrating Archimedes’ principle.B.Procudure 2: Another way to measure the buoyant force on the object isto compare the weight of the object dry to the weight of the object when itis submerged (but not touching the sides or bottom). In other words,FB Wdry – WwetIt’s easy to measure force with a spring scale, but is difficult with a massbalance since the object must be suspended beneath it as shown:Forces actingon samplemass balanceFBWwetis equal and opposite toWdryModified January 4, 2015(check back of page for more assignments)Page 18 of 262
C.Procedure 3: Here’s how to get around the experimental difficulties ofProcedure 2. Fill a beaker partly full of water and measure its mass. Callthis mbw for mass of only the beaker and water and calculate the force thescale is exerting upward, Wbw mbwg. Then dip the unknown in andmeasure the mass. Call this min for mass with unknown in the beaker andwater and calculate the force the scale is exerting upward, Win ming. Seethe following figure to understand the force diagrams:Forces actingon sampleWwetFBForces acting on beaker–rdby Newton’s 3 Law, if the wateris pushing up and the sample, thesample must push down withequal and opposite force. WdryFBmass balanceWbwWinTherefore, here is another way to find FB:FB Win – Wbw.Note: 1 ml 1 cm3 .000001 m3Observations:Volume of metal block: m m m m3Do Procedure 2 or Procedure 3 – not bothProcedure 2 Data:Mass of dry metal block: kg Weight of dry metal block: N(not necessary if using spring scale)Apparent mass of submerged block: kg Weight of submerged block: N(not necessary if using spring scale)Procedure 3 Data:Mass of beaker and water: kgWeight of beaker and water: NMass of beaker and waterwith sample in water:kgWeight of beaker and waterwith sample in water:NProcedure 1 Data: Mass of dry overflow beaker: kgMass of overflow beaker and displaced water: kgMass of displaced water: kgCalculations of Buoyant Force:1) Weight of displaced water from Procedure 1: N2) Buoyant force from Procedure 2 or Procedure 3: NModified January 4, 2015(check back of page for more assignments)Page 19 of 262
1.Compare the weight of the displaced water, and the buoyant force on the block.How are these quantities related?2.Calculate the percent difference for your measurements of buoyant force above.List some of the possible reasons for this error.%diff FB1 FB 2 100 FB1 FB 2 2 Modified January 4, 2015(check back of page for more assignments)Page 20 of 262
3.Was the purpose of this lab accomplished? WHY OR WHY NOT?Density and Specific Gravity http://www.funphysicist.net/help/density.htm Now 9/5/2012 Mod 09/05/2012Selected Table of Densities below -- Click here for Complete Table of Densitiesgmkgρ( 3 )ρ( 3)SolidsS.G. (Specific Gravity - no units)cmmGold (Au)19.319.319,300Lead (Pb)11.311.311,300Silver (Ag)10.510.510,500Copper (Cu)8.98.98900Brass (average)8.68.68600Steel (Fe)7.87.87800Tin (Sn)7.297.297290Zinc (Zn)7.147.147140Aluminum (Al)2.72.72700Balsa Wood0.30.3300Oak0.80.8800Earth Average5.525.525520Mercury ol0.80.8800Liquids & GasesAntifreeze1.125 (32 F)1.098 (77 F)1.125 (32 F) 1125 (32 F)1.098 (77 F) 1098 (77 F)Air1.29 * 10-31.29 * 10-31.29Hydrogen9.0 * 10-59.0 * 10-50.09OxygenModified January 4, 2015-31.43 * 10-31.43 * 10(check back of page for more assignments)1.43Page 21 of 262
Page left intentionally blankModified January 4, 2015(check back of page for more assignments)Page 22 of 262
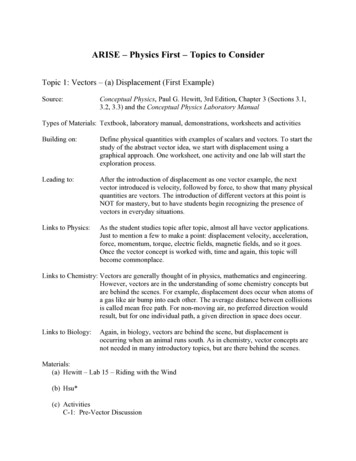
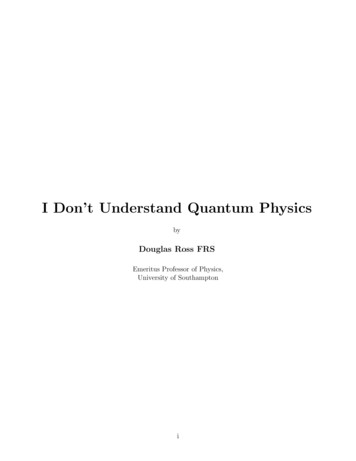
Conceptual Physics WorkbookGraphing Displacement, Velocity, and Acceleration/ /Names – 3 to 5 people per group,/ at 6 split into 2 groupsClass: Section: Date:One of the most effective methods of describing motion is to plot graphs of distance,velocity, and acceleration vs. time. From such a graphical representation, it is possible todetermine in what direction an object is going, how fast it is moving, how far it traveled,and whether it is speeding up or slowing down. In this experiment, you will use a MotionDetector to determine this information by plotting a real time graph of your motion asyou move across the classroom.The Motion Detector measures the time it takes for a high frequency sound pulse to travelfrom the detector to an object and back. Using this round-trip time and the speed ofsound, you can determine the distance to the object; that is, its position. Logger Pro willperform this calculation for you. It can then use the change in position to calculate theobject’s velocity and acceleration. All of this information can be displayed either as atable or a graph. A qualitative analysis of the graphs of your motion will help youdevelop an understanding of the concepts of kinematics.walk back and forthin front ofMotion DetectorOBJECTIVES Analyze the motion of a student walking across the room.Predict, sketch, and test distance vs. time kinematics graphs.Predict, sketch, and test velocity vs. time kinematics graphs.MATERIALSPower Macintosh or Windows PCLabPro or Universal Lab InterfaceLogger ProModified January 4, 2015Vernier Motion Detectormeter stickmasking tape(check back of page for more assignments)Page 23 of 262
PRE-LAB ASSIGNMENT1.Make distance vs. time predictions. Use a coordinate system with the origin atfar left and positive distances increasing to the right. Sketch the distance vs. timegraph for each of the following situations. You may draw all four graphs on asingle sheet of graph paper. An object at rest An object moving in the positive direction with a constant speed An object moving in the negative direction with a constant speed An object that is accelerating in the positive direction, starting from rest2.Make velocity vs. time predictions. Sketch the velocity vs. time graph for eachof the situations described above. Start with a clean sheet, but you may still drawall four of these graphs on a single sheet of graph paper.PROCEDUREPart l Preliminary Experiments1.2.3.4.5.6.Connect the Motion Detector to DIG/SONIC 2 of the LabPro or PORT 2 of theUniversal Lab Interface. (Note that the second input is used in both cases!)Place the Motion Detector so that it points toward an open space at least 4m long.Use short strips of masking tape on the floor to mark the 1m, 2m, 3m, and 4mdistances from the Motion Detector.(Optional – often it works better to just plug it in and turn it on). Open theExperiment 1 folder from Physics with Computers. Then open the experiment fileExp 01a Distance Graph. One graph will appear on the screen. The vertical axishas distance scaled from 0 to 5 meters. The horizontal axis has time scaled from 0to 10 seconds.Using Logger Pro, produce a graph of your motion when you walk away from thedetector with constant velocity. To do this, stand about 1m from the MotionDetector and have your lab partner click Collect . Walk slowly away from theMotion Detector when you hear it begin to click. This will be easiest if thecomputer screen is turned so the walker can see it.Predict what the distance vs. time graph will look like if you walk faster. Checkyour prediction with the Motion Detector.Quickly experiment by trying to match some of the shape of the distance vs. timegraphs that you sketched in the Preliminary Questions section by walking in frontof the Motion Detector.Modified January 4, 2015(check back of page for more assignments)Page 24 of 262
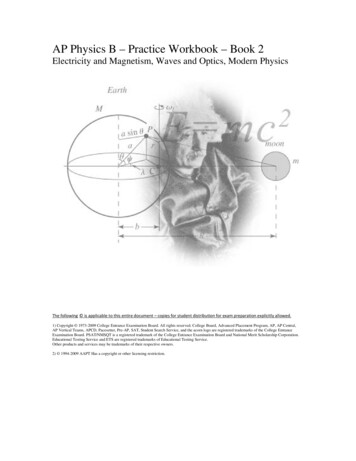
Part Il Distance vs. Time Graph Matching7.Open the experiment file Exp 01b Distance Match One. The distance vs. timegraph shown below will appear.8.Describe how you would walk to produce this target graph.9.To test your prediction, choose a starting position and stand at that point. Startdata collection by clicking Collect . When you hear the Motion Detector begin toclick, walk in such a way that the graph of your motion matches the target graphon the computer screen. If you were not successful, repeat the process until yourmotion closely matches the graph on the screen. If a printer is attached, print thegraph with your best attempt. If a printer is not attached, then sketch your bestattempt on the figure above.Modified January 4, 2015(check back of page for more assignments)Page 25 of 262
10.Now open the experiment file Exp 01c Distance Match Two. A new graph willappear.11.Describe how you would walk to produce this target graph.12.To test your prediction, choose a starting position and stand at that point. Startdata collection by clicking Collect . When you hear the Motion Detector begin toclick, walk in such a way that the graph of your motion matches the target graphon the computer screen. If you were not successful, repeat the process until yourmotion closely matches the graph on the screen. If a printer is attached, print thegraph with your best attempt. If a printer is not attached, then sketch your bestattempt on the figure above.13.Answer the Analysis questions for Part II (three pages more from this page)before proceeding to Part III.Modified January 4, 2015(check back of page for more assignments)Page 26 of 262
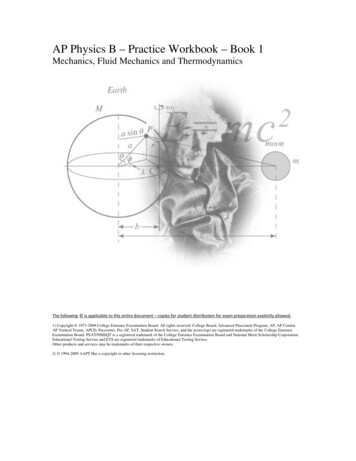
Part IIl Velocity vs. Time Graph Matching14.Open the experiment file Exp 01d Velocity Match One. You will see thefollowing velocity vs. time graph.15.Describe how you would walk to produce this target graph.16.To test your prediction, choose a starting position and stand at that point. StartLogger Pro by clicking Collect . When you hear the Motion Detector begin toclick, walk in such a way that the graph of your motion matches the target graphon the screen. It will be more difficult to match the velocity graph than it was forthe distance graph. If a printer is attached, print the graph with your best attempt.If a printer is not attached, then sketch your best attempt on the figure above.Modified January 4, 2015(check back of page for more assignments)Page 27 of 262
17.Open the experiment file Exp 01e Velocity Match Two. You will see thefollowing velocity vs. time graph.18.Describe how you would walk to produce this target graph.19.To test your prediction, choose a starting position and stand at that point. StartLogger Pro by clicking Collect . When you hear the Motion Detector begin toclick, walk in such a way that the graph of your motion matches the target graphon the screen. It will be more difficult to match the velocity graph than it was forthe distance graph. If a printer is attached, print the graph with your best attempt.If a printer is not attached, then sketch your best attempt on the figure above.Remove the masking tape strips from the floor and answer the analysis questions.20.Modified January 4, 2015(check back of page for more assignments)Page 28 of 262
ANALYSIS – PART II DISTANCE VS. TIME GRAPH MATCHING1.Explain the significance of the slope of a distance vs. time graph. Include adiscussion of positive and negative slope.2.What type of motion is occurring when the slope of a distance vs. time graph iszero?Modified January 4, 2015(check back of page for more assignments)Page 29 of 262
3.What type of motion is occurring when the slope of a distance vs. time graph isconstant?4.What type of motion is occurring when the slope of a distance vs. time graph ischanging? Test your answer to this question using the Motion Detector.Modified January 4, 2015(check back of page for more assignments)Page 30 of 262
Part III Velocity vs. Time Graph Matching5.What does the area under a velocity vs. time graph represent? Test your answer tothis question using the Motion Detector.6.What type of motion is occurring when the slope of a velocity vs. time graph iszero?Modified January 4, 2015(check back of page for more assignments)Page 31 of 262
7.What type of motion is occurring when the slope of a velocity vs. time graph isnot zero? Test your answer using the Motion Detector.Modified January 4, 2015(check back of page for more assignments)Page 32 of 262
Page left intentionally blankModified January 4, 2015(check back of page for more assignments)Page 33 of 262
Conceptual Physics WorkbookVector Force Table/ /Names – 3 to 5 people per group,/ at 6 split into 2 groupsClass: Section: Date:Purpose:To determine whether forces truly behave as vectors.Materials: Force Table Packet with center ring, strings, pulleys, mass hangers, and center post Mass Set (be sure to return mass set as you received it) Extra Masses (be sure to return masses to same place that you took them from)Definitions:Force Table: . an apparatus used to measure and test vector quantitiesResultant: . the vector sum of two or more vectors.Equilibrant: . a vector that is the same magnitude but in the oppositedirection of the resultant. The equilibrant will equalize theforces so the net force is zero.Parallelogram Method: . a geometric method of calculating the resultant of two vectors.It requires that the vectors be drawn to scale. The resultant isthen determined by completing a parallelogram and drawingthe resultant as a diagonal of the parallelogram.Tail-to-tip Method. a second geometric method of calculating the resultant of twovectors. The first vector is drawn to scale from the origin.The vector to be added is drawn to scale starting from t
2. This lab book is designed to follow Paul Hewitt’s “Conceptual Physics Fundamentals” textbook. 3. Contact Jim Sizemore for quizzes that correspond to this lab book. 4. Instructors may also choose to require preliminary questions be turned in at the beginning of the lab. T