Transcription
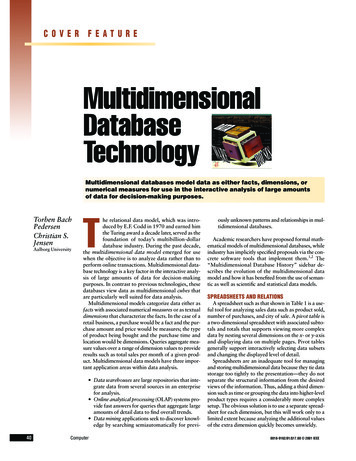
Methodology for the multidimensional characterization of the Quality of Employment in EcuadorMethodology for the multidimensionalcharacterization of theQuality of Employment in EcuadorObando CarlosAmores César.Bangkok, September 10 20191
Methodology for the multidimensional characterization of the Quality of Employment in retical frameworkDiscussion and ResultsConclusions2
Methodology for the multidimensional characterization of the Quality of Employment in Ecuador1. IntroductionQuality of EmploymentWhat is it ?How to quantify it ?How to measure it ?In Ecuador:Who really have a good or poorquality of employment?
Methodology for the multidimensional characterization of the Quality of Employment in Ecuador1. Introduction1.0 Quality of Employment- PrespectivesState Human andlabor rights Economicgrowth PovertyCompany Haveproductiveand versatileworkersWorkers Stability Social benefits Economicsatisfaction Personalsatisfaction
Methodology for the multidimensional characterization of the Quality of Employment in Ecuador1. Introduction – Problem statementConceptual framework of theEcuadorian labor market.ENEMDU Databases (INEC))Conceptual and methodologicalelements of the ILO, concerningdecent workConceptual and methodologicalelements of the Europe Unionconcerning decent workConceptual and methodologicalelements of studies in LatinAmerica (QOE)Conceptual and methodologicalelements based on studiesconducted in Ecuador (povertyand well-being indexes)Conceptual framework of the QOEMethodology fortheCharacterizationof EmploymentQuality (QOE)QOE index calculationQOE characterizationTheory of categorical principalcomponent analysis (CATPCA)5
Methodology for the multidimensional characterization of the Quality of Employment in Ecuador1. Introduction1.1 Ecuadorian labor marketAdequateTime relatedUnderemploymentIncome quateOther enHiddenFig 1.2 – EAP Clasification(INEC, 2014)6
Methodology for the multidimensional characterization of the Quality of Employment in Ecuador1. Introduction1.1 Ecuadorian Labor MarketTable 1.1.1History of Employment and Unemployment survey (ENEMDU)AñoAreaSelf – represented CitiesPeriodicity Inference level1987UrbanQuito, Guayaquil, CuencaAnnualSelf-represented cities1988UrbanQuito, Guayaquil, Cuenca, MachalaAnnualSelf-represented cities1989UrbanQuito, Guayaquil, Cuenca, MachalaAnnualSelf-represented cities1990Urban, RuralQuito, Guayaquil, Cuenca, MachalaAnnualNational & Self-represented cities1991 to 2002UrbanQuito, Guayaquil, Cuenca, MachalaAnnualNational & Self-represented cities2003Urban & ruralQuito, Guayaquil, Cuenca, MachalaBiannualNational & Self-represented cities2004 to 2006Urban & ruralQuito, Guayaquil, Cuenca, MachalaQuarterlyNational & Self-represented cities2007 to 2016Urban & ruralQuito, Guayaquil, Cuenca, Machala, AmbatoQuarterlyNational & Self-represented citiesSource: Instituto Nacional de Estadística y Censos (INEC)7
Methodology for the multidimensional characterization of the Quality of Employment in Ecuador1. Introduction1.1 Ecuadorian Labor MarketTable 1.1.2Main variables investigated by ENEMDU surveyNo123456789101112131415VariableAreaNatural regionProvinceMain citiesGenderAgeFamily relationshipSocial SecurityCivil StatusLevel of instructionEthnicityWorked last week (reference week)Job search managementReason for no job searchJob availabilityPopulationTotal PopulationTotal PopulationTotal PopulationTotal PopulationTotal PopulationTotal PopulationTotal PopulationTotal Population12 population5 population5 population5 populationUnemployment 5 No job 5 Inactive population 5 No161718192021222324252627282930VariableInactivity conditionOccupational positionType of contractWorkplaceNumber of workersExistence of accounting recordsUnit regiter of taxpayers (RUC)Number of jobsWorking hours in reference weekJob satisfactionWork incomeEconomic sectorOccupational groupActivity branchActivity conditionPopulationInactive population 5 Occupied population 5 Occupied population 5 Occupied population 5 Occupied population 5 Occupied population 5 Occupied population 5 Occupied population 5 Occupied population 5 Occupied population 5 Occupied population 5 Occupied population 5 Occupied population 5 Occupied population 5 Total populationSource: Instituto Nacional de Estadística y Censos (INEC)8
Methodology for the multidimensional characterization of the Quality of Employment in Ecuador1. Introduction1.1 Ecuadorian Labor MarketNationalOccupation, underemployment and unemployment ratesTable 1.1.3Main Indicators60,053,6National2012 20132014 2015 2016Gross participation rate45,643,844,645,747,1Global participation rate61,762,164,565,867,3Gross occupancy rate59,159,562,062,663,8Global occupancy rate95,995,896,295,294,8Full occupancy rate46,547,949,346,541,2Inadequate occupancy rateUnderemployment 54,14,23,84,85,2Open unemployment rate3,13,03,03,74,1Hidden unemployment 019,920,011,619,9Unemployment 201520160,0Tasa de Ocupación PlenaSource: INEC - ENEMDU Survey- DecemberTasa de Ocupación InadecuadaTasa de SubempleoTasa de DesempleoSource: INEC9
Methodology for the multidimensional characterization of the Quality of Employment in Ecuador1. Introduction1.2 ILO – Decent WorkOriginGeneralObjetiveStrategicObjetives(ILO, 2013) Jun 1999 87ª International Working Conference Promote economies at the service of the people(freedom, equity, security and dignity) Workers rightsEmployment opportunitiesSocial protectionSocial dialogue
Methodology for the multidimensional characterization of the Quality of Employment in Ecuador1. Introduction1.2 ILO – Decent WorkIndicators Employment opportunitiesAdequate income and productive workDecent Work HoursReconciliation of work, family life and personal lifeWork that should be abolishedStability and work safetyOpportunities and treatment in employmentSafe working environmentSocial SecuritySocial dialogue and representation of workers and employers11
Methodology for the multidimensional characterization of the Quality of Employment in Ecuador1. Introduction1.3 European Union – Quality of Employment (EU, 2010)Origin Lisbon European Council March 2000GeneralObjetives Improve the quality of employment in the countries of the region Become one of the most competitive and dynamic economies inthe worldFeatures Intrinsic quality of work (level of satisfaction) Quality of work in the organization (absence of risks) Quality in the conformation of employment (salary, stability, .)12
Methodology for the multidimensional characterization of the Quality of Employment in Ecuador1. IntroductionEuropean Union – Quality of EmploymentSinteticIndicatorDP2Bernardo PeñaTrapero 1977 Calculate the distance of each case with respect to a theoretical reference case thatrepresents the worst possible conditions, under the assumptions of: Completeness: Consider all the properties of the incident variables. Goodness: The simple indicators of each variable are statistically good. Objectivity: What is sought with the synthetic indicator can be achieved throughsimple indicators. Linearity: There is a linear relationship between the incident variables.Tabla 1.3.1Ranking de calidad de empleo al 2005mThe number of casesnThe number of variablesxijThe value of variable i for the case jσiThe standard deviation of variable iR2i,i 1, ,1Determination coefficient of the regression Xi against Xi 1 , Xi 2 , , X1𝑛Then:𝐷𝑃2 𝑑𝑖ൗ𝜎𝑖21 𝑅𝑖,𝑖 1, ,1𝑖 1𝑤𝑖𝑡ℎ𝑅12 0,𝑑𝑖 𝑥𝑖𝑗 𝑥𝑖 ,𝑥𝑖 𝑣𝑎𝑙𝑢𝑒 𝑜𝑓 𝑟𝑒𝑓𝑒𝑟𝑒𝑛𝑐𝑒 𝑖𝑛 𝑣𝑎𝑟𝑖𝑎𝑏𝑙𝑒 �lgicaAustriaSueciaIrlandaReino tugalItaliaEstoniaHungríaRepública 15,48771815,62661915,660620
Methodology for the multidimensional characterization of the Quality of Employment in Ecuador1. Introducción1.4 Latin America – Quality of employment Calculate a Decent Work Index (DWI) in terms of deficit, consideringindicators: Basic (labor income and registration as a natural or legal person) Complementary (hours of work and social security)PerúJulio Gamero2009 - 2010 Then, based on these two groups of indicators, it determines five levels ofdecent work: (1) Employed with jobs that meet all basic and complementary indicators(2) Busy with jobs that meet basic indicators only(3) Employed who comply with some basic indicator but not all(4) Employed who comply with any complementary indicator(5) Employed who do not satisfy any indicator.14
Methodology for the multidimensional characterization of the Quality of Employment in Ecuador1. Introducción1.4 Latin America – Quality of employmentColombiaStefano Farné2002 - 2010 Calculate a CDE index from 13 variables, using CATPCA analysis Minor workers, women in management positions, socialsecurity affiliation, formality, involuntary part-time, seniority inthe same job, workplace, occupational category, minimum laborincome, observed labor income, hours of work,underemployment and desire to change job This index for better understanding is re-scaled tovalues between 0 and 100, where 0 is the lowest quality and100 the highest quality As a result, the QOE of 2002 compared to that of 2010 shows animprovement in salaried workers from 68.0 to 70.7 and inindependent workers from 41.4 to 44.215
Methodology for the multidimensional characterization of the Quality of Employment in Ecuador1. Introduction1.5 Ecuadorian Studies – Quality of EmploymentPorcentajeMCDS2006 In the analysis of the Ecuadorian labor market 19902005 The QOE is a concept determined by: Job stabilityEAP occupied Public employment80 Informality7059,660,4 The sub occupation and56,86049,9 Social security l2005SubocupadaSource: (MCDS, 2006)16
Methodology for the multidimensional characterization of the Quality of Employment in Ecuador1. Introduction1.5 Ecuadorian Studies – Decent WorkSENPLADESPNBV (nationalplan for goodliving)2014 Sponsor equality, cohesion and social and territorial integration in diversity Improve the capabilities and potential of citizenship Improve the quality of life of the population Guarantee the rights of nature and promote a healthy and sustainable environment Guarantee sovereignty and peace, and promote strategic insertion in the world Ensure stable, fair and decent work in all its forms Build and strengthen public, intercultural and common meeting spaces Affirm and strengthen national identity, diverse identities, multinationality and interculturality Ensure the observance of rights and justice Guarantee access to public and political participation Establish a social economic system, solidary and sustainable Build a democratic State for Good LivingTable 1.5.1. Indicators of Decent WorkIndicator NameValue 2013 Goal 2013CompliancestatusReach 55% of the PEA with full occupation43,2%46,0% UnachievedReduce PEA underemployment to 40%52,5%47,0% UnachievedReduce youth unemployment by 15%8,6%9,3% Achieved49,3%48,0% UnachievedReduce labor informality to 42%
Methodology for the multidimensional characterization of the Quality of Employment in retical frameworkDiscussion and ResultsConclusions
Methodology for the multidimensional characterization of the Quality of Employment in Ecuador2. ObjetivesFrom theperspective ofthe workers Establish a theoretical methodologicalframework for QOE Quantify the QOE Characterize the QOE19
Methodology for the multidimensional characterization of the Quality of Employment in retical frameworkDiscussion and ResultsConclusions20
Methodology for the multidimensional characterization of the Quality of Employment in Ecuador3. Theoretical Framework3.1 Conceptual Framework of QOEEmploymentQuality ofEmployment (CIET, 1982) Person employed. When working at a certain referencetime, he performs an economically productive activity on a paid orindependent basis. (UE, 2010), the quality of employment is a state of well-being orsatisfaction in which a worker is when performing an economicactivity in a specific time and space. (Farné, 2012) the quality of employment is a state of well-being orsatisfaction that can be mainly economic, social and psychological.21
Methodology for the multidimensional characterization of the Quality of Employment in Ecuador3. Theoretical Framework3.1 Conceptual Framework of QOEIncident Factor Attribute, property or characteristic inherent to theemployment that workers have at a given time and spaceIncident FactorClasses Qualitative (ordinal, nominal) QuantitativeNature of anIncident Factor DemographicSocialEconomicEtc.22
Methodology for the multidimensional characterization of the Quality of Employment in Ecuador3. Theoretical Framework3.2 QOE Index- Definition (UE, 2010)Quality ofEmploymentIndex Result of an interrelation or interaction of incident factors (Xj)QOE 𝜑(𝑋1, 𝑋2, ,𝑋𝑗, ,𝑋𝑝 )QOE σ𝑝𝑗 1 𝛽𝑗 𝑓(𝑋𝑗 )QOE index as alineracombination ofincident factorsAssumptions forQOE indexQOE 𝑄𝑢𝑎𝑙𝑖𝑡𝑦 𝑜𝑓 𝑒𝑚𝑝𝑙𝑜𝑦𝑚𝑒𝑛𝑡 𝑖𝑛𝑑𝑒𝑥 𝛽𝑗 𝑐𝑜𝑒𝑓𝑓𝑖𝑐𝑖𝑒𝑛𝑡 𝑜𝑓 𝑣𝑎𝑟𝑖𝑎𝑏𝑙𝑒 𝑜𝑟 𝑖𝑛𝑐𝑖𝑑𝑒𝑛𝑡 𝑓𝑎𝑐𝑡𝑜𝑟 𝑋𝑗 𝑓 𝑋𝑗 ��𝑛 𝑜𝑓 𝑖𝑛𝑐𝑖𝑑𝑒𝑛𝑡 𝑓𝑎𝑐𝑡𝑜𝑟 𝑋𝑗 𝑝 𝑛𝑢𝑚𝑏𝑒𝑟 𝑜𝑓 𝑖𝑛𝑐𝑖𝑑𝑒𝑛𝑡 𝑓𝑎𝑐𝑡𝑜𝑟𝑠 Completeness: consider all incident factors.Goodness: the simple indicators of each incident factor are statistically good.Objectivity: what is sought with the index, can be achieved through simple indicatorsLinearity: there is a linear relationship between the incident factors.Uniqueness: the index is unique for a given case or situation.Exhaustivity: the index takes full advantage of the information of each incident factor.23
Methodology for the multidimensional characterization of the Quality of Employment in Ecuador3. Theoretical Framework3.3 Quality of Employment – Calculation methodologyCOE ion ofincident factorsDefinition ofincident factors(INEC, 2014)(Recode)Obtain optimalquantifications(CATPCA)𝑝𝑄𝑂𝐸 σ𝑗 1 𝑞′𝑗 𝛽𝑗𝑇Donde:𝑞′𝑖𝑗 𝑞𝑖𝑗 𝛼𝑗σ𝑝𝑗 1 𝛾𝑗𝑄𝑂𝐸 Quality of Employment Index𝑞′𝑗 j variable re-scaled quantifications vector𝛽𝑗 j variable weigth vector𝑝 number of incident factors𝑊ℎ𝑒𝑟𝑒:𝑞 ′ 𝑖𝑗 𝑜𝑝𝑡𝑖𝑚𝑢𝑠 𝑟𝑒 𝑠𝑐𝑎𝑙𝑒𝑑 ��𝑛𝑠 𝑜𝑓 𝑖 𝑐𝑎𝑡𝑒𝑔𝑜𝑟𝑦 𝑖𝑛 𝑗 𝑣𝑎𝑟𝑖𝑎𝑏𝑙𝑒𝑞𝑖𝑗 𝑟𝑒 𝑠𝑐𝑎𝑙𝑒𝑑 ��𝑛𝑠 𝑜𝑓 𝑖 𝑐𝑎𝑡𝑒𝑔𝑜𝑟𝑦 𝑖𝑛 𝑗 𝑣𝑎𝑟𝑖𝑎𝑏𝑙𝑒𝛼𝑗 𝑚𝑖𝑛 𝑞𝑖𝑗𝛾𝑗 𝑚𝑎𝑥 𝑞𝑖𝑗 𝛼𝑗24
Methodology for the multidimensional characterization of the Quality of Employment in retical frameworkDiscussion and ResultsConclusions25
Methodology for the multidimensional characterization of the Quality of Employment in Ecuador4. Discussion and ResultsVariables &/ostandarizedincident ifications(0 a 100 pts)QOE index26
Methodology for the multidimensional characterization of the Quality of Employment in Ecuador4. Discussion and Results4.1 Standarization of Incident FactorsLabor Income1 LI 2502 250 LI 5003 500 LI 7504 750 LI 10005 LI 1000Incident variables of QOENro Variables1Gender2Social security3Marital status4Instruction level5Ethnic6Reason for working less than 40 hours7Reason for working 40 hours or more89Reason for changing jobOccupation category10Workplace11How do you feel at work12Activity branch13Occupation group14Age15Working time16Hours of work in the past week17Labor income18Income in terms of basic wages1920Economic sectorActivity condition21Establishment size22Benefits of law (13th and 14th salary)23Receive other benefits24Type of contractRecodingquantitativevariables to ordinalcategorics AgeLabor IncomeWorking TimeHour of work in the past weekEstablishment sizeStandarizationRecoding of nominalcategorical variables(-) to ( )(-)Type of contract 654321 Social Security Reason for working 40 hours or more Occupation category How do you feel at work Economic sector Activity condition Workplace Occupation group Type of contract( )123456Per workdayPer hoursFor work or pieceworkTemporal contractPermenent contractDesignation or nomination27
Methodology for the multidimensional characterization of the Quality of Employment in Ecuador4. Disccusion and Results4.2 Quality of Emplyment Index – SintaxCATPCA VARIABLES rp02 Rp05a p06 p10a p15 p25 rp26 p31 rp42 rp46 rp59 rama1 rgrupo1 edad ttiempo horastraingreso ingresosb rsecemp rcond tamano benefley benefotr estable/ANALYSIS rp02(WEIGHT 1,LEVEL NOMI) Rp05a(WEIGHT 1,LEVEL NOMI) p06(WEIGHT 1,LEVEL NOMI)p10a(WEIGHT 1,LEVEL ORDI) p15(WEIGHT 1,LEVEL NOMI) p25(WEIGHT 1,LEVEL NOMI)rp26(WEIGHT 1,LEVEL NOMI) p31(WEIGHT 1,LEVEL NOMI) rp42(WEIGHT 1,LEVEL NOMI) rp46(WEIGHT 1,LEVEL NOMI)rp59(WEIGHT 1,LEVEL NOMI) rama1(WEIGHT 1,LEVEL NOMI) rgrupo1(WEIGHT 1,LEVEL NOMI)edad(WEIGHT 1,LEVEL ORDI) ttiempo(WEIGHT 1,LEVEL ORDI) horastra(WEIGHT 1,LEVEL ORDI)ingreso(WEIGHT 1,LEVEL ORDI) ingresosb(WEIGHT 1,LEVEL ORDI) rsecemp(WEIGHT 1,LEVEL NOMI)rcond(WEIGHT 1,LEVEL NOMI) tamano(WEIGHT 1,LEVEL ORDI) benefley(WEIGHT 1,LEVEL NOMI)benefotr(WEIGHT 1,LEVEL NOMI) estable(WEIGHT 1,LEVEL NOMI)/MISSING rp02(PASSIVE,MODEIMPU) Rp05a(PASSIVE,MODEIMPU) p06(PASSIVE,MODEIMPU)p10a(PASSIVE,MODEIMPU) p15(PASSIVE,MODEIMPU) p25(PASSIVE,MODEIMPU) rp26(PASSIVE,MODEIMPU)p31(PASSIVE,MODEIMPU) rp42(PASSIVE,MODEIMPU) rp46(PASSIVE,MODEIMPU) rp59(PASSIVE,MODEIMPU)rama1(PASSIVE,MODEIMPU) rgrupo1(PASSIVE,MODEIMPU) edad(PASSIVE,MODEIMPU) ) ingreso(PASSIVE,MODEIMPU) U) rcond(PASSIVE,MODEIMPU) tamano(PASSIVE,MODEIMPU)benefley(PASSIVE,MODEIMPU) benefotr(PASSIVE,MODEIMPU) estable(PASSIVE,MODEIMPU)/DIMENSION 2/NORMALIZATION VPRINCIPAL/MAXITER 100/CRITITER .00001/PRINT CORR DESCRIP LOADING OBJECT OCORR QUANT (rp02 Rp05a p06 p10a p15 p25 rp26 p31 rp42 rp46 rp59rgrupo1 rama1 rsecemp edad horastra ttiempo ingreso ingresosb rcond tamano benefley benefotr estable)/PLOT OBJECT (0) NDIM(1,2)CATEGORY (rp02 Rp05a p06 p10a p15 p25 rp26 p31 rp42 rp46 rp59rgrupo1 rama1 rsecemp edad horastra ttiempo ingreso ingresosb rcond tamano benefley benefotr estable) (0)LOADING((center)) (20)/SAVE APPROX OBJECT TRDATA.AGGREGATE/OUTFILE * MODE ADDVARIABLES/BREAK pt/TRA1 1 min min(TRA1 1)/TRA2 1 min min(TRA2 1)/TRA3 1 min min(TRA3 1)/TRA4 1 min min(TRA4 1)/TRA5 1 min min(TRA5 1)/TRA6 1 min min(TRA6 1)/TRA7 1 min min(TRA7 1)/TRA8 1 min min(TRA8 1)/TRA9 1 min min(TRA9 1)/TRA10 1 min min(TRA10 1)./TRA20 1 min min(TRA20 1)/TRA21 1 min min(TRA21 1)/TRA22 1 min min(TRA22 1)/TRA23 1 min min(TRA23 1)/TRA24 1 min min(TRA24 1).compute TRA1 1 esc TRA1 1-TRA1 1 min.compute TRA2 1 esc TRA2 1-TRA2 1 min.compute TRA3 1 esc TRA3 1-TRA3 1 min.compute TRA4 1 esc TRA4 1-TRA4 1 min.compute TRA5 1 esc TRA5 1-TRA5 1 min.compute TRA6 1 esc TRA6 1-TRA6 1 min.compute TRA7 1 esc TRA7 1-TRA7 1 min.compute TRA8 1 esc TRA8 1-TRA8 1 min.compute TRA9 1 esc TRA9 1-TRA9 1 min.compute TRA10 1 esc TRA10 1-TRA10 1 min.compute TRA20 1 esc TRA20 1-TRA20 1 min.compute TRA21 1 esc TRA21 1-TRA21 1 min.compute TRA22 1 esc TRA22 1-TRA22 1 min.compute TRA23 1 esc TRA23 1-TRA23 1 min.compute TRA24 1 esc TRA24 1-TRA24 1 min.AGGREGATE/OUTFILE * MODE ADDVARIABLES/BREAK pt/TRA1 1 max max(TRA1 1 esc)/TRA2 1 max max(TRA2 1 esc)/TRA3 1 max max(TRA3 1 esc)/TRA4 1 max max(TRA4 1 esc)/TRA5 1 max max(TRA5 1 esc)/TRA6 1 max max(TRA6 1 esc)/TRA7 1 max max(TRA7 1 esc)/TRA8 1 max max(TRA8 1 esc)/TRA9 1 max max(TRA9 1 esc)/TRA10 1 max max(TRA10 1 esc)./TRA20 1 max max(TRA20 1 esc)/TRA21 1 max max(TRA21 1 esc)/TRA22 1 max max(TRA22 1 esc)/TRA23 1 max max(TRA23 1 esc)/TRA24 1 max max(TRA24 1 esc).compute sum maximos sum(tra1 1 max totra24 1 max).compute indicev1 TRA1 1 esc / sum maximos.compute indicev2 TRA2 1 esc / sum maximos.compute indicev3 TRA3 1 esc / sum maximos.compute indicev4 TRA4 1 esc / sum maximos.compute indicev5 TRA5 1 esc / sum maximos.compute indicev6 TRA6 1 esc / sum maximos.compute indicev7 TRA7 1 esc / sum maximos.compute indicev8 TRA8 1 esc / sum maximos.compute indicev9 TRA9 1 esc / sum maximos.compute indicev20 TRA20 1 esc / sum maximos.compute indicev21 TRA21 1 esc / sum maximos.compute indicev22 TRA22 1 esc / sum maximos.compute indicev23 TRA23 1 esc / sum maximos.compute indicev24 TRA24 1 esc / sum maximos.compute indice sum(indicev1 to indicev24).
Methodology for the multidimensional characterization of the Quality of Employment in Ecuador4. Discussion and Results4.3 Optimal Quantifications and Re scaledCuantificaciones icationsRe-escaledMINVariables incidentesCategoríasGéneroSeguridad 83170.72360.70300.5099NingunoSeguro .0373AUS-1.3736-1.2730-1.15440.4062Seguro privado sin guro privado con uro ISSFA ISSPOL1.30851.48611.35341.32151.3067IESS Seguro 2-1.125-1.107-1.721-1.650Seguros MunicipalesEstado civilNivel de instrucciónIESS Seguro Voluntario0.10450.0082-0.0323-0.0704IESS Seguro .5717-1.5552Unión -2.0005-2.0512-1.9931Centro de ón .28200.25860.25420.19580.1620Educación Media0.52800.60161.12181.22551.2044Superior no r Universitario1.52451.61431.27471.22551.204429
Methodology for the multidimensional characterization of the Quality of Employment in Ecuador4. Discussion and Results4.4 QOE Index ResultsTabla 4.4.1QOE ,246,545,943,745,6NacionalElaborado por: Carlos Obando2016PromedioQOE per main cities59,0Quito57,0QOEQOE Index perENEMDU Domainsof Studycompute tota 1.variable labels tota 'Total'.value labels tota 1 ' '.if (ciudad 170150 and area 1) ciu 1.if (ciudad 090150 and area 1) ciu 2.if (ciudad 010150 and area 1) ciu 3.if (ciudad 070150 and area 1) ciu 4.if (ciudad 180150 and area 1) ciu 5.if (area 1) nac 1.if (area 2) nac 2.variable labels ciu 'Ciudades'.variable labels nac 'Nacional'.value labels ciu 1 'Quito' 2 'Guayaquil' 3 'Cuenca' 4 'Machala' 5 'Ambato'.value labels nac 1 'Urbano' 2 'Rural'.weight by fexp.compute filtro (condactn 1 and condactn 6 and p03 15).filter by filtro.compute indicep indice*100.tables/observation indicep/table(ciu nac tota) by indicep/statistics mean('Indice Promedio ' (f6.2))/title'Indice de calidad del empleo - 2016'.tables/observation indicep/table(prov tota) by (tota nac) indicep/statistics mean('Indice Promedio ' (f6.2))/title'Indice de calidad del empleo según provincia - 2016'.filter off.use all.weight Ambato47,02012201320142015201630
Methodology for the multidimensional characterization of the Quality of Employment in Ecuador4. Discussion and results4.4 QOE Index resultsTable 4.4.2QOE per provincesQOE IndexQOE Index mborazo36,233,28,934,132,435,0El 0Los 240,842,7Morona 40,041,4Zamora a36,242,342,339,039,339,8Santo Domingo39,944,045,944,743,043,5Santa Elena41,644,144,042,743,1Zonas no delimitadas35,637,438,336,837,020142015AzuaySanta Elena50,0Santo 0,030,0Cotopaxi20,0GalápagosChimborazo10,0Zamora ChinchipeEl baburaNapoMorona SantiagoLojaLos RiosManabí31
Methodology for the multidimensional characterization of the Quality of Employment in Ecuador4. Discussion and results4.5 Statistical validity of resultsYear 2016EstimationsQOE IndexNacionalEstimación43,7420Errores tándar,12776EstimaciónErrores tándar95% de intervalo deconfianzaInferior43,4915CoeficienteSuperiorde variación43,9925,00395% deintervalo deconfianzaCoeficientede variaciónTamaño deEfecto dela poblacióndis eñoocupada2,5637463579Efecto dedis eñoUrbana47,9997,1669547,672548,3270,003Tamaño dela 914235,5804,0051,938QOE IndexAreaInferiorErrores tándarSuperior95% deintervalo deconfianzaCoeficientede variación2491910Efecto dedis eñoQuito53,8066,4642452,895954,7172,009Tamaño dela 950,2794,011,32492201QOE IndexCitiesEstimaciónInferiorErrores tándarSuperior95% deintervalo deconfianzaCoeficientede variaciónEfecto dedis eñoAzuay44,0726,4583543,174144,9711,010Tamaño dela 3,3765,0161,696273471El Oro44,5814,3550843,885445,2775,008,987299338QOE indexProvincesEstimaciónInferiorSuperior32
Methodology for the multidimensional characterization of the Quality of Employment in retical frameworkDiscussion and ResultsConclusions33
Methodology for the multidimensional characterization of the Quality of Employment in Ecuador5. Conclusions and RecommendationsConclusionsRecommendations There are three visions of the QOE (State, Company, Worker)The QOE is a state of well-being or satisfactionThe QOE can be measured by calculating an Index using CATPCAThe average QOE index for Ecuador is 45.6 (2012-2016)In Ecuador, the QOE tends to deteriorate. In the last year the CDEindex fell by 4.8% The cities with the best QOE are Quito and Cuenca The provinces with the best QOE are Galapagos and Pichincha To recommend to INEC to use the methodology proposed tocalculate the QOE index annually To recommend to the national and international statisticalcommunity the use of this methodology for the calculation of theQOE index. To recommend to the national and international statisticalcommunity the use of this methodology for uses, not only foreconomic purposes but also for others (Health, Education, etc.).34
¡¡ Thanks!!
2007 to 2016 Urban & rural Quito, Guayaquil, Cuenca, Machala, Ambato Quarterly National & Self-represented cities . Tasa de Ocupación Plena Tasa de Ocupación Inadecuada Tasa de Subempleo Tasa de Desempleo 1. Introduction 1.1 Ecuadorian Labor Market . Jun 1999 87ª International Working