Transcription
Nucleic Acids Research Advance Access published June 22, 2007Nucleic Acids Research, 2007, 1–8doi:10.1093/nar/gkm295VisANT 3.0: new modules for pathway visualization,editing, prediction and constructionZhenjun Hu1, David M. Ng3, Takuji Yamada2, Chunnuan Chen3, Shuichi Kawashima4,Joe Mellor, Bolan Linghu1, Minoru Kanehisa2, Joshua M. Stuart3 and Charles DeLisi1,*1Center for Advanced Genomic Technology, Boston University, Boston, MA 02215, USA, 2Bioinformatics Center,Institute for Chemical Research, Kyoto University, Japan, 3Department of Biomolecular Engineering, University ofCalifornia, Santa Cruz, CA 95064, USA and 4Human Genome Center, Institute of Medical Science, University ofTokyo, JapanReceived January 31, 2007; Revised April 9, 2007; Accepted April 12, 2007ABSTRACTWith the integration of the KEGG and Predictomedatabases as well as two search engines forcoexpressed genes/proteins using data setsobtained from the Stanford Microarray Database(SMD) and Gene Expression Omnibus (GEO) database, VisANT 3.0 supports exploratory pathwayanalysis, which includes multi-scale visualizationof multiple pathways, editing and annotating pathways using a KEGG compatible visual notation andvisualization of expression data in the context ofpathways. Expression levels are represented eitherby color intensity or by nodes with an embeddedexpression profile. Multiple experiments can benavigated or animated. Known KEGG pathwayscan be enriched by querying either coexpressedcomponents of known pathway members or proteins with known physical interactions. Predictedpathways for genes/proteins with unknown functions can be inferred from coexpression or physicalinteraction data. Pathways produced in VisANTcan be saved as computer-readable XML format(VisML), graphic images or high-resolution ScalableVector Graphics (SVG). Pathways in the format ofVisML can be securely shared within an interestedgroup or published online using a simple Web link.VisANT is freely available at http://visant.bu.edu.INTRODUCTIONBiological pathways are often represented as pixel images(JPEG, GIF, etc.) or vector graphics (Scalable VectorGraphics (SVG) or PostScript). Typical examples of suchstatic representations include those presented in databasessuch as KEGG (1), Reactome (2), BioCarta (http://www.biocarta.com) and EcoCyc (3). Although a staticrepresentation is intuitive and informative and has beenwidely used in textbooks and illustrations, it is difficult toedit, or to reuse for analysis, modeling and simulation. Asa result, important resources such as the KEGG databasecannot be fully exploited. Notable steps toward meetingthe challenge of computable representations include thedevelopment of BioPAX (Biological Pathways Exchange,http://www.biopax.org/) and KGML (KEGG BioPAX focusing on detailed ontology while KGMLincludes layout information.A number of software tools (4–9) have been developedto visually build computable models of pathways. Thesetools are usually based on graphical models in whichnodes represent genes, proteins or chemical compounds,and edges represent various types of interactions orassociations. To date, few tools support the conditionaldependencies of molecular and genetic entities and theirassociations. Thus, pathways encoded with existing toolsmay lack key information needed for interpreting thepathway’s functioning.In order to combine multiple pathways in a mannerthat is useful for modeling cellular behavior, two mainchallenges must be addressed. First, models must allow ahierarchical visual representation (6,10–12). Second, datarepresentation is complicated when several complexesshare some of their proteins, because the role of acommon protein generally depends on context (13,14).Methods such as semantic zooming or hierarchicaldecomposition (10,12,15–20) are needed to aggregateand abstract entire pathways or pathway portions intosmall units that can be displayed within larger pathwaysystems. Hierarchical structures are also very common inthe computable representation of biological knowledge inBioPAX and KGML formats. A protein complex must*To whom correspondence should be addressed. Tel: þ617 353 1122; Fax: þ617 353 3333; Email: delisi@bu.eduPresent address:Joe Mellor, Department of Biological Chemistry and Molecular Pharmacology, Harvard Medical School, Boston, MA 02115, USAß 2007 The Author(s)This is an Open Access article distributed under the terms of the Creative Commons Attribution Non-Commercial License ) which permits unrestricted non-commercial use, distribution, and reproduction in any medium, provided the original work is properly cited.
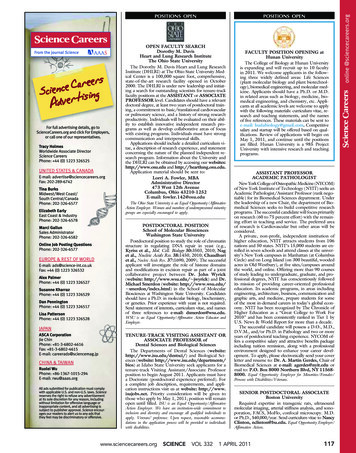
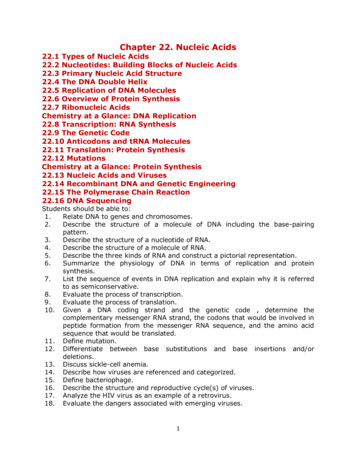
2 Nucleic Acids Research, 2007Figure 1. Illustration of multi-scale visualization of pathways using VisANT’s metagraph capability. Green boxes are contracted metanodesrepresenting a group of enzymes that catalyze a common reaction; filled green circles represent enzymes and open circles represent compounds.(A) KEGG Yeast pathways shown in VisANT by first loading MAP00220 and then expanding MAP00910. The connection between MAP00910 andMAP00251 is shown only after MAP00910 is expanded. (B) The eight pathways are all represented as contracted linked metanodes. A and B can bealternately displayed by toggling the state of the metanodes.often be represented as a node containing a set of nodes,one for each subunit. Each subunit in turn may itselfcontain a set of nodes representing conserved domainsidentified in the subunit’s 3D structure or primarysequence. Representing a protein complex as a simple,non-hierarchical, node often obscures properties of theproteins because attributes of the simple node areaggregated across multiple proteins, each of which mayhave different attributes with respect to one another. Anobvious workaround for this issue is to model proteincomplexes as ‘compound nodes’(10,11,15) or ‘metanodes’,which are nodes with recursive internal structure(Figure 1) (20).While biological systems contain an appreciableamount of hierarchical organization, molecular components are reused across subsystems, making it impossibleto perfectly capture all of the information into a nested setof relations. Strict hierarchical representations can capturebiological substructure but cannot model overlap betweenprotein complexes. Related to this idea, nodes thatrepresent only a single protein may not have a uniquestate but may instead behave in a condition-dependentmanner. It is common practice (21) to use multiple nodesto represent different states of the same protein tomaintain clarity of control logic and conditional dependency in pathways. However, this can lead to anexplosively growing chain of nodes. It also breaks dataintegrity and introduces data redundancy, as the sameprotein is represented by multiple nodes. More importantly, the exact conditional-dependent state of a givenprotein can be unclear or unknown in many pathways.A typical example can be found for protein STE20 in theMAKP signaling pathway for yeast (http://www.genome.ad.jp/dbget-bin/show pathway?sce04010 þ YHL007C),which most likely has different activities under differentconditions, but the exact nature of the state differences iscurrently unknown. How can such conditional dependencies be represented and modified when correspondingbiological information becomes available?Protein–protein interaction data sets obtained fromeither large-scale experiments or computational predictions, as well as coexpressed genes predicted from largescale expression data, can be used to help fill gaps inincomplete pathways (22–25). Although many toolsprovide facilities to visualize expression data in the contextof pathways (4,5,7,9,26), facilities to enrich pathways in
Nucleic Acids Research, 2007 3a computationally based visualization system, using bothinteraction and expression profiles, are missing.Here we report new developments in VisANT 3.0, aWeb-based platform with new modules supportingexploratory pathway analysis using metagraphs (20) toaddress multi-scale visualization of multiple pathways;editing and annotating pathways using a KEGG compatible visual notation; visualization of expression data in thecontext of pathways; enriching pathways using eithercoexpressed components of known pathway memberspredicted from expression data in the SMD (27) and GEO(28) databases or proteins with known physical interactions and assigning genes/proteins of unknown function toknown pathways. The new version of VisANT will helpusers take full advantage of the large number of availableresources in the KEGG pathway database when buildingnew pathways.METHODSMetagraphsA metagraph is a data structure for representingnodes, edges and subnetworks in a nested structure. Onesignificant difference between a compound graph and ametagraph is that metagraphs allow one node to havemultiple instances and these instances are automaticallytracked. This capability allows a metanode in a metagraphto share nodes: each metanode has its own instance of thesame node. Metanodes have two semantic states: anexpanded state that reveals the associated subgraph inside,and a contracted state that hides the internal structure,rendering the metanode as a simple node. Edges betweenthe nodes in an expanded metanode have the usualmeaning (associations based on experimental data orcomputationally inferred correlations); edges betweenmetanodes either reflect a correlation between standard(hidden) nodes or indicate that the same gene/proteinoccurs in both metanodes (20).and Saccharomyces cerevisiae. When VisANT is run as anonline applet, connections to the services are mediated bythe VisANT server.GeneRecommender (29) discovers new genes withsimilar function to a given list of genes (the query) alreadyknown to have closely related function. It ranks genesaccording to how strongly they correlate with a set ofquery genes in those experiments for which the querygenes are most strongly coregulated.ClueGene (30) uses the pattern of how genes clustertogether in sets of experiments to recommend new genes ina pathway. ClueGene bases its recommendations on thequery set and on a cluster compendium. Each set ofexperiments is clustered independently. The collection ofclusters constitutes the cluster compendium. Each gene inthe genome is given a co-clustering score. Higher scoringgenes are more highly recommended and tend to be foundin small clusters in the cluster compendium along withquery genes.The use of VisANT (20,31,32) to mine, integrate anddisplay biological interactions based on KEGG pathwaysand expression data is facilitated by a name-normalizationservice which resolves IDs used by different databases. Inaddition, customized ID mappings, as well as corresponding Web links, can be easily added to the network througha simple tab-delimited format. VisANT is developed usingJava technology. In addition to the Web browser appletinterface, VisANT can also be run as a stand-aloneapplication which implements an auto-upgrading detection system to keep it up-to-date. Detailed informationon VisANT’s three-tier structure (31) and plugin framework(20) can be found at http://visant.bu.edu. In addition, a new error-reporting system has been implementedto enhance the integration reliability of distributedsystems: users will have the option to report criticalerrors to the plugin authors and VisANT team.INPUT AND OUTPUTKGML and pathway integration toolsInputKGML is an exchange format for KEGG graph objects,particularly KEGG pathways, which are manually drawnand updated. The KGML files for KEGG metabolicpathways specify how enzymes (boxes) are linked by arelation and how compounds (circles) are linked bya reaction. In contrast, the KGML files for KEGGregulatory pathways contain only the former. KGML filesfor all supported species in VisANT have been preprocessed to map genes to their KEGG pathways, and aVisANT user can identify pathways for a specified geneeither by searching for its interactions or resolving(normalizing) its names or IDs as explained subsequently.Two pathway recommendation web services for identifying functionally related genes from transcriptionalprofiles are integrated in VisANT through its pluginarchitecture (20). Given a set of query genes, typically theknown genes of a pathway, these services recommendadditional genes in the same pathway as the query set.Both search engines support five species: Homo sapiens, Musmusculus, Drosophila melanogaster, Caenorhabditis elegansVisANT automatically recognizes the format of an inputfile based on its content. Only those formats that relatedwith the new functions will be discussed here. The full listof supported files can be found in VisANT’s web site.Pathways can be loaded into VisANT using severaldifferent input methods as detailed in Figure 2.In particular, double-clicking on a contracted pathwaynode (e.g. the blue boxes in Figure 1) will also load thepathway if the corresponding KGML file is available fromthe KEGG. Expression data is input from a common tabdelimited file. The first column can be an Entrez Gene ID,an Access ID/GI number, a gene name or an ID from anorganism-specific database. The file can have a header lineto indicate the names of the different experiments;otherwise, VisANT will use a sequential number toidentify different experiments. If the expression data isto be overlaid on an existing pathway, the name normalization service should be utilized first so that genes in thenetwork and in the expression data can be matched toeach other.
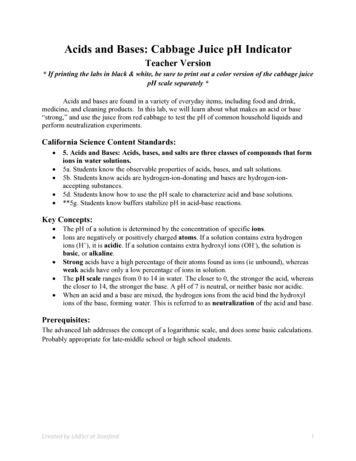
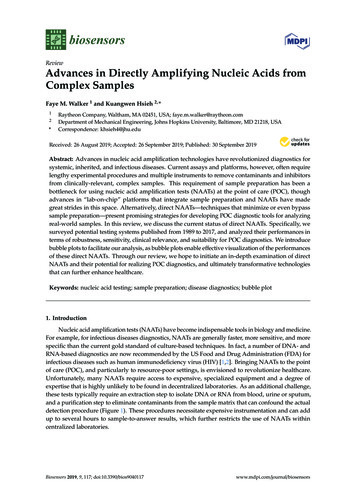
4 Nucleic Acids Research, 2007Figure 2. Different methods of loading pathways into VisANT. (A) KEGG pathways for a given species can be directly browsed and pathways ofinterest can be loaded by clicking the ‘graphics’ link. A pathway can also be located and loaded by using its (B) name or ID, (C) a URL or(D) KGML contents copied/pasted into the ‘Add’ box. (E) Pathway IDs will be shown in a node’s tooltip if the protein/gene is involved in one ormore pathways. In such a case, a pathway can be directly loaded using a set of drop down menus as shown above.OutputAll data shown in VisANT can be saved in an XML formatusing the VisANT Markup Language (VisML). Registeredusers can save the network on the VisANT server so that itcan be accessed wherever the internet is available. VisMLuses a version number to facilitate compatibility andextensibility. A description of VisML can be found athttp://visant.bu.edu. In addition, pathways can be exportedwithout visual information, as tab-delimited edge and nodelists. Pathways can also be saved as pixel images, or ashigh-quality SVG for publication and illustration. An SVGfile can be further polished with an SVG editor.PROGRAM DESCRIPTIONPathway visualization, navigation and editingEach pathway is represented as a metanode which may benested within other metanodes (Figure 1). If links to otherpathways are available in KGML, these pathways arerepresented as contracted metanodes.VisANT adopts the KEGG notation for graphicsannotation so that users will have consistent views of theKEGG pathways. However, a few changes were necessary. In particular, a single protein/gene is represented as afilled green circle, and a metanode displayed as a greenbox is used to represent multiple proteins/genes.Additionally, the number of proteins/genes contained ina metanode can be revealed by double-clicking the box.Use of a metanode for a protein complex is alsointroduced (Figure 3). Multiple instances of the samenode can exist even in the same pathway (ARG5,6 inFigure 1). These instances can be tracked by pressing theright mouse button over the corresponding node. Dashedlines will connect all instances of the node. The linesvanish once the mouse button is released.Pathways can be easily edited in VisANT. Nodes andedges can be modified, added or deleted. Additionalcomponents can be added to pathways by a simpledrag and drop. Pathways can be easily ungroupedor regrouped as one large pathway, depending on theuser’s needs.
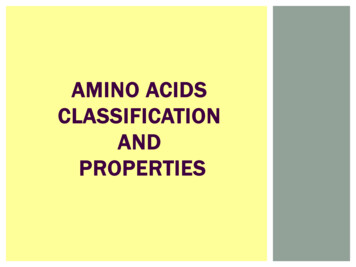
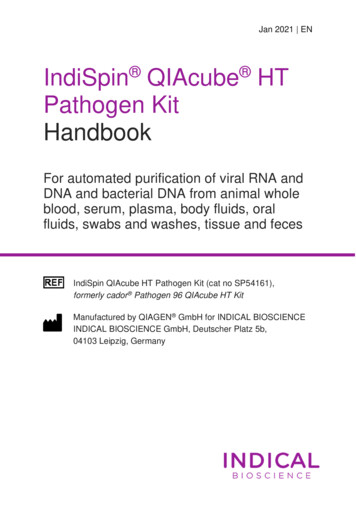
Nucleic Acids Research, 2007 5Figure 3. Illustration of pathway enrichment. (A) H. sapiens notch signaling pathway, the g-secretase complex is represented as nested metanodes.Five components are shown in the complex. (B) VisANT plugin for the GeneRecommender service searches for the top 10 coexpressed genes with agiven set of query genes shown in the left panel. Score plotter of the top 10 coexpressed genes is shown in the right panel. (C) Expression data of thetop 50 experiments, as well as additional genes excluding the query set, are returned and integrated with the existing network. New genes are shownusing the circle layout. Expression of PSENEN is shown as an embedded plotter. Color is used to represent expression for the rest nine other geneswith red for low expression values and green for high values. Gray is used to indicate that the expression value of the gene for the current experimentis missing. (D) The metanode of the g-secretase complex is contracted and the expression plotter is turned on. All expression profiles for the membercomponents are plotted together; the average profile is shown in black. The discontinuity is due to missing values for some components ofcorresponding experiments. (E) Querying against the Predictome database indicates that APH1A and PSENEN are functionally related (36).
6 Nucleic Acids Research, 2007Multi-scale visualization, pathway overview and crosstalkAs with the extension of interactions for a given protein/gene, pathways can be extended by double-clicking on apathway node. Using this method, a network of pathwayscan be quickly constructed. Figure 1A shows the networkof pathways by first loading pathway MAP00220 and thenexpanding the pathway MAP00910. It is worth noting thatcrosstalk between MAP00251 and MAP00910 mediatedby the compound C00025 is only visible after MAP00910is expanded.Because the state of a metanode can be toggled bymouse-clicking, an overview of the pathway shown inFigure 1B can be easily achieved by contracting the twopathway nodes MAP00910 and MAP00220. Thus,VisANT is capable of easily exploring pathways atdifferent scales: a pathway overview enables users toobserve the topology of large sets of pathways, while thedetailed internal structure of any particular pathway or setof pathways is easily revealed by mouse-clicking.Overlaying expression dataVisANT provides two methods to visualize expressiondata over pathways: either the node color is used torepresent the expression value in a particular experiment,or a plot of the expression profile is embedded in the node,as shown in Figure 3. The two methods can be toggledeither for individual nodes or for the whole network.Different experiments can be navigated using a sliding barand the navigation process can be animated. When theexpression profile is shown, the corresponding experimentand expression value is indicated by a cursor.In VisANT it is convenient to determine whether genesin the same pathway are coexpressed, as all the expressionprofiles of the nodes contained in a metanode (pathway),as well as the average profile, are drawn together as oneplot with average profiles in black. Figure 3D shows suchan example for a node representing a protein complex.Pathway predictionSets of genes in the same pathway are often activatedtogether and may have very similar expression profiles;their protein products may also interact, either physicallyor functionally, to achieve a specific task. VisANTprovides functions to assign genes/proteins with unknownfunction to the known KEGG pathways based on theseobservations. Predictome (33) can easily be queried forsets of proteins that interact either functionally orphysically with a specified protein. VisANT also hasediting capabilities that allow any such set to beaugmented with a user’s own data set.Genes with similar expression profiles can be identifiedusing the ClueGene and GeneRecommender plugins andthe genes so identified can be associated with one oranother KEGG pathway in accordance with user specifiedcriteria based on either functional or physical links(Figure 2E) (25,34,35). Query genes can be placed inidentified pathways by a simple drag and drop.We suggest that users test the coexpression of querygenes with known genes in the potential pathways andcompare scores using either ClueGene or GeneRecommender. In addition, expression profiles can be compared ifquery genes are searched using GeneRecommender.Pathway construction, enrichment and updateNew pathways can be created from scratch or fromrelevant KEGG pathways, the latter of course beingsubstantially more convenient because of KEGG documentation. In collaboration with the KEGG, theVisANT web site lists all pathways for which KGML isavailable, allowing easy access and loading into VisANT(Figure 2A). These reference KEGG pathways can also beupdated when necessary. When loaded into VisANT, theycan be enriched either by querying functionally associatedcomponents from experimental and computational resultsaccessible from the VisANT-Predictome system, or bysearching for coexpressed genes as indicated above.We next describe a use-case scenario to illustrate someof the new features of VisANT. Suppose a user isinterested in the g-secretase complex which acts in theH. sapiens notch signaling pathway (Figure 3A), andwishes to get more knowledge about related genes or theinternal structure of the g-secretase complex. First, theGeneRecommender plugin can be used to search forpotential genes coexpressed with the five componentmembers of the complex: APH1A, NCSTN, PSEN1,PSEN2 and PSENEN. GeneRecommender returns thetop 10 coexpressed genes scored in the top 50 experiments.As can be seen from Figure 3B, the scores of thecoexpressed genes can be separated into three groups.The top group, APH1A, PSEN1 and PSEN2, has muchhigher scores than the second group, PSENEN andLRRTM4. The plotter is linked to the network andselecting a spot in the plotter will select the correspondingnode in the network (Figure 3B and C). Note that querygene NCSTN is not included in the top 10 coexpressedgenes, indicating that NCSTN is not positively correlatedwith other members of the complex. Anti-correlations arevery common in signaling pathways (Figure 3A); futureimplementations of the search engines will supportidentification of anticorrelated genes. Users may selectdifferent combination of query genes to achieve the bestresults. In addition, the degree of coexpression betweenmembers of a given metanode can be viewed bycontracting the metanode and turning on the expressionplotter option, as shown in Figure 3D. To further test thecorrelation of the 11 genes shown in Figure 3C,interactions between pairs of genes are queried againstthe Predictome database, which reveals the interactionbetween PSENEN and APH1A identified by coimmunoprecipitation (36), as shown in Figure 3E.In addition, pathways can be updated against theKEGG database so that the latest pathway informationcan be easily incorporated into existing pathways customized by the users.FUTURE DEVELOPMENTAmong our goals for further development of VisANT issupporting pathways from other databases, including
Nucleic Acids Research, 2007 7Reactome (2), BioCarta (http://www.biocarta.com),EcoCyc (3) and INOH (http://www.inoh.org/). Sincecomputable representations of pathways from thesedatabases are available in BioPAX format, one way toproceed would be to increase VisANT’s support ofBioPAX. This will require developing an automaticlayout algorithm since BioPAX, unlike KGML, does notcontain layout information. More importantly, a standardvisual notation for different types of nodes and edges willalso need to be developed for different types of biologicalcomponents, and for the relations between them. Second,unlike KGML in which each pathway is usually stored inits own file, pathways in BioPAX format are usuallyrepresented in one large file which can exceed 100 MB,making it impractical to load them all at once and alsopreventing exploratory navigation of pathways. Newefforts, such as the latest developments in CPath (http://cbio.mskcc.org/cpath/home.do) have made significantprogress to overcome this problem by providing corresponding Application Programming Interfaces (APIs) thatcan retrieve pathways one by one in the format ofBioPAX. We expect obstacles discussed above will beremoved in the near future and pathways from thesedatabases will be ready for use in VisANT.AVAILABILITYVisANT along with the full user manual and tutorials areavailable on the VisANT web site, http://visant.bu.eduConflict of interest statement. None declared.REFERENCES1. Kanehisa,M., Goto,S., Hattori,M., Aoki-Kinoshita,K.F., Itoh,M.,Kawashima,S., Katayama,T., Araki,M. and Hirakawa,M. (2006)From genomics to chemical genomics: new developments in KEGG.Nucleic Acids Res., 34, D354–D357.2. Joshi-Tope,G., Gillespie,M., Vastrik,I., D’Eustachio,P., Schmidt,E.,de Bono,B., Jassal,B., Gopinath,G.R., Wu,G.R. et al. (2005)Reactome: a knowledgebase of biological pathways.Nucleic Acids Res., 33, D428–D432.3. Keseler,I.M., Collado-Vides,J., Gama-Castro,S., Ingraham,J.,Paley,S., Paulsen,I.T., Peralta-Gil,M. and Karp,P.D. (2005)EcoCyc: a comprehensive database resource for Escherichia coli.Nucleic Acids Res., 33, D334–D337.4. Chung,H.J., Park,C.H., Han,M.R., Lee,S., Ohn,J.H., Kim,J.,Kim,J. and Kim,J.H. (2005) ArrayXPath II: mapping andvisualizing microarray gene-expression data with biomedical ontologies and integrated biological pathway resources using ScalableVector Graphics. Nucleic Acids Res., 33, W621–W626.5. Dahlquist,K.D., Salomonis,N., Vranizan,K., Lawlor,S.C. andConklin,B.R. (2002) GenMAPP, a new tool for viewing andanalyzing microarray data on biological pathways. Nat. Genet., 31,19–20.6. Demir,E., Babur,O., Dogrusoz,U., Gursoy,A., Nisanci,G.,Cetin-Atalay,R. and Ozturk,M. (2002) PATIKA: an integratedvisual environment for collaborative construction and analysis ofcellular pathways. Bioinformatics, 18, 996–1003.7. Mlecnik,B., Scheideler,M., Hackl,H., Hartler,J., Sanchez-Cabo,F.and Trajanoski,Z. (2005) PathwayExplorer: web service forvisualizing high-throughput expression data on biological pathways.Nucleic Acids Res., 33, W633–W637.8. Ng,A., Bursteinas,B., Gao,Q., Mollison,E. and Zvelebil,M.(2006) pSTIING: a ‘systems’ approach towards integratingsignalling pathways, interaction and transcriptional regulatorynetworks in inflammation and cancer. Nucleic Acids Res., 34,D527–D534.9. Shannon,P., Markiel,A., Ozier,O., Baliga,N.S., Wang,J.T.,Ramage,D., Amin,N., Schwikowski,B. and Ideker,T. (2003)Cytoscape: a software environment for integrated modelsof biomolecular interaction networks. Genome Res.,13, 2498–2504.10. Fukuda,K. and Takagi,T. (2001) Knowledge representation ofsignal transduction pathways. Bioinformatics, 17, 829–837.11. Demir,E., Babur,O., Dogrusoz,U., Gursoy,A., Ayaz,A., Gulesir,G.,Nisanci,G. and Cetin-Atalay,R. (2004) An ontology for collaborative construction and analysis of cellular pathways. Bioinformatics,20, 349–356.12. Herman,I., MelancËon,G. and Scott Marshall,M. (2000) Graphvisualization and navigation in information visualization: a Survey.IEEE Trans.Vis. Comput. Graph., 6, 24–43.13. Gavin,A.C., Bosche,M., Krause,R., Grandi,P., Marzioch,M.,Bauer,A., Schultz,J., Rick,J.M., Michon,A.M. et al. (2002)Functional organization of the yeast proteome by systematicanalysis of protein complexes. Nature, 415, 141–147.14. Spirin,V. and Mirny,L.A. (2003) Protein complexes and functionalmodules in molecular networks. Proc. Natl Acad. Sci. USA, 100,12123–12128.15. Sugiyama,K. and Misue,K. (1991) Visualization of structureinformation: automatic drawing of compound digraphs.IEEE Trans. Syst. Man Cybern., 21, 876–892.16. Ravasz,E., Somera,A.L., Mongru,D.A., Oltvai,Z.N. andBarabasi,A.L. (2002) Hierarchical organization of modularity inmetabolic networks. Science, 297, 1551–1555.17. Gagneur,J., Krause,R., Bouwmeester,T. and Casari,G. (2004)Modular decomposition of protein-protein interaction networks.Genome Biol., 5, R57.18. Klukas, C. and Schreiber, F. (2007) Dynamic exploration andediting of KEGG pathway diagrams. Bioinformatics, 23, 344–350.19. Saraiya, P., North, C. and Duca, K. (2005) Visualizing biologicalpathways: requirements analysis, systems evaluation and researchagenda. Information Visualization, 4, 191–205.20. Hu,Z., Mellor,J., Wu,J., Yamada,T., Holloway,D. and Delisi,C.(2005) VisANT: data-integrating visual framework forbiological networks and modules. Nucleic Acids Res., 33,W352–W357.21. Kitano,H., Funahashi,A., Matsuoka,Y. and Oda,K. (2005) Usingprocess diagrams for the graphical representation of biologicalnetworks. Nat. Biotechnol., 23, 961–966.22. Stuart,J.M., Segal,E., Koller,D. and Kim,S.K. (2003) A genecoexpression network for global discovery of conserved geneticmodules. Science, 302, 249–255.23. DeRisi,J.L., Iyer,V.R. and Brown,P.O. (1997) Exploring themetabolic and genetic control of gene expression on a genomicscale. Science, 278, 680–686.24. Lashkari,D.A., DeRisi,J.L., McCusker,J.H., Namath,A.F.,Gentile,C., Hwang,S.Y., Brown,P.O. and Davis,R.W. (1997) Yeastmicroarrays for genome wide parallel genetic and gene expressionanalysis. Proc. Natl Acad. Sci. USA, 94, 13057–13062.25. Segal,E., Wang,H. and Koller,D. (2003) Discovering molecularpathways from protein interaction and gene expression data.Bioinformatics, 19(Suppl. 1), i264–i271.26. Junker,B.H., Klukas,C. and Schreiber,F. (2006) VANTED: asystem for advanced data analysis and visualization in the contextof biological networks. BMC Bioinformatics, 7, 109.27. Ball,C.A., Awad,I.A., Demeter,J., Gollub,J., Hebert,J.M.,Hernandez-Boussard,T., Jin,H., Matese,J.C., Nitzberg,M. et al.(2005) The Stanford Microarray Database accommodates additional microarray platforms and data formats. Nucleic Acids Res.,33, D580–D582.28. Barrett,T., Troup,D.B., Wilhite,S.E., Ledoux,P., Rudnev,D.,Evangelista,C., Kim,I.F., Soboleva,A., Tomashevsky,M. et al.(2007) NCBI GEO: mining tens of millions of ex
hierarchical visual representation (6,10-12). Second, data representation is complicated when several complexes share some of their proteins, because the role of a common protein generally depends on context (13,14). Methods such as semantic zooming or hierarchical decomposition (10,12,15-20) are needed to aggregate