Transcription
Cimmino et al. BMC Veterinary Research (2018) EARCH ARTICLEOpen AccessEffects of dietary supplementation withpolyphenols on meat quality in Saanengoat kidsRoberta Cimmino1* , Carmela M. A. Barone2, Salvatore Claps3, Ettore Varricchio4, Domenico Rufrano3,Mariangela Caroprese5, Marzia Albenzio5, Pasquale De Palo6, Giuseppe Campanile7 and Gianluca Neglia7AbstractBackground: Diet supplementation with polyphenols is a novel strategy to improve meat quality in livestock, bypreventing oxidative deterioration of lipids and protein. Polyphenols have beneficial effects on both human andanimal health and can be obtained from several sources, such as olive mill wastewaters (OMWW). These are severeenvironmental pollutants and therefore may be recycled and utilized in other sectors. The aim of this study was toevaluate growth performance, meat characteristics, fatty acid composition, antioxidant status, different forms ofmyoglobin and malondialdehyde formation in kids who received a diet supplemented with polyphenols obtainedfrom OMWW. Weaned goat kids (n 18) were divided into two homogenous groups: control (C) group (n 9) receiveda fattening standard diet while the other group (n 9) received the same diet, supplemented with 3.2 mg/day ofpolyphenols powder extract (PE group). Average daily gain (ADG) was calculated 10 days apart throughout the study.After 78 days, the kids were slaughtered and pH and carcass yield were evaluated. Longissimus thoracis et lumborummuscle was collected and utilized for chemical analysis, meat quality evaluation and oxidative stability.Results: No differences were recorded in ADG, carcass weight, pH and dressing between the two groups. Furthermorea similar meat proximate composition, texture and color was observed. Dietary polyphenols supplementationsignificantly (P 0.01) decreased short chains ( C12:0) (2.93 0.50 and 0.35 0.40 g/100 g of fatty acids, for Cand PE Group, respectively), and saturated (49.22 2.39 and 39.51 1.95 g/100 g, in C and PE Group, respectively) fattyacids. Furthermore, a higher (P 0.05) proportion of monounsaturated (34.35 2.84 and 42.22 2.32 g/100 g, in C andPE Group, respectively) fatty acids was recorded. Malondialdehyde formation was significantly (P 0.05) lower in PEcompared to C Group (0.25 0.005 and 0.15 0.005, in C and PE Group, respectively).Conclusions: Polyphenols dietary supplementation has positive effects on kid meat, improving fatty acid profile andreducing malondialdehyde contents. Furthermore the utilization of OMWW as the source of polyphenols mayrepresent an innovative strategy to re-utilize agri-food industry wastes.Keywords: Polyphenols, Kids, Fatty acids, Sensory evaluation, MalondialdehydeBackgroundAn increased awareness of the consumers was recentlyobserved regarding red meat’s production and consumption.A typical example was the latest report of the World HealthOrganization (WHO), which classified the consumption ofred meat as “probably carcinogenic for man” [1], although,as outlined by other authors [2], there are still a number of* Correspondence: r.cimmino@anasb.it1Italian Buffalo Breeders Association, V. Petrarca 42/44, 81100 Caserta, ItalyFull list of author information is available at the end of the articlegaps in the current knowledge about this topic. Furthermore, eating red meat has been correlated withhigher incidence of chronic diseases [3]. For this reasonthere has been an increased interest for new breedingtechniques which confer potential health benefits to theconsumers [4].The supplementation of ruminants diet with antioxidantsis considered an effective strategy for changing and ameliorating the fatty acid composition of meat in response toconsumer demands [4]. In fact, it has been observed that The Author(s). 2018 Open Access This article is distributed under the terms of the Creative Commons Attribution 4.0International License (http://creativecommons.org/licenses/by/4.0/), which permits unrestricted use, distribution, andreproduction in any medium, provided you give appropriate credit to the original author(s) and the source, provide a link tothe Creative Commons license, and indicate if changes were made. The Creative Commons Public Domain Dedication o/1.0/) applies to the data made available in this article, unless otherwise stated.
Cimmino et al. BMC Veterinary Research (2018) 14:181the inclusion of linseed and fish oil on the lamb diet mayhave a negative impact on the oxidative stability and onphysicochemical properties of the meat [5]. In addition, thechanges that occur in the muscle during the post-mortemperiod may create an unbalanced proportion between theantioxidant and pro-oxidant capability, increasing the risksof oxidative damage [6]. The antioxidant status of themuscle is the main factor affecting oxidative deteriorationin meat [7]. Oxidative deterioration of lipids and proteinsin meat could adversely affect its nutritional quality andshelf life, reducing flavor, color and quality of meat, with anegative impact on meat consumption.Thus, it is essential to preserve the quality and thesafety of the meat by attenuating oxidative deterioration.Recently, the interest of food processing industries inthe use of natural antioxidants rather than syntheticcounterparts was increased, for either low environmentalimpact and economical reasons [8]. Furthermore naturalantioxidants are well accepted by the consumers, becausethey are considered safe and healthy [9]. For these reasons,many studies have been carried out to develop newnatural antioxidants, especially from plants [8], amongwhich polyphenols. Polyphenols are a large family of morethan 8000 natural compounds derived from plants andcharacterized by the presence of a phenol ring in theirstructure [10, 11]. Epidemiological, clinical and nutritionalstudies strongly support the evidence that dietary phenoliccompounds are effective in the prevention of commondiseases, including cancer, neurodegenerative diseasesand gastrointestinal disorders [12]. Furthermore, a largenumber of studies suggest several immunomodulatoryand anti-inflammatory properties of these compoundsin humans [13, 14]. Some studies, performed in livestock,reported the positive effects of diet supplementation withpolyphenols on pigs and chicken health. [11, 15, 16]. Inaddition, it has been hypothesized that dietary supplementation with polyphenols would increase beneficiallipids and oxidative stability of myoglobin and reducethe content of malondialdehyde (MDA) [see 11 forreview].Polyphenols can be obtained from several sources. Oneof these is the olive oil sector, particularly important inMediterranean countries, such as Spain (the leadingproducer), Italy, Greece, Turkey, Syria and Tunisia. Olivemill wastewaters (OMWW) are the main pollutant by-phaseand traditional suction systems Mills. The management ofOMWW is a serious environmental issue for the presenceof organic compounds that turn OMWW into phytotoxicmaterials [17]. Nevertheless, OMWW contains valuableresources, such as polyphenols, which can representabout 10% of OMWW dry weight [18]. Some olive oilderived-compounds, such as hydroxytyrosol, have animportant role in preventing cardiovascular diseases [19].Thus OMWW could be recycled and utilized in otherPage 2 of 11sectors, such as animal feeding, to reduce its environmentalimpact.Therefore, the objective of this study was to investigatethe effects of the supplementation with polyphenolsobtained from OMWW in the diet of Saanen goat kidson growth performance and meat quality. In particular,meat proximate composition, texture and colorimetricproperties, fatty acid composition, lipid oxidation and thelevel of the different forms of myoglobin of Longissimusthoracis et lumborum (LTL) muscle were evaluated.MethodsAnimals, experimental design and diet compositionAll experimental procedures were approved by the EthicalCommittee on Animal Research of the University ofNaples (Protocol number: 2014/0105988 of 1st December2014), and the study was carried out in accordance withEU Directive 2010/63/EU for animal experiments.The trial was performed on 18 Saanen female kidsmaintained in the experimental farm of CREA (ResearchCentre for Animal Production and Aquaculture) locatedin Bella (PZ), in the South of Italy, at 40 75′ latitude and15 67′ W longitude, and 802 m above sea level. The kidswere allowed natural suckling until weaning, that occurredat 69 days of age. After weaning the animals were dividedinto 2 homogeneous groups, according to age and livebody weight (LW), recorded at both birth and weaning:Control (C) group (n 9): received a fattening standarddiet (Table 1); Polyphenols extract (PE) group (n 9):Table 1 Ingredients (%) and proximate composition (% of drymatter) of the basal diet administered to the kids throughoutthe experimental periodIngredients (%) of concentrate administeredMaize meal60Faba bean (Viccia faba minor)15Alfalfa pellets5Soybean meal5Wheat bran10Oat5ConcentrateDehydrated alfalfaDry Matter (g/100 g weight)87.585.6Ash2.78.3Crude protein11.819.5Crude fiber6.1925.6Neutral detergent fiber18.237.5Acid detergent fiber8.934.3Lignin2.19.8Ether extract3.81.9Non structural carbohydrates63.525.6Starch56.8–
Cimmino et al. BMC Veterinary Research (2018) 14:181received the same diet of control group, supplementedwith a powder of polyphenols extract from OMWW(3.2 mg/day, see below). The amount of polyphenolspowder was defined according to antioxidant activity(see below) and some studies performed in growinglambs [5].The kids of each group were individually penned inboxes (1 m2) throughout the study that lasted 78 days.All kids had free access to water and received the sameration, consisting of alfalfa hay ad libitum and a starterconcentrate administered in increasing amount accordingto the growth following the recommendation of NationalResearch Council [20]. Feed was administered twice a day,at 8.00 and 16.00 and polyphenols powder was mixed ondaily bases with the concentrate in the PE Group. Theinclusion level of polyphenols extract was variablethroughout the study according the amount of administered concentrate from 1.70% at the start of the trial to0.83% in the last week (1.16% on average). Feed intakewas determined from orts (refusals) collected daily in themorning (when present) before the next feed administration.The amount and the composition of orts were utilized tocalculate the dry matter (DM) intake and the compositionof the ingested diet. Individual feedstuff and orts weresampled every 15 days and the analyses were carried out asper AOAC (Association of Official Analytical Chemists)procedures [21] after drying at 65 C and mechanical reduction of the samples (granulometry 1 mm for all analyses).The chemical composition of individual feedstuff is reportedin Table 1.Each animal was individually weighed 10 days apartand average daily gain (ADG) was calculated by dividingthe difference between two consecutive LW measurements (LW1 and LW2) with the number of days elapsed(LW2 LW1/days).Polyphenols determinationPolyphenols extract from OMWW was obtained andcharacterized as reported by Parrillo et al. [22]. Briefly,the polyphenolic extract was obtained by membraneseparation of OMWW according to previous studies[23] and the main phenolic compounds were identifiedby HPLC (LC-4000 Series Integrated HPLC Systems,JASCO, Japan) according to Azaizeh et al. [18] (Table 2).Total phenols content in OMWW extract was determinedby the Folin-Ciocalteu method [24]. The antioxidantactivity of the OMWW extract was evaluated by usingthe free radical ABTS (2,2-Azino-bis-3-ethylbenzothiazoline-6-sulfonic acid), according to the proceduresdescribed by Re et al. [25].Slaughtering procedure and muscle samplingAt the end of the experimental period (147 days of age),all the kids were left overnight with ad libitum access toPage 3 of 11Table 2 Main phenolic compounds of olive mill wastewaters(OMWW) extractsMain onoid32783.35Tyrosol39474.03Caffeic acid999110.20Verbascoside17,44917.82Hydroxytyrosol derivatives (OHTY-glycol,OHTY-glucoside, 3,4-diidrossifenilethanol –3,4-DHPEA Elenolic acid mono-Aldehyde,3,4-DHPEA– AC hydroxytyrosol acetate)26,82627.40Verbascoside derivatives isoverbascoside)64986.64Other derivatives of cinnamic acid (cinnamic acid,o-, p- coumaric acid, ferulic acid)33723.44Caffeic acid derivatives (chlorogenic acid,neochlorogenic acid, 1-O-caffeoylquinic acid,3,5-O-dicaffeoylquinic acid)46814.78Other polyphenols10551.08Total polyphenols (TPC) (mg/kg)97,926Antioxidant activity (mmolitrolox/kg sample)8521water and slaughtering procedures were carried out inaccordance to the EU Regulation 2009/1099/EC on theprotection of animals at the time of killing. The animalswere stunned by captive bolt and the exsanguinationfrom the jugular vein was carried out. After slaughtering,evisceration and dressing, each carcass was weighed andthe pH was measured 45 min post-mortem in the LTLmuscle (between 11th and 13th thoracic vertebra), usingan automatic digital pH-metertest-205 (TestoInc, Sparta,NJ, USA), equipped with a penetrating electrode. Theprobe was calibrated with pH 4 and 7 standard buffersolutions. The dressed carcass comprises the body afterremoving skin, head, fore feet (at the carpal–metacarpaljoint), hind feet (at the tarsal–metatarsal joint), lung,heart, liver, spleen, kidneys, kidney fat, and gastrointestinal tract fat. Furthermore, the stomachs(rumen, reticulum, omasum, and abomasum) and thepostruminal tract (intestine and caecum) were removed.Dressing percentage (DP) was calculated according to thefollowing formula:DP ¼ ðhot carcass weight live weightÞ x 100All carcasses were stored at 2 C for 24 h. Ultimate pHwas assessed 24 h post-mortem on LTL muscle and thecarcasses were weighed again. After that, a professionalbutcher removed the LTL muscle, between the sixththoracic and 5th lumbar vertebra, from the right side ofeach carcass. LTL samples were stored at 4 C and used
Cimmino et al. BMC Veterinary Research (2018) 14:181Page 4 of 11for chemical analysis, meat quality evaluation and oxidativestability. Furthermore, pH was also assessed 48 h postmortem on LTL muscle as described above.Color difference (ΔE*) between each day of storageand the day 0 was calculated as follows:Chemical analysesWhere AL*, Δa*and Δb*are the differences between L*,a* and b* values at time 0 and the individual readingseach day.Metmyoglobin (MMb), deoxymyoglobin (DMb) andoxymyoglobin (OMb) percentages were estimated according to [30] on the basis of the Reflex Attenuance (A) at theisobestic points 572, 525, 473 and 730 nm (nm). TheReflex Attenuance (A) was identified as:All analyses were carried out in the Laboratories of theDepartment of Veterinary Medicine and Animal Production(DMVPA), and Department of Agriculture Sciences (DIA)of University of Naples Federico II (Italy). The chemicalcomposition of LTL muscle was determined on refrigerated(4 C) samples according to the AOAC procedures [26] byusing a Foodscan equipment (Food Scan Lab 78,810). Eachsample was analyzed in duplicate.ΔE ¼ ΔL 2 þ Δa 2 þ Δb 2 1 2A ¼ log ð1 RÞTexture measurementsTenderness was evaluated on meat cooked in a thermostatically controlled water bath at 90 C on day 1 afterslaughtering. To monitor temperature achieved in themiddle of the sample (70 C), a portable digital thermometer (TEMP7 thermometer digital microprocessor forPt100 probes, TECNAFOOD MO, IT) was used. Aftercooking the samples were dried with paper, in order toeliminate the moisture on the surface, and held in acooler at 4 C before coring. A minimum of four coresof 1.27 cm2 from each LTL muscle were obtained parallelto the longitudinal orientation of the muscle fibers. TheInstron 5565 with a Warner–Bratzler shear (WBS) deviceand crosshead speed set at 100 mm/min and a load cell of500 kg [27] was used. According to Girard et al. [28], themeasured parameters were Shear myofibrillar force (SMF)and Warner-Bratzler Shear Force (WBSF) both expressedin kg. Indeed in a shear force curve some peaks of lessimportance may be observed, before and after maximumpositive peak shear force (WBSF). Bouton & Harris [29] related these first small peaks to the myofibrillar componentof shear force coinciding with initial yield (SMF). WBSFminus SMF estimates the connective tissue contribution.Instrumental colorThe color of the meat was determined on the surface ofsamples using a U3000 spectrophotometer, equipped withintegrating sphere (Hitachi, Tokyo, Japan). Althoughilluminant D65 is largely utilized, the use of Illuminant Ais recommended by AMSA [30]. For this reason colorcoordinates, employing the CIEL*a*b* system with twoilluminants, D65 (6500 K) and A (2856 K) and 10 standardobserver, were Lightness (L*); redness (a*), and yellowness(b*) were also calculated, according to AMSA [30]. Thecolor analyses were carried out in duplicate every day, from24 h post-mortem until day 7, on samples (diameter2.54 cm, thick 2 cm) stored at 4 C. The samples wereplaced on white trays and wrapped with oxygen-permeable film.where R expresses the reflectance at a specific wavelengthin decimal (0.30 rather than 30%).Therefore from the Reflex Attenuance (A), it was possibleto estimate the three forms of myoglobin:%MMb ¼ ½1:395 ðA572 A730 A525 A730Þ x100%DMb ¼ ½2:375 ð1 ððA473 A730Þ: ðA525 A730Þ x100%OMb ¼ ½ð100 ð%MMb þ %DMbÞ Fatty acid analysisFatty acid composition of the meat was assessed on freshsamples on day 1 post-slaughtering. The muscle wasblended in a food processor and the lipids were extractedfrom 5 g samples in duplicate, using chloroform:methanol(2:1, v/v) [31]. The extracted lipids were transmethylatedto their fatty acid methyl esters (FAME) according toChristie [32]. The amount of fatty acid (g/100 g of FAME)was determined by gas chromatography using a chromatograph (DANI fast GC, Italy), with a flame ionizationdetector and equipped with a capillary column (TR-CN100) (60 m 0.25 mm diameter 20 μm). Helium wasused as carrier gas at a flow rate of 1.2 mL/min. The splitratio was 50:1, the injector was set at 280 C and thedetector at 240 C. The oven temperature was programmed and held at 80 C for 5 min, then increasedto 165 C at 5 C/min, held at 165 C for 1 min, andthen increased to 260 C at 3 C/min, and then held at260 C for 1 min.Identification of each fatty acid was obtained by comparing the chromatogram with the reference standardmixture of Supelco 37 component series FAME MIX(Supelco Bellefonte, PA, USA) and a mixture of CLAisomers (Nu-Chek-Prep, Inc., Elysian, MN, USA). Retentiontime and area of each peak were calculated using the Claritysoftware (Clarity v.2.4.1.77, Data Apex Ltd., 2005). Theatherogenic index (AI) and the thrombogenic index (TI)were obtained by using the following equations [33].
Cimmino et al. BMC Veterinary Research (2018) 14:181AI : ½ð4 x C14 : 0Þ þ C16 : 0 þ C18 : 0 ½ΣMUFA þ ΣPUFA n6 þ ΣPUFA n3 TI : Page 5 of 11Table 3 Age and weight at weaning and at slaughter, averagedaily gain (ADG), feed consumption, carcass characteristics anddressing percentage in Control (C) and polyphenols extract (PE)group (mean values SEM)GroupsC14 : 0 þ C16 : 0 þ C18 : 0Þ ð0:5xMUFAÞ þ ð0:5 PUFA n6Þþð3xPUFA n3Þ þ ðPUFA n3 PUFA n6Þ SignificanceCPEPAge at weaning (days)69.8 1.3068.9 1.500.65Age at slaughtering (days)146.8 1.30145.9 1.500.65Weaning body weight (kg)11.0 0.7510.7 0.860.78Final body weight (kg)17.9 0.9918.6 1.280.69Evaluation of lipid oxidationWeight gain (kg)6.94 0.607.93 0.610.26The evaluation of lipid oxidation in meat was based on thedetermination of malondialdehyde (MDA), a secondarylipid oxidation product (nmol/μg of meat). MDA wasdetermined by a specific kit (Lipid Peroxidation (MDA)Assay Kit, Sigma-Aldrich, USA) according to the manualinstructions. MDA was quantified by spectrophotometricanalysis (Model 680 Microplate Reader, Biorad, Italy), at awave length of 532 nm. MDA content was evaluated at 1,3 and 7 days post-slaughtering.ADG (kg/g)0.09 0.010.10 0.010.26Concentrate intake (kg/day)0.30 0.000.29 0.000.33Hay intake (kg/day)0.68 0.010.67 0.010.39DM intake (kg/day)0.84 0.020.85 0.030.57Carcass weight atslaughtering (kg)10.0 0.5110.0 0.770.98Carcass weight at 24 h (kg)9.7 0.509.7 0.740.99pH at slaughtering6.8 0.116.8 0.120.90pH at 24 h5.8 0.035.8 0.030.64Statistical analysisDressing at slaughtering (%)55.8 1.4154.0 0.480.15The experimental data were subjected to one wayanalysis of variance (ANOVA) using the linear model ofthe SAS software [34], following confirmation of normalityand homogeneity of variance. The influence of dietarytreatment (polyphenols supplemented diet or controldiet),storage (day 1, 3 and 7) and their interaction (dietarytreatment x storage) were used as main factors to analyzecolor parameters, MDA levels and the different forms ofmyoglobin. Results are presented as mean values withstandard error of mean (SEM). The mean were comparedusing the Student’s t-test. The differences were consideredsignificant when P values were lower than 0.05, whereas atendency was considered for P 0.10.Dressing at 24 h (%)54.6 1.3952.3 0.450.14ResultsAnimal performance and carcass characteristicsThe effects of polyphenols supplementation on growthperformance and carcass properties are shown in Table 3.A similar ADG from weaning to slaughter and a similarweight at slaughter were observed in the two Groups.Furthermore, carcass weights and yields were similarbetween groups at 0 and 24 h post mortem (Table 3). Nosignificant differences were observed in the pH declinevalues between the groups both at 45′ minutes and 24 hpost-mortem (Table 3).Meat qualityA similar meat chemical composition was recorded in Cand PE group (Table 4).The texture assay highlights a double peak (SMF 1stpeak and WBSF 2nd peak)in 9/9 animals of C samplescompared to 3/9 animals of PE counterparts. SMF valuesobtained by deformation curves where a double peak wasevident, tended to be higher (P 0.06) in PE compared toC group, whereas similar WBSF values were recorded(Table 5).The color coordinates detected by using the twoilluminants (A and D65) were similar between the twogroups. In fact, although the illuminant A would givemore emphasis on the proportion of red wave lengths,no significant differences were recorded in lightness(L*); redness (a*), yellowness (b*) between the two groupsand throughout the storage. Furthermore, no significantinteraction storage x treatment was assessed. Slight differences were observed in color differences (ΔE*) during theTable 4 Proximate meat composition of LTL muscle in control(C) and polyphenols extract (PE) group (mean values SEM)GroupsCSignificancePEPMoisture (%)66.6 0.4664.1 0.350.11Fat (%)13.7 0.4616.5 0.310.09Protein (%)18.3 0.3018.7 0.400.43Collagen (%)2.3 0.283.0 0.160.14Ash (%)0.91 0.120.84 0.050.58pH*6.1 0.016.2 0.010.51*pH was assessed on LTL sample 48 h after slaughtering
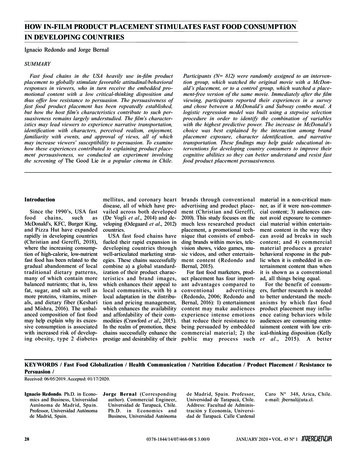
Cimmino et al. BMC Veterinary Research (2018) 14:181Page 6 of 11Table 5 Shear myofibrillar force (SMF) and Warner-Bratzler ShearForce (WBSF) recorded in the LTL muscle of control (C) andpolyphenols extract (PE) group (mean values SEM)GroupsCSignificancePEPWBSF, kg4.5 0.104.6 0.100.86SMF, kg0.53 0.071.14 0.330.06first three days of storage in the meat of PE Group compared to the control when analyzed by illuminant A, whilean opposite trend was recorded with the illuminant D65.In any case, no statistical differences were recorded (Fig. 1)and subsequently the changes showed the same trend withboth illuminants.Neither dietary treatment (P 0.77 and P 0.99, forOMb and MMb, respectively) nor storage period (P 0.33and P 0.10, for OMb and MMb, respectively) and theirinteraction (P 0.98 and P 0.95, for OMb and MMb,respectively) influenced the estimated levels of myoglobinforms. As expected, during the storage period, the estimated level of MMb tended to increase in both groups,while the levels of OMb decreased until 3 days andincreased after 7 days of storage (Table 6).Fatty acid composition and oxidative stabilityThe fatty acids composition of LTL intramuscular lipids inthe two groups is shown in Table 7. Dietary polyphenolssupplementation determined a decrease of short chain fattyacids ( C12:0) as well as of Myristic (C14:0) Myristoleic(C14:1), Pentadecanoic (C15:0), Palmitic (C16:0) andPalmitoleic (C16:1) acids.A significant lower (P 0.01) percentage of saturated(SFA) and higher (P 0.05) proportion of monounsaturated(MUFA) fatty acids were recorded in PE group comparedto C group. However, no differences were recorded in theatotal amount of polyunsaturated fatty acids (PUFA), whilethe unsaturated fatty acids (UFA):SFA ratio was influencedby the treatment (P 0.01). Furthermore, the PUFA:SFA(P:S) ratio tended to be higher (P 0.09) in PE group, compared to C group. Therefore, the meat of PE group was alsocharacterized by a significant lower AI index (P 0.05) andTI index (P 0.01), compared to the control counterparts.In relation to lipid oxidation, a significant effect of dietary treatment was observed. In particular, lower (P 0.05)MDA values were recorded in PE group, compared to Cgroup (0.25 0.005 and 0.15 0.005 in Group C and PE,respectively), as showed in Fig. 2, whereas neither thestorage (P 0.96) nor the interaction storage x dietarytreatment (P 0.97) influence the results.DiscussionThis study aimed to ascertain the influence of dietarypolyphenols administration on growth performance andmeat quality in kids. Contrasting results have been reportedon the effects of plant extracts administration on live weightgain, carcass weight and dressing percentage either in ruminants [35, 36], and not ruminants [11, 37]. According tosome authors [37] no adverse effect on growth performanceor protein and aminoacids digestibility were recorded inbroilers after 2.5 g/kg of grape seed extracts administration,while a delayed growth rate was observed after 5 g/kgof supplementation. On the contrary, other authors[38] report an increase of final body weight and DWGin broilers fed dietary polyphenol-rich grape seed. Fewstudies have been performed in ruminants till now.Similar growth performance were observed in growinglambs fed a diet supplemented with grape pomace, vitaminE or grape seeds extract [39]. Similarly, the supplementation of the diet with pomegranate seed pulp [40] or withvitamin E, Turmeric powder or Andrographis paniculatapowder [35] did not affect the growth of kids.Also in our study, growth performance was not influenced by dietary polyphenols supplementation, but somebFig. 1 Difference of color (ΔE) by 1 to 7 days of storage with illuminant D65 (a) and illuminant A (b), in control (c) and polyphenols extract (PE)group (blue) and treated (green) group. The error bars represent standard error
Cimmino et al. BMC Veterinary Research (2018) 14:181Page 7 of 11Table 6 Estimated levels (mean percentage SEM) ofmetmyoglobin (MMb) and oxymyoglobin (OMb), in the LTLmuscle of control (C) and treated (PE) group, throughout thestorage at 4 CGroups 1MMb CPEOMb CPE237Table 7 Mean fatty acid composition (g/100 g of FAME) of LTLmuscle in control (C) and polyphenols extract (PE) group (meanvalues SEM)GroupsSignificanceFatty AcidsCPEP40.73 1.88 45.28 1.18 53.57 1.67 61.78 3.60 C12:02.93 0.50 B0.35 0.40 A0.00140.99 1.94 47.67 1.52 54.41 1.88 63.37 3.94C12:00.45 0.360.20 0.070.0668.93 2.70 34.04 3.04 15.07 3.24 43.87 9.42C14:04.00 0.5862.66 7.02 38.13 4.83 21.42 5.69 51.48 10.28C14:1C15:00.58 0.06C16:023.81 0.85BC16:13.05 0.41bC17:01.12 0.171.17 0.140.79C17:11.33 0.170.91 0.140.08C18:015.60 1.2514.31 1.02aspects need to be considered. First of all about 8000phenolic compounds have been identified in differentplant species [11] and in different amounts, creatingserious difficulties in making a comparison among thestudies. Furthermore, fewer information is present onbioavailability of phenolic compounds in ruminants andtheir effects on bacterial rumen population, fermentationand absorption [10] compared to non-ruminants [11]. Itcan not be ruled out that different compounds and/ordifferent amounts of polyphenols may lead to differentresults.Also the proximate composition of the meat in our trialwas not influenced by dietary polyphenols supplementation. This result is in agreement with previous studiescarried out in goat, in which dietary herbal antioxidants[35] or vitamin E [36] were administered. Similarly,vitamin E supplementation did not affect carcass traitsand dressing percentage in lambs [41]. Regarding thetexture, the meat of control kids showed the occurrencein all samples of an initial yield putatively related to themyofibrillar component of shear force and classified asshear myofibrillar force [29]. On the contrary, a singlepeak was recorded in 6/9 animals of the PE group. Forthis reason, SMF values tended to be higher in PEgroup compared to C group. However, no differenceswere recorded for WBSF. This last result may indicatea similar collagen content of the meat recorded in thetwo groups. The evaluation of the contribution of eithermyofibrillar and connective tissue to meat texture afterthe cooking process can not be obtained without performing additional measurements [28]. Some authors [42, 43]suggested that the connective tissue contribution may berecorded by subtracting the initial yield from the shearforce peak: although the shear force does not accuratelyrepresent the contribution of connective tissue to muscletenderness [27, 44, 45], it may be hypothesized a largercontribution of the connective component to the finalhardness in the control group, compared to the PEcounterparts.
Crude protein 11.8 19.5 Crude fiber 6.19 25.6 Neutral detergent fiber 18.2 37.5 Acid detergent fiber 8.9 34.3 Lignin 2.1 9.8 Ether extract 3.8 1.9 Non structural carbohydrates 63.5 25.6 Starch 56.8 – Cimmino