Transcription
Munich Personal RePEc ArchiveRecent developments in investment fraudand scams: Contracts for Difference(‘CFD’) spread betting and binaryoptions and foreign exchange (‘Forex’)sometimes collectively known as ‘forbin’– the UK experience.BARNES, PAUL6 March 2018Online at https://mpra.ub.uni-muenchen.de/85061/MPRA Paper No. 85061, posted 08 Mar 2018 10:49 UTC
1Recent developments in investment fraud and scams: Contracts forDifference (‘CFD’) spread betting and binary options and foreign exchange(‘Forex’) sometimes collectively known as ‘forbin’ – the UK experience.Paul t.comAbstractThis paper discusses investor trading schemes for CFDs, spread betting, binary options and forex, whatare effectively financial derivatives, designed for investors to speculate on market movements. It isargued that it is not possible for investors to consistently ‘beat the market’ unless they have insideinformation and frequent trading will result in losses. It is also shown how these derivatives are usedin scams and frauds designed to dupe naïve investors. The final section of the paper examines howthe UK regulators, principally the Financial Services Authority (later the Financial Conduct Authority)have attempted to combat fraud and abuse and their prosecuting and preventative efforts.KeywordsStocks, shares, securities, contracts for difference, CFD, spread betting, binary options, forex, forbin,scam, fraud.
21. INTRODUCTIONOver recent years there have been efforts by the UK authorities such as the FSA/FCA,i the City ofLondon Police and the Serious Fraud Office to prosecute and deter investment scams involving boilerrooms selling shares in fake companies, the perpetrators stealing investors’ funds (Barnes, 2011b,2013, 2016). As a result of this clampdown, fraudsters have looked to other types of ‘investments’ tosell, such as fine wines, carbon credits and foreign exchange but they have continued to sellinvestments in shares in different forms. That is, perpetrate scams involving well-known andestablished ways of profiting from share price movements without owning the shares through the useof what are effectively ‘derivatives’. These include contracts for difference (‘CFD’), spread betting andwhat are known as ‘binary options’ or ‘binary bets’. These, together with foreign exchange (‘forex’)speculation, usually also by means of CFDs, are often referred to as ‘forbin’. Put and call options areoutside this grouping and not discussed. It is the purpose of this article to look at these types of‘investments’, how they are marketed and whether they are scams in the same way as shares in fakecompanies and how the authorities attempt to regulate those involved. The article is arranged asfollows, we first examine how these derivatives work and how they are priced. We then examine thepotential profitability of trading strategies. Finally, we examine the law as it relates to these activities,how fraudsters may use these to defraud investors and the record of regulators to prosecuteperpetrators and protect victims.2. WHAT ARE CFDS, SPREAD BETTING AND BINARY OPTIONS, ‘FORBIN’?An individual may invest in, buy or sell stocks and shares, bonds, foreign currency or commodities (e.g.gold, precious metals and natural gas) subsequently referred to as ‘assets’ through a broker, bank orother type of financial institution handling this kind of business. An individual may also effectively beton changes in the price of these assets without actually owning them by means of forbin. Forbinenables a ‘punter’ (this term is used rather than ‘investor’, because no money is being ‘invested’) to‘bet’ (this term is used rather than ‘invest’, because that is what the transaction effectively is) on arise or a fall in an asset’s price, without going to the trouble and expense of owning the asset. If thepunter forecasts or guesses correctly, he/she wins the bet but, if they lose, they also lose the money‘invested’ (henceforward referred to as the ‘stake’).Forbin are contracts between two or more parties based upon the asset or assets whose value isdetermined by, or fluctuations in, that asset. Their advantage is that the punter commits a minimumamount of money. In financial terminology, the deal is highly levered. Another advantage is that forbin
3provide an easy way of betting on a fall in the share price – a much easier way, in the case of securities,than short selling which involves their ownership.A CFD is an agreement between two parties (the broker and the punter) to pay the difference betweenthe opening price and closing price of an asset. It enables a punter to trade on live market pricemovements (‘spot’ prices) without actually owning the asset concerned and to speculate on theirfuture movement, whether rising or falling. Say a punter wishes to bet that a particular stock will risewhen its current price is 140-140.5p and he/she places a trade to buy (i.e. ‘goes long’) 10,000 sharesas a CFD. The punter is required to make a deposit (referred to as a ‘margin’) usually between 1% and10% of the value of the trade. Say, the price rises to 145-145.5p and the punter decides to close his/herposition. Let us assume that the commission on the trade is 0.2% and there are no financing charges.In which case, the punter makes a profit of 450 [10,000(145 – 140.5p)] less the commission of 57.10[( 14,050 X 0.2%) ( 14,500 X 0.2%) as the selling price is 145p] net 392.90. There is also an implicitcharge effectively paid to the broker: the ‘bid-ask spread’, the difference between the price the broker‘asks’ for the stock (the ‘ask price’) here 145.5p, and the price the broker will buy the stock at (the ‘bidprice’) here 145p.Say instead, the punter wishes to bet that the stock will fall and places a trade to sell 10,000 shares asa CFD (i.e. ‘goes short’). As we know, the stock’s initial price was 140-140.5p and, say, the punterdecides to cut his/her losses and close their position when the stock’s price is 145-145.5p. In whichcase the punter makes a loss of 450 [10,000(145 – 140.5p)] plus the commission of 57.10 ( 14,000X 0.2%) ( 14,550 X 0.2%), a total cost of 507.10, again assuming there is no financing charge.A few points about this: it would have cost the punter 14,500 to buy 10,000 shares but becausehe/she is using a CFD, they will only be required to make a deposit, say 5%, in which case 702.50(10,000 X 140.5p X 0.05). This means that a punter can make a much larger bet for the same amountof money using a CFD rather than purchase the stock. With a 5% margin, the punter may make a bet20 times as large for the same initial payment. However, the risk is correspondingly increased and aloss could exceed the deposit. For example, in the second case, because the punter lost 507.10 thedeposit carried forward has fallen from 702.50 to 195.40. In this illustration, there was no financingcharge. This may not always be the case, especially if the contract is extended beyond the current dayof trading when ‘overnight’ fee may be charged based on current interest rates and the length of theholding period.
4Spread betting is similar. It enables the punter to trade on price movements of these types of assetswithout actually owning them, again, whether rising or falling. Say the punter wants to go long (‘buy’)shares which are currently trading at 548 - 550p and he/she decides to place a buy spread bet of 10per point. This means that, for each penny the shares rise above 550p, the punter would make 10profit. The value of the spread bet is 5,500 ( 10 x 550p). The margin required, again, is typicallybetween 1% and 10% of the value of the position, say 5%, in which case it would have been necessaryto deposit 275 ( 5,500 X 5%).A binary option (sometimes referred to as an ‘all-or-nothing option’ or ‘fixed-return option’) is afinancial option in which the payoff is either a fixed monetary amount (win) or nothing at all (lose). Itis necessary to clarify the term: an ‘option’ is an agreed right to buy or sell an underlying asset at aspecified price within a specified timeframe. As binary trading does not involve the right to buy anunderlying asset, technically, it is not an option and, in this sense, the term is misleading and incorrect.A binary option is little more than a simple bet, hence the more appropriate term ‘binary bet’. Forexample, a bet whether the price of an asset will rise above or fall below its current price. If the punterchooses the correct direction, he/she wins and receives typically between 70 % and 100% of the stake;if he/she is incorrect, they lose the entire stake. (This is referred to as a ‘high/low binary option’.) Saya punter bets that the FTSE 100 would fall in 15 minutes and at the end of that period it is lower andthe broker pays 85% of the stake on a win, he/she makes a profit of 37.50 ( 50 X 0.85). However, saythe FTSE 100 rose, the punter would lose the 50.There are many variations to the bets available for the punter, e.g. ‘one touch’ binary options wherethe punter can bet that an asset price will (or will not) touch (or reach) a specified price, and ‘zonebinary options’ or ‘boundary trading’, in which the punter can bet that an asset price will be within (oroutside) a specified range up to the maturity of the option. Often, no commission and financial chargesare made for binary options as the terms of the trade are sufficiently profitable for the broker. Theremay be no margin required, providing an incentive for the punter but increasing the risk considerably.A broker may also offer bonuses to punters to encourage them to trade. All of these trades havevariations and some have substantial pay-outs (as high as 300%) for example, in order to achieve thepay-out in a ‘one touch trade’, the punter would need to opt for a price that would be hard to reach.Bonuses have been an important marketing device for binary options attracting controversy. Theoffers of free money or matching deposits with bonuses are made not only because the broker expects
5they will attract new business but also because they are unlikely to be paid out. Most importantly, thebonus is not a cash bonus but a leverage-based bonus, i.e. it is added to the deposit, thereby raisingthe amount available to bet, causing the punter to risk larger amounts of money and the initial depositmore quickly.The motives behind these types of bonuses have been recognised by commentators and regulators,and punters have been urged not to take up the offers or, at least, study the terms and conditions. Insome countries, e.g. France, brokers have been particularly aggressive, promising bonuses of up tofive times the amount of a client’s deposit to attract more traders. As a result of complaints, theEuropean Securities and Markets Authority (ESMA) published a guideline in October 2016 mandatingnational regulators to withdraw the deposit bonus system. Whilst most regulated brokerage firmscomplied with the new requirements, others complied but offered unregulated products containingbonuses for clients to transfer their trading to, others started offering bonuses to clients from outsidethe EU.Currency trading, commonly referred to as ‘forex’, is usually done by means of CFDs. Forex is thelargest financial market in the world, with US 1.5 trillion changing hands every day. The market is veryliquid, meaning it is easy to buy and sell currencies, and the market is open 24 hours. In the UK tospeculate in forex as an investment, an individual may open a CFD account with a CFD broker, or aspread betting account, rather than have buy and sell the currency. In the US, where spread bettingand CFDs are not available, it is necessary to open a forex trading account with a specialist forexbroker.Finally, a note about some technical terms relating to forex. All forex is quoted in terms of one currencyversus another, i.e. a ‘base’ and a ‘counter’ currency. For example, in the case of the Euro, EUR/USD,EUR is the base currency and USD (US dollar) is the counter currency and is expressed as the value ofone Euro in US dollars. If the punter thinks the base currency will rise (‘strengthen’) and/or the countercurrency will fall (‘weaken’) he/she will buy (i.e. ‘go long’) Euro. If he/she thinks it will weaken, he/shewill sell (i.e. ‘go short’). Most currencies are quoted to five decimal places where the change in thefourth decimal place (0.001) is referred to as a ‘pip’. So, if EUR/USD moved from 1.33800 to 1.33920,it is said to have risen by 12 pips. A ‘lot’ (as in ‘price per lot’) is the standard trading term for an orderof 100,000 units of the base currency. The term ‘round term’ refers to a single completed trade, i.e.both a buy and a sell, as opposed to half of the full trade, i.e. a buy or a sell.
6Just a few other basics: spread-bets usually have a fixed timescale whereas CFDs do not. ‘Long’ CFDpositions attract daily finance charges and ‘short’ CFD positions earn interest. But no time-relatedcharge or benefit applies to spread-betting. Spread betting and binary trading wins are exempt fromcapital gains tax as they are classed as gambling and not taxable in the UK but CFD profits are liable tobe taxed. On the other hand, spread-betting and binary trading losses are not deductible against tax,while CFD losses are. However, if that transaction is for commercial purposes (e.g. if it is madestrategically as a hedge to offset the risks attached to direct investment in a security) any profits thatarise from it may be regarded as part of a wider pattern of activity and taxable. Also, all three avoidstamp duty (the current rate for UK shares is 0.5%) as they do not involve actual share ownership. Forcomparisons, see Table 1. It is usually necessary to pay the broker within three days. However, thismay be extended, typically to 5, 10, 20 or 25 days, known as a ‘T’ settlement system and referred toas ‘T-5’ and so on.ii This may have the effect of creating a CFD in which the punter is able to buy andsell before the pay date.Table 1.Forbin types and direct purchase/sale of assets comparedCFDSpread bettingBinary optionsCommission0.1% - 0.5% of thevalue of the trade.0.1% - 0.5% ofthe value of thetrade.‘Bid-ask’SpreadDeposit or‘Margin’implicitImplicitDepends on theoption’s terms;none may berequired.ImplicitRequired.1% - 10% of thevalue of the trade,typically 5%.Depends on theoption’s terms;none may berequired.NoneFinancial‘overnight’fees[Annual ormonthly LIBORrate, or similar ,(depending onwhether long orshort)administrationcharge] X value ofthe tradeLiable to capitalgains taxNoneRequired. 1% 10% of thevalue of thetrade, typically5%.Daily fundedbets (‘DFB’)charged bybroker.Depends on theoption’s terms;none may berequired.Not relevantNoneNoneNoneNoneLiable to capitalgains tax0.5%Tax on profitsStamp dutyDirectpurchase/sale1% - 2% of thevalue of the trade.implicit
7RegulationFSA/FCA, A, FinancialOmbudsman,previously, UKGamblingCommissionFSA/FCA, FinancialOmbudsman3. TRADINGA punter may make his/her own trading decisions, use the broker’s expertise or even employ aprofessional. Brokers offer various levels of service. ‘Execution only’ is restricted to execution oftrades without the client receiving any advice about the merits, risk or suitability of an investment.Alternatively, an advisory service may be provided by the broker at a cost in which the punter makesthe final decisions but the broker offers advice. A discretionary service may also be available in whichthe broker manages the portfolio. It is assumed here that the investor makes the decision and thissection discusses the strategies available.Whilst a punter cannot theoretically out-perform the market in the long term (this is discussed later),he/she can adopt certain strategies to maximise their returns:(1) day trading where a punter buys if he/she considers the price to be relatively low or sell if theyconsider it relatively high. The concept of prices moving randomly between ‘tramlines’ is sometimesused to illustrate the point and explained later,(2) taking a more strategic holding if he/she thinks there is likely to be a major shift or correction (e.g.Brexit) and(3) by means of consistent buying or selling on a massive scale to affect a price and force it up ordown.iiiThe problem with (1) for the non-professional is the transaction costs (the bid-ask spread plus feesand commissions) which may be large relative to the usual daily price changes. Having said that, eventhough, theoretically no one can consistently and significantly out-perform the market, anexperienced trader may trade successfully assuming the transaction costs are minimised and an expertwith an understanding of the economic factors relating to the asset in question (whether it be acompany, commodity or currency) may be able to make an informed long-term forecast of likely priceshifts and corrections.
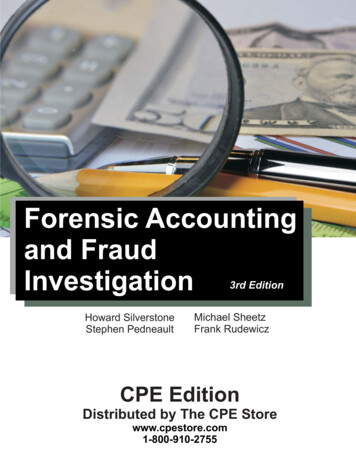
8Trading strategies.There are two ‘rational’ approaches to buying and selling shares: computing what a share istheoretically worth (its ‘intrinsic value’) and comparing this to the market price. If the intrinsic valueis significantly greater than the market price, the punter would buy the stock; if it is below the marketprice, he/she would sell. This is sometimes referred to a ‘fundamental analysis’.Calculating intrinsic values is not the only basis on which an investor may decide to buy or sell shares.An alternative is a ‘behavioural’ rather than a rational approach and known as ‘technical analysis’ orchartism’. A chartist is someone who studies charts of the movement of an asset’s prices over timelooking for patterns in the hope of predicting future price changes from previous trends. Chartistsbelieve that all the important information about a company's performance is already reflected in ashare price and represents what investors believe to be its intrinsic value. The study of pricemovements is, therefore, all that is necessary to make investment decisions. Chartists argue it is anart involving intuition, experience and skill; given the same graph, two chartists are likely to interpretit in different ways and make different buy and sell decisions.It is not possible to fully explain chartists’ techniques here but we can examine some of the basicprinciples and tools. As mentioned earlier, rational investors buy or sell when the difference betweena stock’s market price and what they consider to be its intrinsic value is sufficient to cover the‘transaction costs’ involved in buying and selling. Transaction costs will therefore help the price staywithin those bounds. If the share price moves outside what are sometimes referred to as ‘tram lines’,this may be interpreted as a revision in investors’ beliefs about the intrinsic value. See Figure 1 for anexample.ivChartists also believe that investors are conscious of the price at which they bought a share. Say ashare has been traded around 100p over a long period during which many investors bought. Supposethe price fell to 80p. Chartists believe that those investors who had bought at 100p would not beprepared to take the loss but simply wait for it to rise to above 100p. As a result, the price of 100pbecomes a ‘resistance area’. Each time the share price falls below 100p again, the theory holds thatthe resistance level becomes even harder to cross as more investors will have bought at that price orabove. An extension of this psychology is the ‘support level’ or ‘support area’. A chartist may arguethat those investors who sold shares when the market was low and saw the share price rise, would bekeen to buy it again at the price at which they sold. If this is so, the original level (100p in theillustration) also becomes a support area which becomes stronger on each successive fall. Therefore,
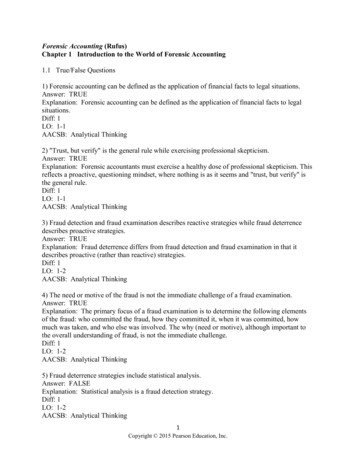
9if a share price drops to a support area and it then begins to rise, other traders may soon join in forcingthe share price up leaving the resistance area behind.Figure 1Daily share prices (pence) between 8 November 2017 and 8 February 2018 for Whitbread plcshowing tramlinesSo far, we have assumed that there is no change in the asset’s intrinsic value, i.e. the ‘tram lines’ arehorizontal. A share price may ‘break out’ of these, veering upwards or downwards. Let us say, theformer; in which case, there will be pressure for it to continue in that direction and a rising tram linewill be the result. There are other recognizable patterns. Probably the most famous is the ‘head andshoulders’. This is a large price rise that is eventually halted, perhaps by profit taking by existingshareholders. As a consequence, the share price falls for a short period before continuing its steeprise. This is the first ‘shoulder’. The rise cannot continue indefinitely and the price will eventually peak.A similar situation may occur on the way down. The shoulder in this case represents a temporary haltin the fall in the share price. Why should such patterns exist? There is one very good reason: ifsufficient investors believe that a recognised pattern is developing and a second shoulder is expected,they will trade on that belief, causing it to happen. See Figure 2.
10Figure 2Daily share price chart between 1 January 2016 and 31 October 2016 for Kolar Gold plc showing‘head and shoulders’.In retrospect, of course, the head and shoulders pattern is recognisable. It may not be so during itsformation (say mid-way through the price hike when in Kolar’s case the price was about 2p) andchartists who were presented with the graph at that time may have disagreed about its likely outcome.Some may have recognised it as a developing head and shoulders whilst others may have not.Some people have suggested various strategies to out-perform the market. For example, ‘Bollingerbands’ (https://www.bollingerbands.com) named after their inventor, Jon Bollinger, refer to upperand lower limits in terms of the distance of the current price from its simple moving average. Thissimple moving average may be based on a specified length of period, e.g. over the past week. Theyare set at above and below this moving average at a distance depending on the volatility of earlierprice changes. Typically, this is set at two standard deviations of the average of earlier price volatilityand should identify conditions in which an asset is under- or over-priced. Some traders wait forvolatility to narrow to help identify ‘breakouts’. See Figure 3.
11Figure 3Daily share price chart between 2 December 2010 and 31 October 2016 for Scotgold plcshowing Bollinger bandsAnother trading ‘strategy’ is the use of the ‘Golden Cross’ to indicate bullish behaviour prompting thepunter to bet on further price rises. Typically, this uses the 50-day simple moving average and acorresponding 200-day moving average. If the former crosses over the latter, this suggests sustainedupward pressure on the asset’s price. See Figure 3. In a similar way, the ‘Death Cross’ indicates bearishactivity when the 50-day simple moving average falls below the 200-day moving average, promptingthe punter to bet on further price falls.There is very little empirical evidence for chartists being able (or unable) to outperform the marketand earn above average returns in this way. One reason for this is because chartists do not necessarilyuse mechanistic buy and sell rules but their skill and intuition in making such decisions. It is, therefore,not possible for a researcher to know and model a chartist’s decision making. As a result, it cannot besaid conclusively that chartism does not work and remains an open question.4. WHY IT IS NOT POSSIBLE TO PROFIT IN THE LONG TERM FROM THESESCHEMESThe principles discussed above in the context of stocks and shares equally apply to foreign exchangeand commodity markets as daily price changes are determined by supply and demand and market
12makers need to balance their books. These markets are ‘efficient’ as in order to achieve this, marketmakers need to adjust their prices immediately to new information. This means that no one can outperform the market (in the sense of getting a significantly and consistently higher return for theirinvestment) without inside information or is able in some way to influence the market. It also meansthat at any point in time no one knows which way a price will move next as they don’t know what thenext piece of news affecting prices and supply and demand will be. As a result, prices are said to followa ‘random walk’, i.e. one price change is uncorrelated with the next price change and is just as likelyto move in one direction or the other. The first person to draw attention to this in respect ofcommodity prices was Kendall (1953), a statistician but the idea was first put forward by Bachelier(1900) and, probably the first person to notice the random nature of commodity prices was Working(1834). The random nature of share prices and the reasons for this became a popular topic ofdiscussion in the 1960s for both statisticians and finance academics (see, for example, Cootner, 1964,and Brearley, 1969). For an authoritative modern review of the evidence see Brearley and Myers(2016) chapter 13. Because this is no longer an interesting empirical question there have been norecently published statistical studies. However, in the case of the three companies whose share pricesare studied in this paper for other reasons, I have computed correlation statistics between a shareprice change on one day and the change the following day. These are shown in Table 2. It will be seenthat the estimated correlation coefficients are very small and not significantly different to zero,strongly indicating that, as expected there is no correlation. (Correlation coefficients range from -1,indicating a negative relationship, to 1, a positive relationship; and 0 no relationship where thenumbers are independent of one another). There is therefore no support the proposition that pastprice changes can be used to forecast future price changes.Table 2Correlation coefficients measuring the correlation between the share price change during one dayand the share price change during the following dayCompanyCorrelationShare price trading periodcoefficientKolar Gold plc-0.003591 January 2016 to 31 October 2016Whitbread plc0.079191 January 2010 to 31 October 2016Scotgold plc-0.006172 December 2010 to 31 October 2016
13Daily price changes may not simply be in response to changes in supply and demand but small revisionsof expectations about a company’s prospects as they affect it future earnings and dividends. The priceimplications of a new piece of news may not be immediately obvious to the market. Not all theinformation may come out immediately. Take for example, the election of Donald Trump as USPresident in 2016. Not only did the market not expect this, it had little knowledge of the likelyimplications and so the immediate change in prices to this information would be preliminary. Onlylater would we learn what his economic and other policies would be and the implications becomeclearer. Prices would then adjust to a more realistic and considered assessment. A less dramaticexample, the likelihood of a takeover bid or the winning of a new contract for a company.Theoretically, the price should change with the probability of the outcome. Say a takeover bid, if itcame, would cause the target’s share price by 30%. Until the final announcement and publication ofthe terms, the share price would only partially adjust to this as it was uncertain. So, if it were 50%likely, the cumulative price increase in response to the news so far would be around 15%. When thefinal announcement is made, the price will adjust to the actual terms. It could, be that the bidderdecides not make the bid and when this is known or realised, the price will fall back to what it wasoriginally reflecting the change in the probability.Regression to the meanIn statistics, regression to the mean is a principle (or law) that states that the variation in the averageof a variable (or number) will decrease as the population increases. Take the tossing of a coin; theprobability of turning a head is 0.5, as is the probability of turning of a tail. If you toss a coin, say twice,the probability of getting one of each is quite low but if you tossed the coin many times the numberof heads and tails would soon converge on 50:50, although not necessarily precisely; if it were tossed100 times, it is unlikely that you would get precisely 50 heads and 50 tails. As an illustration, I obtained100 random numbers between 1 and 100 from a random number database. As will be see from Figure4, their average quickly converges on the theoretical average (50.5) although not precisely. Here, it is52.96.
14Figure 4Chart of the average of 100 random numbers between 1 and 100 (average 50.5) as the sample(‘cumulative average’) is increased to 100 (The first random number was 21, the second 12).In finance, regression to the mean, has particular relevance; for example, in time series data such asearnings per share and price movements. We would expect the standard deviation of average returnsor daily share price movements to decline with the length or size of the sample; in other words, tofollow a random walk. See Figure 5 which shows the rapid regression to the mean of cumulativeaverage daily share price changes for Whitbread for the 100 days between 15 June and 31 October2016.
15Figure 5Cumulative average daily price changes for Whitbread plc15June 2016 to 31 October 2016 (100 days).There is also the matter of transaction costs affecting an investor’s returns from trading. Even thoughthe chance of winning on a binary option may be as high as 0.5, it must be remembered that thepunter needs to do better than that to cover the broker’s costs which may be considerable. What isthe required success rate to at least break even? This may be calculated as follows where theprobability of winning is
binary options’ or ‘boundary trading’, in which the punter can bet that an asset price will be within (or outside) a specified range up to the maturity of the option. Often, no commission and financial charges are made for binary options as the terms of th


![[] 9 IA NCLUDING R THE R OF F](/img/1/modern-auditing-chapter09.jpg)