Transcription
CFA INSTITUTE RESEARCH FOUNDATION / BRIEFTHE VIX INDEX ANDVOLATILITY-BASEDGLOBAL INDEXES ANDTRADING INSTRUMENTSA GUIDE TO INVESTMENTAND TRADING FEATURESMATTHEW T. MORANBERLINDA LIU
THE VIX INDEX ANDVOLATILITY-BASEDGLOBAL INDEXES ANDTRADING INSTRUMENTSA Guide to Investment and Trading FeaturesMatthew T. Moranand Berlinda Liu
Statement of PurposeCFA Institute Research Foundation is a not-forprofit organization established to promote thedevelopment and dissemination of relevantresearch for investment practitioners worldwide.Neither CFA Institute Research Foundation, CFA Institute, nor the publication’s editorial staff is responsible for facts and opinions presented in this publication. Thispublication reflects the views of the author(s) and does not represent the officialviews of CFA Institute Research Foundation.CFA , Chartered Financial Analyst , and GIPS are just a few of the trademarks owned by CFAInstitute. To view a list of CFA Institute trademarks and the Guide for the Use of CFA InstituteMarks, please visit our website at www.cfainstitute.org. 2020 CFA Institute Research Foundation. All rights reserved.No part of this publication may be reproduced, stored in a retrieval system, or transmitted,in any form or by any means, electronic, mechanical, photocopying, recording, or otherwise,without the prior written permission of the copyright holder.This publication is designed to provide accurate and authoritative information in regard tothe subject matter covered. It is sold with the understanding that the publisher is not engagedin rendering legal, accounting, or other professional service. If legal advice or other expertassistance is required, the services of a competent professional should be sought.Cover photo credit: Roland Shainidze Photography / Moment / Getty ImagesISBN 978-1-944960-95-7
CONTENTSForeword. vThe VIX Index: A Gauge of Expected Future Volatility.2Futures and Options on the VIX.5Benchmark Indexes for Futures and Options on the VIX. .7Adding VIX Futures Indexes to Portfolios. 12Conclusion. 18References. 19This publication qualifies for 2 CE credits under the guidelinesof the CFA Institute Continuing Education Program.
FOREWORDMy tenure on Wall Street began at the bottomof the bull market in August 1982, just beforethe 1983 launch of options on the S&P 100 andS&P 500 indexes. As a research analyst coveringindex and stock options, I did my best to extractimplied volatility metrics from their prices. Atthat time this meant using spreadsheet tools(VisiCalc and Lotus 1-2-3) and computerprogramming languages such as Fortran andPascal. Forecasts of volatility for equities werehighly valued by investors as a measure of traders’ uncertainty about a stock or index price fora specific time frame.As it turned out, S&P 100 implied volatility wasone of the few indicators suggesting heightened investor risk expectations just prior to thenow infamous October 1987 crash. In the daysjust before the crash, it moved up to a record30% level. On 19 October the S&P 500 fell anunheard of 20.5% and shaken investors sentimplied volatility that day and week for both theS&P 100 and S&P 500 soaring to levels well inexcess of 100%. For the rest of my long career asa derivatives strategist, I was always grateful forthe lessons learned by studying implied volatility in those early years. It taught me about how“storms” can develop rapidly in quiet equitymarkets and how investor psychology andliquidity pressures can be major factors drivingequity prices.The VIX Index, together with its derivative trading products and indexes, was an outgrowth ofthe attention focused on market barometers ofuncertainty during and after the market turbulence in 1987. As the world’s most widelyfollowed measure of investor sentiment andexpected equity market risk, the VIX is monitored by a wide range of investors—even thosewho never use futures and options. The original VIX Index, launched in 1993, was basedon S&P 100 options, but it has developed itsmethodology to become the VIX we knowtoday. It measures implied or expected volatility of the S&P 500 over the next 30 days, as calculated from near-term S&P 500 option pricesfor a range of stock prices. The VIX calculationmethodology is used for VIX-type indexes inequity benchmarks around the world that haveactive options trading.As vice chair and head of the ResearchCommittee for the CFA Institute ResearchFoundation, I am excited to share with you thepublication of this primer—“The VIX Index andVolatility-Based Global Indexes and TradingInstruments.” Futures on the VIX began trading in 2004 on the Cboe Options Exchangeand options in 2006. Indexes constructed fromthese futures prices serve as benchmarks forexchange-traded funds, exchange-traded notes,and other fund products that investors turn tofor risk management and for taking views onchanges in the volatility expectations of broadequity indexes. The co-authors, Matthew Moranof Cboe and Berlinda Liu of S&P Dow JonesIndices, have been educating investors aboutthe VIX and VIX futures and indexes almostsince the inception of these products. We arefortunate to have them write this Brief to helpbroaden and deepen the knowledge of investorsin this complex and critical area of the financialmarketplace.The many investors that regularly follow theVIX and volatility-trading products are interested in obtaining a deeper understanding ofhow the products behave in various marketconditions. This publication covers all of theseCFA Institute Research Foundation v
Forewordtopics. The distribution of the VIX is positivelyskewed: It may stay below average for long periods but will rise to multiples of average andmedian levels. VIX index levels exhibit meanreversion over time and reflect volatility expectations that are, on average, higher than realizedS&P 500 volatility. (This difference is called the“volatility risk premium.”)VIX futures and associated indexes reflectexpectations for 30-day index volatility out intime. Their returns are correlated with the VIXbut can be significantly above (in contango) orbelow (in backwardation) spot VIX levels. VIXfutures indexes have unique return drivers,including the cost of rolling VIX futures positions, which can be a significant component ofreturns over time. Investors appreciate that VIXfutures and futures indexes have returns thatare negatively correlated with equities and realize that how the futures products perform in aportfolio context is key to using them effectively.Few of us expected to see anything like theextreme levels of October 1987 equity volatilityagain in our lifetimes, but in early 2020, a globalpandemic and its economic fallout descendedupon us—just the type of event that can instillsufficient uncertainty in investors to set newrecords for indexes like the VIX. As this publication was going to press (with data ending inDecember 2019), financial markets were reacting to the developing news of the spread of theglobal COVID-19 pandemic. Between the S&P500’s high on 19 February 2020 and its low on23 March 2020, the S&P 500 fell almost 34%.The VIX moved from 14% to 62%, and the S&P500 VIX Short-Term Futures Index moved upmore than 300%. During this period, the VIXreached its highest closing level ever (83%) on 16March, a day when the S&P 500 fell some 12%.Over the full turbulent 26 trading days between20 February and 26 March, the VIX averagedvi CFA Institute Research Foundation50%, compared with its average of 15% in 2019and 14% in 2020 through February 19.Similar equity market declines and VIX-likesurges were occurring globally. In Europe, theVSTOXX, which measures implied volatilityof EURO STOXX 50 Index options, closed at86% on 16 March 2020, its second highest dailyclose ever.As is typical in highly uncertain market conditions, investors from 20 February to 26 March2020 turned to volatility-trading products. VIXfutures volume over the that period was 77%higher than the 2019 level, and options activitywas up as much as 161%. By the end of the weekbeginning 27 March 2020, central bankers andgovernments around the globe had respondedwith policy initiatives, and equity markets hadrebounded somewhat. But the VIX was stillhigh—66%.The public health, economic, and financial market picture is still evolving as I write this foreword. We have seen such extremes in investoruncertainty infrequently, thank goodness. Fordecades, investors have understood that financial markets reward risk taking but that risk canchange dramatically from one economic cycleto another and as new information emergesunexpectedly. Index option prices are set incompetitive and open markets and will continueto serve as valuable measures of the changingperceptions of risk to broad market indexes.Understanding the VIX Index and the tradingand investment products based on it is highlyvaluable for anyone who wishes to assess ormanage equity risk.Joanne M. HillVice Chair, CFA Institute Research Foundation30 March 2020
THE VIX INDEX AND VOLATILITYBASED GLOBAL INDEXES AND TRADINGINSTRUMENTS: A GUIDE TO INVESTMENTAND TRADING FEATURESMatthew T. Moran and Berlinda LiuMatthew T. Moran is head of Global Benchmark Indexes Advancementat Cboe Global Markets, Chicago.Berlinda Liu is director of Global Research & Design at S&P Dow Jones Indices,New York City.The Cboe Volatility Index (VIX Index) measures the market’s expectation of future volatilityconveyed by S&P 500 Index option prices. TheVIX is recognized as a premier gauge of expectedUS equity market volatility. The 2000–09 decadeexperienced two deep bear markets for equitiesthat saw numerous short-term periods of highlevels of investor uncertainty. Most investorsrecall how during the financial crisis of 2008–2009, the correlations between equities rose globally and traditional diversification goals becamedifficult to achieve. Exchange-listed VIX futureswere launched in 2004, and VIX options werelaunched in 2006. During the 2008–09 financialcrisis, VIX futures and VIX options experiencedtremendous growth, as interest in and use of suchindex-based products as exchange-traded notesand exchange-traded funds grew. These productshave become widely used in investors’ strategiesranging from trading tactical views on volatilityto incorporating volatility trades and hedges inrisk management and multiasset strategies.This study addresses several questions investors have asked related to the VIX Index,volatility-based trading products, and the useof VIX futures in portfolio construction. Thesequestions include the following:1. What does the VIX Index measure, andwhat does a VIX level signify?2. What are some indexes that measureexpected volatility of European or Asianstock indexes?3. How do features such as convexity and negative correlation make the VIX an intriguinginvestment gauge?4. Is the VIX Index tradable, and if not, why?5. What tradable volatility-based futures andoptions products are available?6. How do contango and backwardationaffect the returns of VIX futures-basedstrategies?7. What volatility benchmark indexes areavailable, and what is their impact whenadded to S&P 500 portfolios?CFA Institute Research Foundation 1
The VIX Index and Volatility-Based Global Indexes and Trading InstrumentsTHE VIX INDEX: A GAUGE OFEXPECTED FUTURE VOLATILITYoptions, this methodology transformed the VIXfrom an abstract concept into a practical standard for trading and hedging volatility.1Volatility is a key consideration for many traders and investors. Historical volatility measures the extent of return fluctuations over ahistorical period—for example, the annualizedstandard deviation of the day-to-day (closingprice) returns on a set number of past tradingdays, expressed as an annualized percentage.Implied volatility is derived from a market’s current price of an options contract and reflectsexpectations of future volatility. Investors lookat historical volatility to gain insights into pastmarket movements, but investors also analyzevolatility indexes, such as the VIX, to gain realtime updates on market sentiment and expectations of future volatility. The VIX, introducedin 1993, measures the market’s expectationof future 30-day volatility. Like conventionalindexes, the VIX uses rules for selecting thecomponent options and a formula for calculating index values.The VIX Index (often referred to as the “spotVIX”) is not itself investable. Rather, it isdesigned to reflect volatility expectations at afuture time based on SPX options. Because theVIX is always measuring expected volatility30 days ahead, directly from option prices, thecomposition of the strip of SPX options used tocalculate the VIX level often changes throughout the trading day. This ever-changing basketof SPX options used to calculate the VIX makesit impractical and expensive to hold on an ongoing basis.In 1993, the Chicago Board Options Exchange (now known as Cboe ) introduced the original version of the VIX Index to measure themarket’s expectation of 30-day volatility ofthe S&P 100 Index as implied by the prices ofat-the-money options (see Whaley 1993). TheVIX soon became a leading gauge for US stockmarket volatility. In 2003, the VIX methodologywas revised to reflect a new way of measuringexpected volatility. The changes to its methodology were intended to make it more robustand relevant to volatility traders and hedgers.Specifically, since 2003, the VIX has been basedon options on the S&P 500 Index (SPX), thecore index for US equities. The VIX estimatesexpected volatility by aggregating the weightedprices of SPX puts and calls over a wide range ofstrike prices. By supplying a means of replicating volatility exposure with a portfolio of SPX2 CFA Institute Research FoundationIn 2014, Cboe enhanced the VIX to include SPXweekly options expirations in its calculation.Only SPX options with Friday expirations (standard and weekly expirations) are used to calculate the VIX. (Cboe lists SPX options that expireon days other than Friday, but non-Friday SPXexpirations are not used to calculate the VIX.)The inclusion of SPX weekly options allows theVIX to be calculated with SPX option series thatmore precisely match the 30-day target timeframe for expected volatility that the VIX isintended to represent. Using SPX options withmore than 23 days and fewer than 37 days toexpiration ensures that the VIX always reflectsan interpolation of two points along the S&P500 volatility term structure.21Theprice history for the Cboe S&P 100 Volatility Index(ticker VXO), using the original 1993 methodology basedon S&P 100 options, is available from 1986 to the present,and the price history for the current version of the VIX(based on SPX options since 2003) is available from 1990to the present.2Detailed information regarding the VIX methodology isavailable on the Cboe website: www.cboe.com/vix.
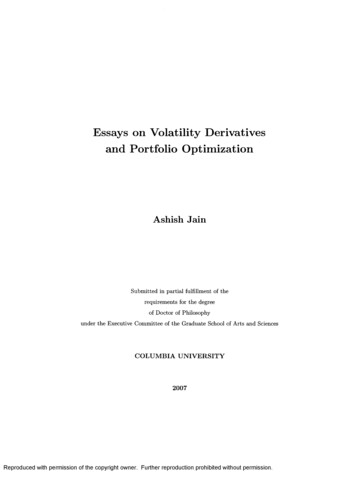
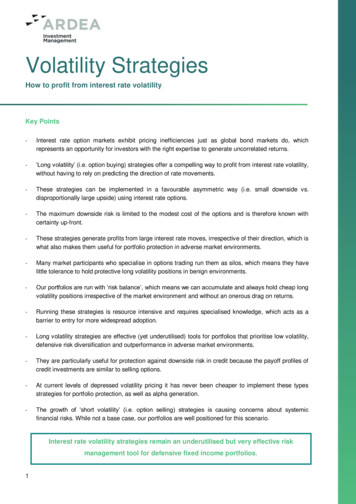
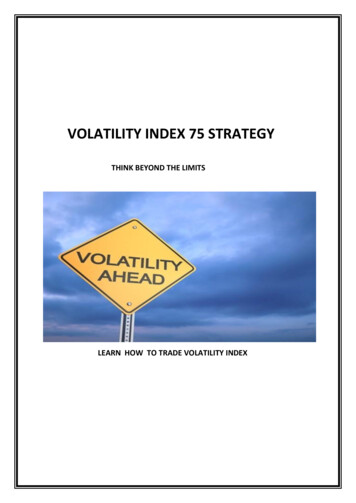
The VIX Index and Volatility-Based Global Indexes and Trading InstrumentsHow VIX Levels Translateinto Expected RiskIn the 30-year period from 1990 through 2019,the daily closing values of the VIX have fluctuated in a wide range, as shown in Figure 1, withshort-term surges to levels well above the meanand median values.Over this period, the daily closing levels of theVIX had a median value of 17.2 and an averagevalue of 19.1, with daily closing levels rangingfrom a low of 9.14 on 3 November 2017 to ahigh of 80.86 on 20 November 2008. The VIXalso tended to be higher than realized volatility (measured over 20 subsequent trading days)except when historical volatility was veryhigh. In addition, almost all spikes in the VIXoccurred during periods of steep declines in theS&P 500. The only exception was during 1998–1999, when the S&P 500 was in an uptrendrelated to strong returns from the technologysector but the expected volatility of the S&P 500(as measured by the VIX) indicated that investors perceived rising uncertainty about sustaining the gains from this sector.Correlations and WorldwideVolatilityA key feature of the VIX that often attractsattention is that its movements have usually hada negative correlation with price movements ofthe key global stock indexes. Moreover, thesecorrelations have generally become even morenegative in times of market turbulence, suchas during the year 2008. When stock marketindexes suffer sharp declines, expected volatilitytends to rise, reflecting an increase in demandfor protecting a stock portfolio with SPX putoptions and the associated increase in optionprices as a result of heightened risk aversion.FIGURE 1. VIX INDEX, HISTORICAL VOLATILITY, AND STOCK INDEX PRICES,1990–2019VIX and Historical Volatility of SPX90S&P 500 (SPX)3300Historical Volatility of SPX* (avg. 15.3)S&P 500602200VIX (avg. ec/13Jan/18*20-trading-day historical volatility.Notes: Daily closing values. The VIX Index and historical volatility are measured on the left axis; the S&P 500is measured on the right axis.Sources: Bloomberg and Cboe.CFA Institute Research Foundation 3
The VIX Index and Volatility-Based Global Indexes and Trading InstrumentsA challenge for investors who try to diversifyacross global equity markets is that the correlations of the global stock indexes have generallyrisen over the past three decades. During the2007–09 crisis, a number of indexes—includingthe S&P 500, EURO STOXX 50 Index, HangSeng Index for Hong Kong stocks, and the S&PGSCI (Goldman Sachs Commodity Index)—allexperienced drawdowns of worse than 50%. Asa result, the desired diversification benefit ofowning global equities and commodities failedto materialize.in Australia, the HSI Volatility Index (VHSI) isbased on the Hang Seng in Hong Kong, the IndiaVIX reflects expected volatility of India’s NIFTY50 Index, and the EURO STOXX 50 VolatilityIndex (VSTOXX) is based on the EURO STOXX50. The negative correlations of many volatilityindexes have helped stimulate interest in exploring the possibility of using volatility-relatedproducts for portfolio diversification. For anoverview of 30 volatility indexes and worldwidevolatility, please see Moran (2014).Conversely, as shown in Table 1, in 2008, five ofthe world’s leading volatility indexes all rose byat least 50%, and the correlations of the weeklyreturns of the volatility indexes versus the localstock indexes were negative. For four of thefive volatility indexes, the correlations in 2008were even more negative than they were during the 12-year period. All five volatility indexeshave somewhat similar methodologies but arebased on stock index options traded in variousworld markets. The S&P/ASX 200 VIX reflectsexpected volatility of the S&P/ASX 200 IndexThe Volatility Risk Premium:Implied minus Historical VolatilityA number of studies have noted that key indexoptions markets have supplied a volatility riskpremium since the 1990s. Specifically, for SPXoptions, implied volatilities usually have beenhigher than historical (or realized) volatilitiesfor the S&P 500 (Feldman and Roy 2005; Hill,Balasubramanian, Gregory, and Tierens 2006;He, Hsu, and Rue 2015; Black and Szado 2016;Wilshire Analytics Applied Research Group2019). In 29 of the 30 years from 1990 throughTABLE 1. FIVE GLOBAL VOLATILITY INDEXES OVER 12 YEARS, 2008–2019Correlations of Weekly ReturnsIndexVIX IndexAXVI [S&P/ASX 200 VIX]VHSI [HSI Volatility Index]NVIX [India VIX]VSTOXX [EURO STOXX 50Volatility]%With Local With LocalWithMaximum Minimum Change Stock Index Stock Index VIX overDaily Close Daily Close in 2008in 2008over 12 Years 12 1.000.580.510.320.78Note: The five local stock indexes are the S&P 500, S&P/ASX 200, Hang Seng, NIFTY 50, and EURO STOXX 50.Sources: Bloomberg and Cboe.4 CFA Institute Research Foundation
The VIX Index and Volatility-Based Global Indexes and Trading Instruments2019, the average daily closing level for the VIXwas higher than the subsequent 30-day realizedvolatility of the S&P 500.The existence of a volatility risk premium can alsobe seen in the legend in Figure 1, which showsthat the average daily VIX closing values were 19.1(compared with an average of 15.3 for the historical volatility of the S&P 500) over the 1990–2019period. This premium can be attributed to severalfactors, including (1) an imbalance in the numberof investors who want to buy protection and thosewho want to sell protection and (2) the tendencyfor index levels to move quickly and sharply inresponse to significant new information, whichaccounts for short-horizon traders’ tendency touse options to capitalize on these moves.The persistence of a volatility risk premiumpriced into SPX options can facilitate higherreturns for option-selling strategies over optionbuying strategies with similar market exposure.An index that sells index options—the CboeS&P 500 30-Delta BuyWrite Index (BXMDSM)—generated higher returns and higher risk-adjustedreturns than both the S&P 500 and the Cboe S&P500 5% Put Protection Index (PPUTSM) over aperiod of more than 32 years (Wilshire AnalyticsApplied Research Group 2019), but none of theseindexes are guaranteed such outperformance inthe future. Also, the returns of volatility-sellingstrategies tend to be negatively skewed; performance during periods of sharp volatility increasescan be negative, so investors must be aware of thepotential for losses in these periods when deciding whether such strategies are consistent withtheir risk preferences.FUTURES AND OPTIONSON THE VIXAs noted, the VIX Index is not itself investable.Exchange-listed futures and options on theVIX provide market participants with a vehicleto trade expected volatility. VIX futures werelaunched in March 2004 for trading on the CboeFutures Exchange, are traded electronically witha 1,000 multiplier, and are regulated by the USCommodity Futures Trading Commission. VIXoptions were launched in February 2006 with a 100 multiplier, are regulated by the US SEC, andare traded both electronically and on an openoutcry trading floor at Cboe. Expiration and cashsettlement for VIX futures and options usuallyoccur on Wednesday mornings in the UnitedStates. In 2019, the total annual volume was127 million contracts for VIX options, 62 millionfor VIX futures, 16 million for VSTOXX minifutures, and 7 million for VSTOXX options.VIX futures and VIX options reflect the market’sestimate of the value of the VIX on various expiration dates in the future, and the contracts providemarket participants with a variety of opportunities to implement their views by using volatilitytrading strategies, including risk management,alpha generation, and portfolio diversification.VIX Futures: Pricing,Term Structure, Contango,and BackwardationVIX futures are contracts on future, 30-day, SPXoption-implied volatilities that are expectedon the future expiration date. For example, inMarch, a June VIX futures contract is a contracton what 30-day implied SPX option volatilitywill be on the June expiration date, and a JulyVIX futures contract reflects the expectation ofwhat the 30-day implied volatility will be on theJuly expiration date.The rapid growth in the volume of VIX optionsand futures has been driven by these products’use not only as short-term tactical tools for seeking profit from short-term moves in expectedCFA Institute Research Foundation 5
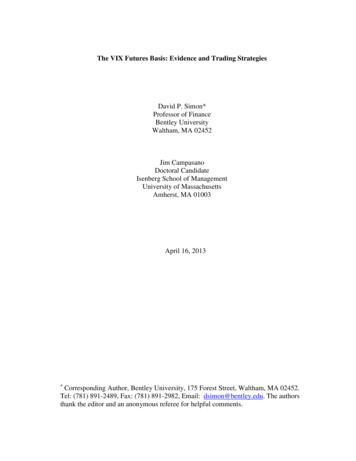
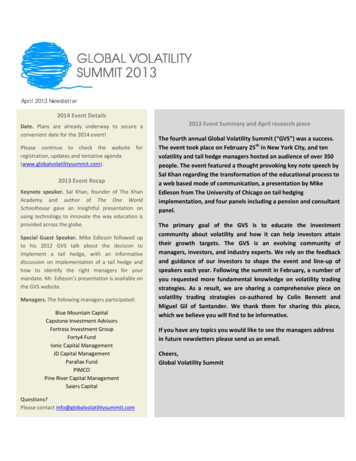
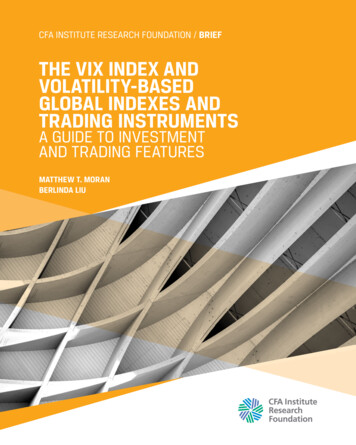
The VIX Index and Volatility-Based Global Indexes and Trading Instrumentsvolatility, but also as a means for investors toincorporate more enduring long- or short-termvolatility exposures into their hedge fund andmultiasset strategies. VIX futures and optionsstrategies include (1) the buying of VIX futures orVIX call options by investors who are concernedabout stock market tail risk and believe that nearterm volatility could skyrocket and (2) the sellingof VIX futures if the futures are “in contango,” asexplained in the following paragraphs.For investors who wish to invest in futures contracts related to commodities, interest rates, orvolatility, key concepts to understand are contangoand backwardation. Futures are said to be in contango when futures with more time to expirationhave higher prices than those with a shorter timeto expiration; futures are in backwardation whenlonger-term futures have lower prices than shortterm futures. A comparison of the prices of frontmonth VIX futures with second-month VIXfutures from 2007 through 2019 indicates that(1) the daily closing prices for VIX futures werein contango on approximately 80% of the daysduring the 13-year period, but (2) the daily closing prices for VIX futures were in backwardationon most days in the months of October 2008 andAugust 2011, when the level of the VIX generallywas higher than its long-term average.Figure 2 presents examples of contango andbackwardation. As Panel A shows, on the afternoon of 23 February 2017, the VIX futures werein contango: The VIX futures term structure wasFIGURE 2. PRICING, TERM STRUCTURE, CONTANGO, AND BACKWARDATION:EXAMPLESA. VIX and Select VIX Futures on 23 February 2017VIX Price2017.181511.9012.5013.4518.3514.4010VIX IndexVIX FutureExp. 1 MarVIX FutureExp. 14 MarVIX FutureExp. 29 MarVIX FutureExp. 19 JulVIX FutureExp. 15 NovB. VIX and Select VIX Futures on 6 February 2018VIX Price353029.982521.5021.002019.3318.7218.00VIX FutureExp. MayVIX FutureExp. AugVIX FutureExp. Oct15VIX IndexVIX FutureExp. FebVIX FutureExp. MarNote: In Panel A, the last reported prices were at approximately 2:40 PM US Central Time.Source: Cboe Futures Exchange.6 CFA Institute Research Foundation
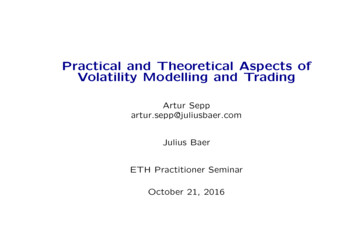
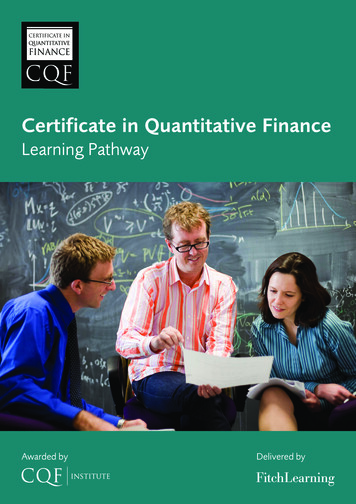
The VIX Index and Volatility-Based Global Indexes and Trading Instrumentsupward sloping, with VIX longer-dated futurespriced higher than the near-term VIX futuresprices and the value of the VIX. In contrast,Panel B shows an example of backwardationthat occurred on 6 February 2018: That day, theVIX closed at 29.98 while all listed VIX futuresclosed more than 8 points lower than the closing VIX value; the resulting VIX term structurewas generally downward sloping.To expand understanding of volatility instruments, we now show how the VIX Index movescompared with VIX futures in response toa major event that is a shock to the financialmarkets. Events with negative implications forfuture equity earnings or risk can have a bigimpact on the next month’s expected volatility;the event’s impact on 30-day expected volatilityseveral months into the future, however, tendsto be more muted. Panel A of Figure 3 showsthe price movements for the VIX and select VIXfutures in August 2011. On 5 August, Standard& Poor’s downgraded US Treasury debt to AA ,and as the graph shows, on 8 August, the VIXrose 50% to close at 48. Panel B depicts pricemovements for the VIX and VIX futures inAugust 2015, when many financial market participants were concerned about a possible cooling of the Chinese stock market. In three tradingdays ending 24 August, the SPX Index fell 9%; theVIX Index rose 167%, VIX Week 35 futures rose147%, and VIX September futures rose 60%.During the big VIX upward moves shown inFigure 3, near-term VIX futures saw upwardmoves that were not quite as large as those ofthe VIX Index, and the longer-dated VIX futureshad smaller upward moves. This is because thefutures were pricing volatility expectations forthe 30 days subsequent to their expiration daterather than volatility over the next 30 days.Studies with more information on the use ofVIX futures and options include Moran andDash (2007), Szado (2009), and Hill (2013).BENCHMARK INDEXESFOR FUTURES AND OPTIONSON THE VIXOn 22 January 2009, S&P Dow Jones Indiceslaunched the first index based on rolledpositions in VIX futures, the S&P 500 VIXShort-Term Futures Index. The investmentcommunity quickly adopted this index as abenchmark of hypothetical short-term VIXfutures performance.The concept behind VIX futures indexes is similar to that used in commodity futures indexes,with the rolling of positions incorporated intothe index. Although commodity futures indexeshave rules-based strategies for rolling futuresclose to expiration, the VIX futures indexesrolled an equivalent portion each trading day tosmooth out the rolling process over a calendarmonth. A suite of benchmark indexes based onVIX futures and options was subsequently created to address various investment demands.MethodologyThe widely followed S&P 500 VIX Short-TermFutures Index replicates a hypothetical VIXfutures portfolio that continuously reflects VIXexpectations one month out by rolling approximately 5% of its positions daily from the firstmonth futures contract to the second-monthcontract. This index is used by investmentproducts that seek to provide long exposure andleveraged long exposure to the index as well asinverse index exposure.The S&P 500 VIX Mid-Term Futures Index waslaunched at the same time as the S&P 500 VIXShort-Term Futures Index and aims to captureVIX expectations continuously five months out.It replicates a hypothetical VIX futures portfolio that holds the fourth-, fifth-, sixth-, andCFA Institute Research Foundation 7
The VIX Index and Volatility-Based Global Indexes and Trading InstrumentsFIGURE 3. PRICE MOVEMENTS OF VIX FUTURES IN VOLATILE MONTHSA. VIX and Select Futures in August 2011VIX 7/Aug21/Aug25/Aug29/AugVIX Aug. Futures
have become widely used in investors’ strategies ranging from trading tactical views on volatility to incorporating volatility trades and hedges in risk management and multiasset strategies. This study addresses several questions inves-tors have asked related to the VIX Index, volatility