Transcription
Chapter 15Bioinformatics Analysis of Microarray DataYunyu Zhang, Joseph Szustakowski, and Martina SchinkeAbstractGene expression profiling provides unprecedented opportunities to study patterns of gene expressionregulation, for example, in diseases or developmental processes. Bioinformatics analysis plays an importantpart of processing the information embedded in large-scale expression profiling studies and for laying thefoundation for biological interpretation.Over the past years, numerous tools have emerged for microarray data analysis. One of the most popularplatforms is Bioconductor, an open source and open development software project for the analysis andcomprehension of genomic data, based on the R programming language.In this chapter, we use Bioconductor analysis packages on a heart development dataset to demonstratethe workflow of microarray data analysis from annotation, normalization, expression index calculation, anddiagnostic plots to pathway analysis, leading to a meaningful visualization and interpretation of the data.Key words: Annotation, normalization, gene filtering, moderated F-test, GSEA, pathway analysis,affymetrix GeneChipTM, sigPathway.1. IntroductionThe purpose of this chapter is to provide an understanding of theroutine steps for microarray data analysis using Bioconductor (1)packages written in R (2), a widely used open source programminglanguage and environment for statistical computing and graphics.Both R and Bioconductor are under active development by adedicated team of researchers with a commitment to good documentation and software design. We assume that the reader has abasic understanding about data structures and functions in Rprogramming. However, all of the analysis steps and toolsdescribed in this chapter have also been implemented in othersoftware packages (summarized in Section 4). The workflowK. DiPetrillo (ed.), Cardiovascular Genomics, Methods in Molecular Biology 573,DOI 10.1007/978-1-60761-247-6 15, ª Humana Press, a part of Springer ScienceþBusiness Media, LLC 2009259
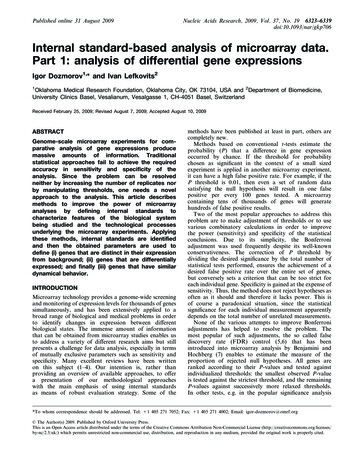
260Zhang, Szustakowski, and SchinkeArrayImageHigh Level Statistical AnalysisDifferentially Expressed GenesCel File(raw probe-levelexpression data)Normalization &SummarizationStatistical FilteringGeneFilteringProbe-sets LevelExpression &Detection callsClustering AnalysisPathway AnalysisMotif AnalysisGene NetworksFig. 15.1. Microarray data analysis work flow for Affymetrix GeneChipTM arrays.shown in Fig. 15.1 facilitates the understanding of the basicprocedures in microarray data analysis and serves as an outline ofthis chapter.2. Materials2.1. SoftwareR can be downloaded from http://www.r-project.org and beinstalled on all three mainstream operating systems (Windows,Mac, Unix/Linux). The general installation manual and introductory tutorials can be obtained from the same website. Similar toother statistical software packages, R provides a statistical framework and terminal-based interface for users to input commands fordata manipulation. Additional packages (Table 15.1) fromTable 15.1List of add-on R packages required for analysisPackageDescriptionAffy (31)Basic functions for low-level analysis of Affymetrix GeneChipTMoligonucleotide arraysPLIER (5)Normalize and summarize the Affymetrix probe-level expression data usingthe PLIER methodLIMMA (32)Linear model for microarray analysissigPathway (12)Pathway (Gene-Set) analysis for high-throughput datamm74av1mmentregcdfEntrez Gene-based chip definition file (CDF) for Affymetrix MG-74AV1platformorg.Mm.eg.dbAnnotation mapping based on mouse Entrez Gene identifiers
Bioinformatics Analysis of Microarray Data261Bioconductor (http://www.bioconductor.org) are required priorto starting the analysis. Details about the package installation canbe found in Section 3.1. The R terminal output is highlightedthroughout the chapter in courier font.2.2. DatasetA gene expression profiling experiment of heart ventricles at various stages of cardiac development generated by the CardioGenomics Program for Genomic Applications (PGA) was used as atest dataset. This dataset can be downloaded from NCBI GeneExpression Omnibus (GEO; accession number GSE75). Itincludes seven time-points covering gene expression in the heartfrom embryonic stages through adolescence into adulthood(Table 15.2). Though this study was performed with an earlierAffymetrix platform (MGU-74Av1), the design of this study andquality of the data make this a valuable test dataset to this date.Table 15.2Experimental design of the heart development datasetTime pointAbbreviationNumber of GeneChipTMarraysEmbryonic day 12.5 d.p.c.E12.53Neonatal (Day 1 post-birth)NN31 week of ageA1w34 weeks of ageA4w33 months of ageA3m35 months of ageA5m31 year of ageA1y63. Methods3.1. R PackageInstallationAfter downloading and installing R software (see Note 1), an Rterminal can be started to install the required Bioconductor coreand additional packages (see Note 2). source("http://www.bioconductor.org/biocLite.R") biocLite()Running biocinstall version 2.1.11 with R version 2.6.1Your version of R requires version 2.1 of Bioconductor.Will install the following packages:[1 ] "affy""affydata""affyPLM""annaffy""annotate"[6 ] "Biobase""Biostrings" "DynDoc" "gcrma""genefilter"[11 ] "[16 ] "multtest""ROC""vsn""xtable""affyQCReport"
262Zhang, Szustakowski, and SchinkePlease wait.also installing the dependencies ’DBI’, ’RSQLite’, ’affyio’,’preprocessCore’, ’GO’, ’KEGG’, ’AnnotationDbi’, ’simpleaffy’‘‘affy’’ and ‘‘limma’’ are already included in the above corepackages. We can install the rest of the packages in Table 15.1by specifying the names as the argument using the ‘‘biocLite’’function. pkgs -c("plier", "sigPathway", "mm74av1mmentrezgcdf","mm74av1mmentrezgprobe", "org.Mm.eg.db") biocLite(pkgs)3.2. Preparationfor Data and ResultFile StorageOrganizing data and results is very helpful for flexible use of thescripts. For this project, we created a directory ‘‘cardiac dev’’ andthe following subdirectories to store the raw and intermediate datafiles and the analysis results.1. ‘‘cel’’: To store the cel files2. ‘‘obj’’: To store R-object3. ‘‘gp.cmp’’: For group comparison results and outputs4. ‘‘limma’’: To store the group comparison results5. ‘‘img’’: To store the images6. ‘‘pathway’’: To store the pathway analysis resultsThe raw data, packed in a compressed file named ‘‘GSE75RAW.tar,’’ can be downloaded from the GEO ftp site. The individual cel files are extracted from this file and decompressed usingthe WinZip program on the Windows platform. On the Linux/Unix platform, the ‘‘tar -vxf’’ followed by ‘‘gzip’’ command is usedto extract and decompress the cel files.3.3. Annotations forEntrez Gene Probe-SetsSince we used an Entrez Gene-based chip definition file (CDF) togenerate the probe-set level gene expression values, only a minimalset of annotations (including gene name and gene symbol mappedfrom Entrez Gene IDs) need to be readily available to obtain an initialbiological impression of the results. Here, we built a data frame thatcontains the gene symbol and name based on the Entrez Gene IDs.First, all probe-sets (or Entrez Gene identifiers (IDs) includedin this CDF file were retrieved. Their corresponding gene IDs canbe retrieved by removing the ending ‘‘ at’’ according to customCDFs naming convention. library(mm74av1mmentrezgprobe) probe.set unique(as.data.frame(mm74av1mmentrezgprobe) Probe.Set.Name) length(probe.set)[1 ] 7070 probe.set [grep(" st ", probe.set)] -paste(probe.set [grep(" st ",probe.set)], "at", sep " ") head(probe.set)
Bioinformatics Analysis of Microarray Data263[1 ] "AFFX-18SRNAMur/X00686 3 at" "AFFX-18SRNAMur/X00686 5 at"[3 ] "AFFX-18SRNAMur/X00686 M at" "AFFX-BioB-3 at"[5 ] "AFFX-BioB-3 st" "AFFX-BioB-5 at" gene.id -sub(" at", "", probe.set) length(grep("AFFX", gene.id))[1 ] 66A total of 7,070 probe-sets are defined in this CDF, including66 Affymetrix control probe-sets and 7,004 Entrez Gene IDs. Theannotations can be retrieved using package ‘‘org.Mm.eg.db.’’ Thispackage is maintained by the Bioconductor core team and routinely updated. The local version can be synchronized to theupdated one by the function "update.packages." To viewthe available annotations based on the Entrez Gene IDs: library(org.Mm.eg.db) ls("package:org.Mm.eg.db")[1 ] "org.Mm.eg dbconn""org.Mm.eg dbfile"[4 ] "org.Mm.eg dbschema" "org.Mm.egACCNUM"[7 ] "org.Mm.egALIAS2EG" "org.Mm.egCHR"[10 ] "org.Mm.egCHRLOC""org.Mm.egENZYME"[13 ] "org.Mm.egGENENAME" "org.Mm.egGO"[16 ] "org.Mm.egGO2EG""org.Mm.egMAP"[19 ] "org.Mm.egMAPCOUNTS" "org.Mm.egORGANISM"[22 ] "org.Mm.egPATH2EG""org.Mm.egPFAM"[25 ] "org.Mm.egPMID2EG""org.Mm.egPROSITE"[28 ] "org.Mm.egREFSEQ2EG" "org.Mm.egSYMBOL"[31 ] "org.Mm.egUNIGENE""org.Mm.egUNIGENE2EG""org.Mm.eg Q""org.Mm.egSYMBOL2EG"A data frame named "ann" with probe-set ID as row names iscreated to store the annotations. ann -as.data.frame(matrix(nrow length(gene.id), ncol 4)) dimnames(ann) -list(probe.set, c("ProbeSet", "GeneID", "Symbol","GeneName")) ann ProbeSet -probe.set ann GeneID -gene.idTo integrate the gene symbol and names into the data frame: ann GeneName d]ann Symbol save(ann, file "obj/ann.RData")tail(ann)ProbeSet GeneIDSymbol99377 at 99377 at99377Sall499571 at 99571 at99571Fgg99650 at 99650 at99650 4933434E20Rik99683 at 99683 at99683Sec24b99887 at 99887 at99887Tmem5699929 at 99929 at99929TiparpGeneName99377 atsal-like 4 (Drosophila)99571 atfibrinogen, gamma polypeptide99650 atRIKEN cDNA 4933434E20 gene99683 atSEC24 related gene family, member B (S. cerevisiae)99887 attransmembrane protein 5699929 atTCDD-inducible poly(ADP-ribose) polymerase3.4. Preparing SampleInformationSample information is needed for high-level statistical analysis. As asimple approach, we created an R data frame object to store thisinformation, which can be started with a tab-delimited file
264Zhang, Szustakowski, and Schinkeprepared in Excel. For this dataset, the phenotype information wascopied from the GEO website with some simple text manipulation(copy/paste, replace with * as wild card, concatenate) to generatea tab-delimited file as shown in Table 15.3. The first column hasto contain the exact cel file names, while the remaining columnscan contain any additional information.Table 15.3Example sample information file in tab-delimited formatFile nameSample nameGroupBSGSM2189.CELFVB E12.5 1-2-3-m5E12.51-2-3-m5GSM2190.CELFVB E12.5 4-5-6-m5E12.54-5-6-m5GSM2191.CELFVB E12.5 7-8-9-m5E12.57-8-9-m5GSM2192.CELFVB NN 1-2-m5NN1-2-m5GSM2193.CELFVB NN 7-8-m5NN7-8-m5GSM2194.CELFVB NN 9-10-m5NN9-10-m5GSM2088.CELFVB 1w 801-m5A1w801-m5GSM2178.CELFVB 1w 804-m5A1w804-m5GSM2179.CELFVB 1w 805-m5A1w805-m5GSM2183.CELFVB 4w 11293-m5A4w11293-m5GSM2184.CELFVB 4w 11294-m5A4w11294-m5GSM2185.CELFVB 4w 11295-m5A4w11295-m5GSM2334.CELFVB 3m 1f-m5A3m1f-m5GSM2335.CELFVB 3m 2f-m5A3m2f-m5GSM2336.CELFVB 3m 3f-m5A3m3f-m5GSM2186.CELFVB 5m 731m-m5A5m731m-m5GSM2187.CELFVB 5m 732m-m5A5m732m-m5GSM2188.CELFVB 5m 733m-m5A5m733m-m5GSM2180.CELFVB 1y 511m-m5A1y511m-m5GSM2181.CELFVB 1y 5m-m5A1y5m-m5GSM2182.CELFVB 1y 6m-m5A1y6m-m5GSM2337.CELFVB 1y 529f-m5A1y529f-m5GSM2338.CELFVB 1y 530f-m5A1y530f-m5GSM2339.CELFVB 1y 544f-m5A1y544f-m5
Bioinformatics Analysis of Microarray Data265To read this file into a data frame object in R: info -read.delim("sampleInfo.txt",fill F) head(info)SampleName GroupGSM2189.CEL FVB E12.5 1-2-3-m5 E12.5GSM2190.CEL FVB E12.5 4-5-6-m5 E12.5GSM2191.CEL FVB E12.5 7-8-9-m5 E12.5GSM2192.CELFVB NN 1-2-m5NNGSM2193.CELFVB NN 7-8-m5NNGSM2194.CELFVB NN 9-10-m5NNas.is T, row.names 1, quote We used the cel file names as row names of the data frame foreasy manipulation in conjunction with the expression matrix lateron. For easy understanding and model fitting, groups were transformed into factors from characters and arranged in a timeordered fashion, which more appropriately describes the data. info Group -factor(info Group,levels c("E12.5", "NN", "A1w", "A4w", "A3m","A5m", "A1y") summary(info)SampleNameLength:24Class :characterMode :character3.5. Low-Level DataProcessing3.5.1. Normalization andSummarization with EntrezGene CDFGroupE12.5:3NN:3A1w :3A4w :3A3m :3A5m :3A1y :6BSLength :24Class :characterMode:characterThere have been a number of efforts to provide accurate, up-todate annotations for microarray platforms to supplement thoseprovided by the microarray manufacturers. Each effort aims toaddress specific challenges, including volatile gene predictions,changes in genomic assemblies, and probe-set redundancies(3, 4). In this example, we used a custom CDF (3) for the MGU74av1 chip. The custom CDF attempts to address these limitations by re-defining the probe-sets using a public identifierlike Entrez Gene or Refseq and by re-aligning the individualprobe sequence to the latest genome annotations of the corresponding organism. Additionally, the Affymetrix platformalways contains multiple probe-sets mapping to the same gene.This redundancy creates noise and errors in the pathway analysis.Using Entrez Gene-based custom CDF will generate only oneexpression value per gene, which improves the accuracy of thepathway analysis.Here, we show how to use an Entrez Gene ID-basedcustom CDF to generate the probe-set level expression values(see Note 3). Start an R terminal in the project directory containing the Affymetrix cel files. First, the cel files are read intoan AffyBatch object:
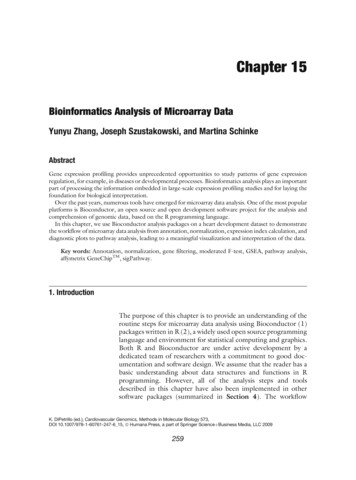
266Zhang, Szustakowski, and Schinke library(affy) batch -ReadAffy(celfile.path "cel") cdfName(batch)[1 ] "MG U74A"Changing the CDF name of the AffyBatch object to"mm74av1mmentrezg" will enable the data processing usingthe custom CDF file ‘‘mm74av1mmentrezg.’’ library(mm74av1mmentrezg) cdfName(batch) -"mm74av1mmentrezg" save(batch, file "obj/batch.RData")The probe logarithmic intensity error (PLIER) method withquantile normalization and mismatch correction was used to generate more accurate results (5–7), especially for probe-sets withlow expression. PLIER produces an improved signal (a summaryvalue for a probe set) by accounting for experimentally observedpatterns for feature behavior and handling error at low and highabundances across multiple arrays. For more information, pleasesee the Affymetrix PLIER technical note (5). library(plier) eset -justPlier(batch, normalize T) exp -exprs(eset) pairs(exp[,1:3])The last command generates a pair–pair scatter plot of the firstthree arrays. As shown in Fig. 15.2A, there are some expressionvalues ranging from 0 to 1 with exaggerated variance in log 2 scale.However, it’s common practice to perform statistical analysis on alog-transformed scale. One simple solution is to add a small constant05B10 1545 10 15-10 -5648 10 12 145 10 15GSM2178.CEL-10 -50510 15-10 -50510 15GSM2179.CEL46-10 -5 0GSM2179.CEL8 10 12 145 10 1546-10 -5 0GSM2178.CEL8 10 12 14GSM2088.CEL-10 -5 0GSM2088.CEL68 10 12 14A468 10 12 14468 10 12 14Fig. 15.2. Pair-wise scatter plot of expression values from microarrays 1 to 3 after low-level data processing. (A) Plotbefore flooring with a constant value. Large variance is observed for values between 0 and 1. (B) Data were plotted afterflooring with a constant value.
Bioinformatics Analysis of Microarray Data267number to floor the data. This can effectively reduce nuisancevariation after transformation (Fig. 15.2B) with little impact onhighly expressed genes. This method is also recommended in thePLIER technical note (5). exp -log2(2 exp 16) pairs(exp [,1:3]) save(exp, file "obj/exp.RData")Several studies have shown that using a threshold fraction of present detection calls generated from the Affymetrix MAS5 algorithm can effectively eliminate unreliable probe-sets and improvethe ratio of true positives to false positives (8, 9). To generate theMAS5 detection calls for all probe-set: calls -exprs(mas5calls(batch))The relationship between calls and expression level and thedistribution of the presence calls within a gene can be viewed usingboxplots. boxplot(exp"calls)As shown in Fig. 15.3, the detection calls are correlated withthe expression level, but there is no clear cut difference among thethree groups. Since we have a minimum of three samples for eachgroup in this dataset, we applied a filtering step to keep only thoseprobe-sets that have a present call on at least three arrays. row.calls -rowSums(calls "P") barplot(row.calls(table(row.calls))) exp -exp [row.calls 3, rownames(info)] dim(exp)[1 ] 3832 24The 3,832 probe-sets that passed the filtering criteria are usedfor the high-level statistical analysis.1614log2(expression)3.5.2. Gene Filteringwith MAS5 Calls1210864AMPFig. 15.3. The boxplot of log 2 (expression) vs. MAS5 detection calls. ‘‘A’’ – absent; ‘‘M’’ –marginal; ‘‘P’’ – present.
Zhang, Szustakowski, and Schinke3.6. PrincipalComponent Analysis(PCA)Principal component analysis is usually performed as the first stepafter low-level data processing to obtain a ‘‘big picture’’ of thedata. It is designed to capture the variance in a dataset in terms ofprincipal components (PCs). PCA helps to dissect the source ofthe variance and identify the sample outliers in the dataset byreducing the dimensionality of the data. Since the number ofgenes (rows) is much larger than the number of samples (columns)in microarray data, function "prcomp" (instead of "princomp")is called and the expression matrix is transposed before being fedinto the function. The argument "scale." is explicitly turned onso that all the genes contribute equally to the analysis regardless ofthe magnitude of the change. dim(t(exp))[1 ] 24 3832 pca.res -prcomp(t(exp), scale. T, retx T) names(pca.res)[1 ] "sdev""rotation""center""scale" dim(pca.res x)[1 ] 24 24"x"The "sdev" in the result object is a list containing the standard deviations from all principal components (PCs). The varianceof the first ten principal components can be plotted as (Fig.15.4):1500Variances26810005000Fig. 15.4. The Scree plot of variance, contributed from the first ten principal components. plot(pca.res, las 1)The percentage of the variation "pc.per" contributed fromeach PC can be calculated as pc.var -pca.res sdev 2 pc.per -round(pc.var/sum(pc.var)*100, 1) pc.per[1 ] 45.0 13.4 13.1 4.3 4.0 2.7 2.5 2.3 1.6 1.3 1.2[12 ] 1.0 1.0 0.8 0.8 0.7 0.7 0.7 0.6 0.6 0.6 0.5[23 ] 0.5 0.0
Bioinformatics Analysis of Microarray Data269‘‘x’’ in the results is a matrix that contains the coordinates of allsamples projected onto the PCs. We can then plot the samples onto the first two PCs that carry the most variance, and label them bytime-point. plot.pch -(1:length(levels(info Group)))[as.numeric(info Group)] plot(pca.res x, col 1, pch plot.pch, las 1, cex 2,xlab paste("PC1 (",pc.per [1], "%)", sep ""),ylab paste("PC2 (", pc.per [2], "%)", sep "")) grid() legend(-90, 0, levels(info Group), pch 1:length(levels(info Group)),pt.cex 1.5)Visual inspection of the PCA plot yielded a straightforwarddiagnosis of the sources of variance in this dataset. As shown inFig. 15.5, samples from the same group clustered together. Themain variation in the dataset (45%) correlates with the time pointof cardiac development. The second PC (13.4%) does not sort thesamples by developmental stage, but seems to distinguish theneonatal (NN) and 1 week of age (A1w) groups from the othertime points. One sample from group ‘‘A1w’’ was separated in spacefrom the other two samples in this group, but still allowed separation from the other groups. This sample was therefore not considered an outlier and was included in the analysis.PC2 -200PC1 (45%)2040Fig. 15.5. Sample projection onto the first two PCs. The percent variance described bythe corresponding PC is marked along the axes.3.7. IdentifyDifferentiallyExpressed GenesUsing LIMMALinear Models for Microarray Data (LIMMA) is an R packagethat uses linear models to analyze microarray experiments(5; see Note 4). Microarray experiments frequently employ asmall number of replicates per condition (n # 6), which makes
270Zhang, Szustakowski, and Schinkeestimating the variance of a gene’s expression level difficult.Consequently, traditional statistical methods such as the t-testcan be unreliable. LIMMA leverages the large number of observations in a microarray experiment to moderate the variance estimates in a data dependent fashion. The output of LIMMA istherefore similar to the output of a t-test but stabilized againstthe effects of small sample sizes. Our purpose was to use thispackage to identify significantly differentially expressed genesacross different time points. To fit the data with the linearmodel, we constructed a design matrix from a ‘‘target’’ vectorwhich contains the grouping information (i.e., the ‘‘Group’’ column in the info data frame in this example). library(limma) levels(info Group)[1 ] "E12.5" "NN""1w""4w""3m" lev -levels(info Group) design -model.matrix("0 info Group) colnames(design) -lev dim(design)[1 ] 24 7 head(design)E12.5 NN A1w A4w A3m A5m A1y11 00000021 00000031 00000040 10000050 10000060 100000"5m""1y"To fit the linear model with the design matrix: fit -lmFit(exp, design) names(fit)[1 ] "coefficients""rank""assign"[5 ] "df.residual""sigma" "cov.coefficients"[9 ] "pivot""genes" "method""qr""stdev.unscaled""design"Here, the design matrix is in a group means parameterization,where the coefficients are the mean expression of each group. Tofind the differences among these coefficients, an explicitly definedcontrast matrix is required. For this dataset, we generated all thepair-wise comparisons. contr.str -c() len -length(lev) for(i in 1:(len-1)) contr.str -c(contr.str, paste(lev[(i 1):len], lev[i], sep "-")) contr.str[1 ] "NN-E12.5" "A1w-E12.5" "A4w-E12.5" "A3m-E12.5" "A5m-E12.5" "A1yE12.5"[7 ] "A1w-NN" "A4w-NN" "A3m-NN" "A5m-NN" "A1y-NN" "A4w-A1w"[13 ] "A3m-A1w" "A5m-A1w" "A1y-A1w" "A3m-A4w" "A5m-A4w" "A1y-A4w"[19 ] "A5m-A3m" "A1y-A3m" "A1y-A5m" contr.mat -makeContrasts(contrasts contr.str, levels lev) fit2 -contrasts.fit(fit, contr.mat) fit2 -eBayes(fit2) names(fit2)[1 ] "coefficients" "rank""assign""qr"[5 ] "df.residual" "sigma""cov.coefficients""stdev.unscaled"
Bioinformatics Analysis of Microarray Data[9 ][13 ][17 ][21 prior" roportion""lods"Now "coefficients" in the "fit2" contains difference,or log 2 fold change, and "p.value" is the moderated t-test pvalue associated with all the pair-wise comparisons. "F" and"F.p.value" is the moderated F-test given for all those comparisons. The statistics for the changes of all genes across all groupscan be retrieved, sorted by F-test p-values, integrated with geneannotation and output into a tab-delimited file: f.top -topTableF(fit2, number nrow(exp))f.top -cbind(ann [f.top[[1]] 1:4], f.top[,c(2:7, 23:25)])write.table(f.top, file "f.top.txt", sep "\t", row.names F, quote F)head(f.top)ProbeSet GeneID Symbol14955 at 14955 at14955H1916002 at 16002 at16002Igf212797 at 12797 at12797Cnn115126 at 15126 at15126 Hba-x98932 at 98932 at98932Myl920250 at 20250 at20250Scd2GeneName14955 atH19 fetal liver mRNA16002 atinsulin-like growth factor 212797 atcalponin 115126 at hemoglobin X, alpha-like embryonic chain in Hba complex98932 atmyosin, light polypeptide 9, regulatory20250 atstearoyl-Coenzyme A desaturase 2NN.E12.5 A1w.E12.5 A4w.E12.5 A3m.E12.514955 at -0.1262318 -1.368427 -4.639086 -5.98333016002 at -0.2315497 -1.185102 -3.823067 -4.82522112797 at -5.6486004 -5.710477 -6.103997 -6.37526115126 at -4.8768229 -5.507456 -5.037622 -5.26748998932 at -0.4566940 -1.719379 -3.931495 -4.21832320250 at -0.7785607 -1.832313 -3.600636 -3.994683A5m.E12.5 A1y.E12.5FP.Value14955 at -5.572897 -5.783935 1087.2210 2.099165e-2516002 at -4.705602 -4.761241 819.2029 4.251770e-2412797 at -6.160193 -6.254116 654.1071 4.635634e-2315126 at -5.100509 -5.210385 567.7905 2.078625e-2298932 at -4.957873 -4.828438 430.2656 3.916275e-2120250 at -3.860944 -4.052382 429.1944 4.020864e-21adj.P.Val14955 at 8.043999e-2216002 at 8.146390e-2112797 at 5.921249e-2015126 at 1.991323e-1998932 at 2.243523e-1820250 at 2.243523e-18The middle columns (nos. 5–10) of the table contain the log 2fold changes of all other time points vs. embryonic 12.5 d.p.c. Wecan loop through all two-group comparisons and output theresults: for(i in 1:ncol(contr.mat)){t.top -topTable(fit2, coef i, number nrow(exp))t.top -cbind(ann[t.top[[1]],], t.top[, 2:ncol(t.top)])write.table(t.top, sep "\t", row.names F, quote F,
272Zhang, Szustakowski, and Schinke sep "."))) }Clustering analysis has been widely applied to gene expressiondata for pattern discovery. Hierarchical clustering is a frequently used method that does not require the user to specifythe number of clusters a priori (see Note 5). Since all genescontribute equally, genes with no changes between groups onlyadd noise to the clustering. Thus, statistical filters are oftenapplied to eliminate such genes prior to the clustering procedure. In our dataset, there were a large number of filteredgenes (2,663, 69.6%) with a statistically significant changeabove a Benjamini–Hochberg (BH) (10) adjusted p-value cutoff of 0.01. Consequently, we further limited the clusteringto those genes that showed at least a twofold differencebetween any two of the seven time-points. g.2f -(rowSums(abs(fit2[[1]][rownames(exp),]) 1) 0) & (f.top[rownames(exp),] adj.P.Val 0.01) sum(g.2f)[1 ] 1680A total of 1,680 genes passed this criteria. The gene expressionmatrix was standardized before calculating the Euclidean distancesbetween the genes. exp.std -sweep(exp, 1, rowMeans(exp))row.sd -apply(exp, 1, sd)exp.std -sweep(exp.std, 1, row.sd, "/")save(exp.std, file "obj/exp.std.RData")exp.cl -exp.std[g.2f,]Several different clustering methods are provided in the"hclust" function. Here, we chose Ward’s minimum variancemethod which aims to find compact, spherical clusters (Fig. 15.6).1500Height2500Cluster Dendrogram0 5003.8. Clustering Analysisfile file.path("limma", paste(contr.str[i], "top.txt",dist.euhclust (*, “ward”)Fig 15.6. The dendrogram generated by hierarchical clustering according to Ward’sminimum variance method.
Bioinformatics Analysis of Microarray Data273 hc.res -hclust(dist.eu, method "ward") plot(hc.res, labels A1wNNA1wNNNNE12.5E12.5E12.5The tree can be cut into branches (clusters) by specifying theheight or number of branches desired. Usually, we cut the treeright above the height where the branches become dense. In thisexample, the dendrogram was cut into seven final clusters. Thegene expression data can be displayed in a heatmap in the order ofthe dendrogram (Fig. 15.7).Fig. 15.7. Heatmap of genes in the order of the dendrogram shown in Fig. 15.6. The timepoints and the clusters are indicated by the row and column side shadings, respectively.Time points are sorted by increasing age (E12.5 d.p.c. to 1 year of age) from left to right. [1 clus.res -cutree(hc.res, k 7)hclust.ward -function(d, . . .){hclust(d, method "ward", . . .)}heat.res -heatmap(exp.cl, scale "none", labRow "",labCol as.character(info Group),Colv NA, hclustfun hclust.ward,ColSideColors topo.colors(7)[as.numeric(info Group)],RowSideColors rainbow(7)[clus.res],col dChip.colors(10))names(heat.res)] "rowInd" "colInd" "Rowv" "Colv"head(clus.res[heat.res rowInd], n 4)17069 at18830 at 100040340 at78330 at3333 tail(clus.res[heat.res rowInd], n 4)20200 at 104130 at 69094 at 56213 at7777The cluster number associated with each gene can be extractedand output into a text file. For easy interpretation of the clusters,genes were ordered exactly the same as they appeared in theheatmap with the clustered numbers 1–7 from top to bottom.
274Zhang, Szustakowski, and Schinke clus.order -unique(clus.res[heat.res rowInd]) clus.order ##this is from bottom to top in the heatmap[1 ] 3 2 1 4 6 5 7 gene.clus.order -match(clus.res[heat.res rowInd], clus.order) names(gene.clus.order) -names(clus.res[heat.res rowInd]) head(gene.clus.order)17069 at 18830 at 100040340 at 78330 at 101540 at 18032 at111111 gene.clus.order -rev(gene.clus.order) gene.clus.order -max(gene.clus.order)-gene.clus.order 1 clus.ann -ann[names(gene.clus.order),] clus.ann cluster -gene.clus.order head(clus.ann[,c(2:3,5)])GeneID Symbol cluster56213 at 56213 Htra1169094 at 69094 Tmem1601104130 at 104130 Ndufb11120200 at 20200 S100a6126968 at 26968 Islr181877 at 81877 Tnxb1 write.table(clus.ann, file "clus.ann.txt", sep "\t", row.names F,na "")The functional enrichment for each cluster can be calculatedusing the ‘‘GOstats’’ package from Bioconductor, or using theweb-tool DAVID (Database for Annotation, Visualization, andIntegrated Discovery, http://david.abcc.ncifcrf.gov (11).3.9. Pathway (GeneSet) AnalysisGene-set analysis is especially helpful for identifying the biologicalthemes related to changes between two conditions or for correlation with a specific numeric phenotypical measurement. FollowingMootha’s Gene-Set Enrichment Analysis (GSEA), Tian et al. (12)proposed to rank gene-sets based on two statistics, NTk and NEk,and estimate q-values for each pathway or gene-set to address twodifferent aspects in pathway analysis. Given a gene-set g, NTkcomputes whether g is significantly changed compared to allother gene-sets. NEk serves as an indicator of whether the geneswithin g as a whole group are significantly correlated with thephenotype. ‘‘sigPathway’’ is an R package implementation of themethod (see Note 6). Here, we show how to use sigPathway inorder to identify pathways that are statistically significantly diffe
Both R and Bioconductor are under active development by a dedicated team of researchers with a commitment to good doc-umentation and software design. We assume that the reader has a basic understanding about data structures and functions in R programmi