Transcription
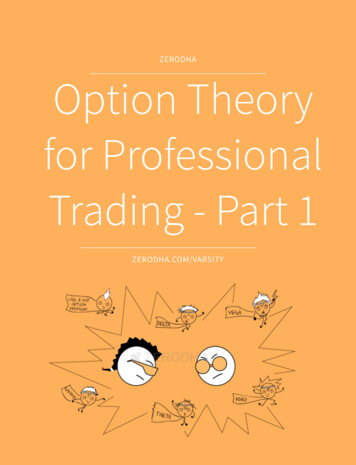
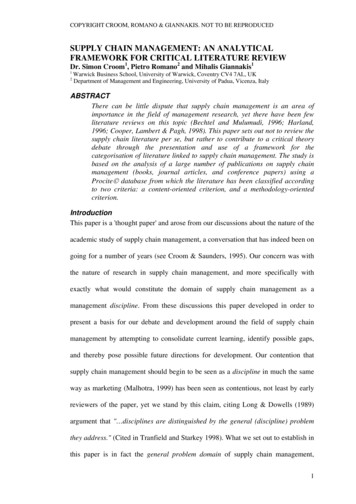
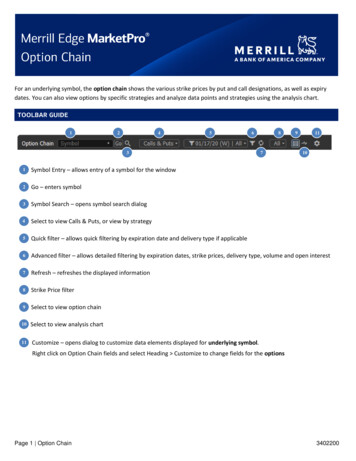
For an underlying symbol, the option chain shows the various strike prices by put and call designations, as well as expirydates. You can also view options by specific strategies and analyze data points and strategies using the analysis chart.12456387911101Symbol Entry – allows entry of a symbol for the window2Go – enters symbol3Symbol Search – opens symbol search dialog4Select to view Calls & Puts, or view by strategy5Quick filter – allows quick filtering by expiration date and delivery type if applicable6Advanced filter – allows detailed filtering by expiration dates, strike prices, delivery type, volume and open interest7Refresh – refreshes the displayed information8Strike Price filter9Select to view option chain10Select to view analysis chart11Customize – opens dialog to customize data elements displayed for underlying symbol.Right click on Option Chain fields and select Heading Customize to change fields for the optionsPage 1 Option Chain3402200
To customize columns for the option contracts, right click on the option column headers and select Heading, or selectCustomize iconfrom toolbar and click Customize Option Table Fields. Select from pre-defined views: Basic; Greeks; Price Range and Analytics. Select Customize to define your own viewTo customize columns for the underlying symbol header, right click on underlying symbol header and select Fields, orselect Customize iconfrom toolbar and click Customize Equity Fields. Select from pre-defined views: Mutual Fund; Stock Option; Stock; Index; Money Fund; ETF and Bond. Select Customize to define your own viewRight click in the Option Chain window and select Show Selected Option Symbol Details to enable an option data bar.This will show details for the currently selected option contract. The fields shown in the bar can be customized by rightclicking in the bar and selecting Fields.Page 2 Option Chain3402200
Strike Ranges:There are built-in filters on the toolbar for the following: In the Money: A call option is in the money when the strike price is below the spot price. A put option is in themoney when the strike price is above the spot price. Near the Money: A user definable number of out of the money options that are closest to being at the money.Define “Near the Money” in advanced filter (select iconfrom toolbar) Out of the Money: A call option is out of the money when the strike price is above the spot price. A put option isout of the money when the strike price is below the spot price. All Strikes: Removes the strike price filters. Extended strike price filtering is available using advanced filter (select iconfrom toolbar)Due to more complex deliverables, the general in/out of the money rules defined above may not apply to adjustedoptions which are denoted with symbolExpiration Dates: Select an individual expiration month from quick filter drop down on toolbarWeekly expirations (options that expire on dates other than the third Friday of the month) are noted with “(W)”following expiration dateQuarterly expirations (options that expire on the last trading day of each quarter) are noted with “(Q)” followingexpiration dateExtended expiration date filtering is available using advanced filter (select iconfrom toolbar)Calls/Puts: Right click in the Option Chain window and select View Mode Simple Column Mode (Calls only) or SimpleColumn Mode (Puts only) to enable display of only Calls or Puts.Delivery Type: Select delivery type of Regular, Mini or All from the quick filter drop down on toolbarFilter will only be available if the security supports mini optionsStrike prices will be noted with icons to indicate Miniand AdjustedoptionsDelivery filtering is available using advanced filter (select iconfrom toolbar)Advanced Filtering:Select filter iconto expand / collapse the filter dialog to filer using a combination of expiration dates, strike prices anddelivery types displayed, volume and open interestPage 3 Option Chain3402200
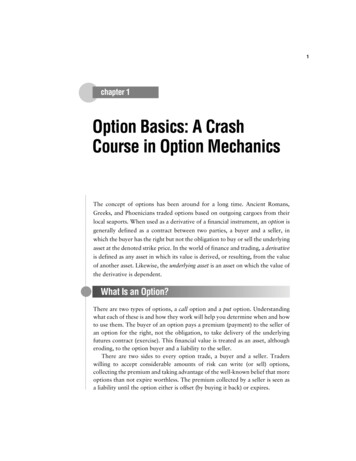
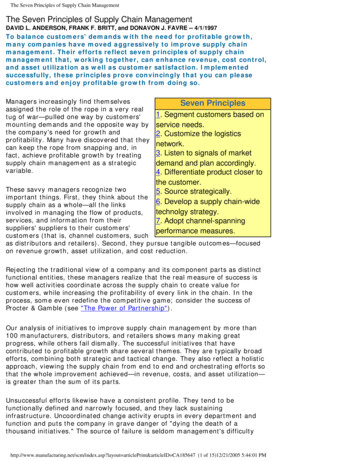
Select display of option chain only, option chain & analysis chart or analysis chart only from main toolbarAnalysis Chart Toolbar:1231Analysis Parameter – allows user to select analysis parameter to be plotted2Option Type – allows user to select Call or Put for analysis3Refresh – refreshes the displayed dataAnalysis chart displays user selected option analysis parameter (Mark Price, Implied Volatility or Greeks) on y-axis againststrike price on x-axis for all selected expiration datesFilters for Expiration Date, Strike Price and Delivery type will filter data displayed in chartDefine font, line colors, chart position, line types, grid lines, data view display and data point marker settings for analysischart from Right Click Display Properties Option Analysis ChartRight click on option symbol to take one of the following actions. Selectable actions are determined by current holdingsand approved option trading level. To select a default account and other trading defaults (order type, duration, quantity),right click in Trade window and choose Trade Defaults and Properties Option Trade Ticket Buy to Open or CloseSell to Open or CloseBuy / WriteBuy Vertical SpreadSell Vertical SpreadBuy Calendar SpreadSell Calendar SpreadBuy Diagonal SpreadSell Diagonal SpreadLong StrangleLong StraddleShort StraddleShort StrangleRollPage 4 Option Chain3402200
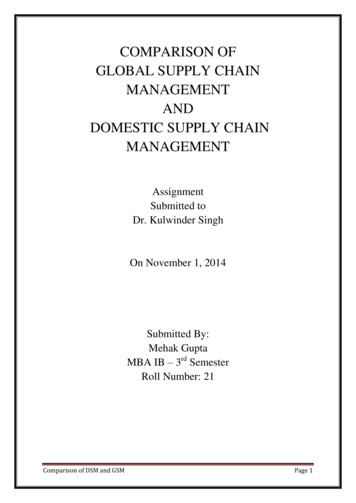
Additional trading features: Right click on ask price for a Buy Stop or Sell Limit orderRight click on bid price for a Buy Limit or Sell Stop orderHighlight a held option and another option (using ctrl or shift), then right click and select Roll to prepopulate thetrade ticket with the specified roll order.Trading in underlying security: Right click on underlying symbol for Buy or SellRight click on bid price of underlying symbol for a Buy Limit or Sell Stop orderRight click on ask price of underlying symbol for a Buy Stop or Sell Limit orderYou can use the option chain to perform analysis of several option strategiesTo begin, select a strategy from the Calls & Puts menuUse the quick filters or advanced filters to further refine which options are displayedThe following data elements are shown for each of the option pairsStrike – Strike prices for the pair of optionsSymbols – Symbols for the pair of optionsNet Bid – Net bid for the pair of optionsNet Ask – Net ask for the pair of optionsMid – Average of Net Bid and Net AskM/G – Maximum Gain. The maximum gain possible for the strategy with the selected optionsM/L – Maximum Loss. The maximum loss that would be incurred for the strategy with the selected optionsB/E – Break Even. The stock price (or prices) at which the strategy neither makes nor loses money with theselected options.R/R Ratio – Risk/Reward Ratio Maximum Loss divided by Maximum GainPage 5 Option Chain3402200
Right click on an option pair and select Open name of strategy to trade that option pair Enable the analysis chartdatefrom the main toolbar to plot the Mid-Point or Risk/Reward Ratio for each expirationUse RTD (Installation Instructions) to display streaming real time data in Excel (Windows only). Once the plugin isinstalled, right click RTD and select which data to copy, which can then be pasted into an Excel worksheet. Data willcontinue to stream within Excel as long as MarketPro remains active.Select linking icon to adjust window linking settingsWith “Link to All” enabled, window will receive symbols selected from other windows (default)With “Link to All” enabled, clicking on any option will send option to linked symbol windows (default setting –right click Display Properties Symbol Field to change action that takes place when selecting symbols )With “Symbol Broadcast Source” enabled, window will send entered stock symbols to other windowsColors: If selected, window will only send/receive symbols from windows set to the same color or link to all in linksettingsRight click on the option symbol to launch another symbol-based window with the symbol in contextRight click on the stock information to launch another symbol-based window with the symbol in contextPage 6 Option Chain3402200
Select the options iconto adjust window options New - Creates a new window. Select the window type, then select the position of the new window, or choose “Inthis window” to replace existing window with the new window. Show Window Title – Un-selecting this option hides the window description. Re-check to display windowdescription. Maximize/Restore – Only displayed if window does not fill entire page. Maximize expands the window to fill thecurrent page. Restore will set back to original size. Show Titlebar - Un-selecting this option hides the title bar that is displayed at the upper left. To show the title baragain, move cursor up to the top of the window until the cursor pointer turns to a hand, then right click and recheck Show Titlebar, or from main menu select View Show Title Bars (this will restore all hidden title bars) Show Titlebar description – Display custom description as defined using Customize Titlebar Description Customize Titlebar Description – Replaces default description and titlebar controls with a customizabledescription. For symbol specific windows, use #sym to insert currently selected symbol into custom description.Click anywhere on the titlebar to restore default description and titlebar controls. Show Footer - Un-selecting this option hides the footer. Re-select to display the footer again. Copy Out (displayed when window is docked) – Copies this window as a floating (stand alone) window. Thisaction can also be performed using the Copy Out icon Attach (displayed when window is un-docked) – Moves a floating (stand alone) window inside the active page Cut Window - copies the window to the clipboard, and removes the window from the workspace. Once copied,click Edit Paste Options Chain to add the window to the workspace using default settings for adding a newwindow (use View Preferences Workspace Open new window by default to change how new windows areadded to the workspace) Copy Window – copies the window to the clipboard, with all settings. Once copied, click options icon and choosePaste Options Chain, then choose a position for copy of window. Or click Edit Paste Options Chain to add thewindow to the workspace using default settings for adding a new window Copy Window Image – copies an image of the window to the clipboard, which can then be pasted into an email,document or image editing application Send Image by E-mail - creates new email message using default email client with screenshot of current windowattached Take Custom Screenshot – drag mouse to define an area to copy, then paste into image editor Print – Prints this window Help – loads this help file Display Propertieso Text & Colors – font setting for display elementso Direction – define colors and columns for quote display based on price direction, volume and open interesto Symbol field – turn on/off indicators for open positions / active orders, and default actions on click / doubleclicko Gridlines – display and color of gridlineso Formatting – general window formattingo Black Scholes – define parameters used in Black Scholes calculationo Heat Map – enable/disable heat map display and configure columns to display using heatmap coloringo Quotes – define display properties for quote informationo Option Analysis Chart – define font, line colors, chart position, line types, grid lines, data view display and datapoint marker settings for analysis chart Empty - (displayed when window is docked) – removes the window and leaves an empty space in which a newwindow can be added Close – removes the window. Any remaining windows will be adjusted to fill empty spacePage 7 Option Chain3402200
Fields for Option Data displayed% ChangePercentage price change for current trading session% In/Out of MoneyAskPercent difference between last price and strike priceAsk price (lowest available selling price)Ask ExchangeAsk SizeBasecodeExchange of ask priceQuantity available to sell at ask priceDetermines the method of Price base code translation (1/10, 1/100, etc)BidBid price (highest available buying price)Bid ExchangeBid SizeBid/Ask SizeBid-AskContract DeliverableContract HighContract High DateContract LowContract Low DateDateDays Til ExpirationDeltaExchange of bid priceQuantity available to buy at bid priceThe bid and asks size (side-by-side in same cell)The bid and ask price (side-by-side in same cell)Number of shares represented by an option contractThe High over the life of the ContractThe Date that the Contract High was setThe Low over the life of the ContractThe Date that the Contract Low was setDate of last update - can be trade or quote updateOptions: Number of days until the expiration of an option contractThe neutral hedge ratio, or the expected change in the option premium given a one pointchange in the price of the underlying Instrument (Measure of the options sensitivity to changesin the Underlying Instrument)DescriptionEquities, Indices, futures: Name. ETFs, ETNs & Mutual Funds: Issuer. Currency: Base Currency.Options: Underlying, Month, Strike, Type.Description2For mutual funds, the name of the fund (i.e., the "issue"). Equities with SEDOLs will displaySEDOLExchangeExpirationGammaExchange security is listedOptions and futures: Date of expiration.Measure the expected change in Delta, given a one point change in the value of the underlyingInstrument (Measures the stability of the options Delta)HighHighest trading price for the current sessionImpVolCalculated by using an option pricing model and is the amount of price change that can beexpected over a given period of time, expressed as a percentage.Intrinsic ValueDifference between the last price for underlying security and the option strike price. Onlycalculated for options in the moneyIssue DescriptionETFs: Part of Instrument's name.Page 8 Option Chain3402200
LastLast price the asset has tradedLast Trade TimeLast ChangeDate and Time of Last TradeCombination of the Last and the Change between the Last traded price, and the previoussession's closeLast SettleLowLast settlementLowest price traded in the current sessionMarketThe Average of the Bid & Ask. If Bid 0 it will be Ask. If Ask 0 it will be Bid. If neither are presentthan Market will equal Recent.Mid PriceThe Average of the Bid & Ask. If Bid 0 it will be Ask. If Ask 0 it will be Bid. If neither are presentthan Market will equal Recent.Mid Price ChangeMidpointNet ChangePercentage Mark Price change for current sessionMid price between session's High and Low pricesDifference between the Last traded price, and the previous session's closeNewSettlementOld Set IVOldSettlementOpenYesterday's Implied Volatility at the close price.Opening priceOpen InterestOption TypeOption Type (S/NS)Previous CloseOptions: The number of outstanding option contracts in the exchange marketFor options only, either Put or CallOption delivery type, S Standard, NS Non Standard, i.e. Adjusted deliverableLast price the asset traded in the previous trading sessionRecentRhoLast Trade or Settlement, whichever is more current.Measures the expected change in the option Premium, given a 1% change in the DomesticInterest Rate.RootStrikeTheoretical PriceOptions: Complete symbol of the underlying assetOptions: Strike priceThe value of an option as calculated by the option pricing model using the previous sessionsclosing implied volatility.ThetaReflects expected change in the option Premium, over one day (Measure of time value decay).TickEither or - to representing the change from the previous Trade Price when instrument iscurrently trading and a "C" when the session is closed for Equities and Options and a "S" whenFutures contracts are settledTimeTime ValueTime of the last update (Includes Bids / Asks)Difference between the option last price and its intrinsic value. Only calculated when intrinsicvalue is defined.Trade ExchangeTrade SizeUnderlying symbolVegaExchange, market center, where last trade occurredQuantity of last tradeOptions: Complete symbol of the underlying assetMeasures the expected change in the option Premium, given a 1% change in the ImpliedVolatility of the option (Measures sensitivity to shifting volatility levels).Page 9 Option Chain3402200
VolumeThe number of shares traded from the current day's market opening until the reported tradetime.Fields for underlying security Change Week% Change change of current price to closing price 1 week ago.Percentage price change for current trading session% Change 1 Month% Price change of current price to the mean of high & low price from onemonth ago% Price change of current price to the mean of high & low price from threemonths ago% Price change of current price to the mean of high & low price from sixmonths ago% Price change of current price compared to closing price from one month ago% Price change of current price compared to closing price from one week agoPercent difference between last price and strike pricePercent difference between last night's close and the close 52 weeks ago.Percent difference between last night's close and the close 52 weeks ago, plusany dividends received.% Change 3 Month% Change 6 Month% Change Month% Change Week% In/Out of Money12Mo % Return12Mo %Tot Return12Mo Div Pd12Mo Prev Close1Mo % Ret Adj1Mo % Tot Ret Adj52Wk H Date52Wk HighValue of dividends paid per share over 12 month period.A security’s closing price from 12 months ago% return over 1 month% return over 1 month with the addition of any dividends paid out over 1month.A security’s closing price from 1 month agoSum of dividends paid for 1 share over the past 1 monthReturns the following values of which are applied to return calculations basedon a spinoff corporate action. S The return has been zeroed out due to a spinoff N The return is zero for other reasons (likely, no price on one of the twodates) Y the return is present% return over 3 month% return over 3 months with the addition of any dividends paid out over 3months.A security’s closing price from 3 months agoSum of dividends paid for 1 share over the past 3 monthsReturns the following values of which are applied to return calculations basedon a spinoff corporate action. S The return has been zeroed out due to a spinoff N The return is zero for other reasons (likely, no price on one of the twodates) Y the return is presentDate the maximum price was reached in the previous 52 weeksMaximum price for the last 52 weeks52Wk High Percent BelowPercent Below 52 Week High using current price1Mo Begin Pr Adj1Mo Cash Div Pd1Mo SpinOff3Mo % Ret Adj3Mo % Tot Ret Adj3Mo Begin Pr Adj3Mo Cash Div Pd3Mo SpinOffPage 10 Option Chain3402200
52Wk L Date52Wk LowDate the minimum price was reached in the previous 52 weeksMinimum price for the last 52 weeks52Wk Low Percent Above52Wk Range with LastPercent Above 52 Week Low using current priceDisplay the 52 week price range, low to high, along with the last trading price'srelative position in the range6Mo % Ret Adj6Mo % Tot Ret Adj% return over 6 months% return over 6 months with the addition of any dividends paid out over 6months.A security’s closing price from 6 months agoSum of dividends paid for 1 share over the past 6 monthsReturns the following values of which are applied to return calculations basedon a spinoff corporate action. S The return has been zeroed out due to a spinoff N The return is zero for other reasons (likely, no price on one of the twodates) Y the return is presentIf regularly paid (i.e., quarterly, monthly), this is the total dividends expectedto be paid over the next 12 months. In some cases, the amount and timing ofdividends are irregular, and therefore impossible to forecast - in those cases,we sum up dividends paid over the last 12 months.6Mo Begin Pr Adj6Mo Cash Div Pd6Mo SpinOffAnnual DividendAnnual RevenueAskAnnual Revenue in millionsAsk price (lowest available selling price)Ask ExchangeAsk SizeAverage VolumeBasecodeExchange of ask priceQuantity available to sell at ask priceAverage volume for previous 20 daysDetermines the method of Price base code translation (1/10, 1/100, etc)BETAA measurement of the sensitivity of a company's stock price to the overallfluctuation in the S&P 500 (S&P 500), or for Canadian listings, the TorontoStock Exchange 300 Index. For example, a beta of 1.5 indicates that acompany's stock price tends to rise (or fall) 1.5 percent, with a 1 percent rise(or fall) in the index price.Bid price (highest available buying price)BidBid ExchangeBid SizeBid/Ask kTradeVol2Page 11 Option ChainExchange of bid priceQuantity available to buy at bid priceThe bid and asks size (side-by-side in same cell)The bid and ask price (side-by-side in same cell)Number of trades between 1 and 49,999 sharesNumber of trades between 50,000 and 99,999 sharesNumber of trades over 100,000 sharesAggregate number of block tradesAggregate volume of block tradesAggregate volume of shares traded in trades between 1 and 49,999 sharesAggregate volume of shares traded in trades between 50,000 and 99,999shares3402200
BlockTradeVol3Book ValueBook Value per ShareBuyerIDAggregate volume of shares traded over 100,000 sharesThe book value of a company, in millions.Book Value / Common Shares OutstandingThe TSX assigned ID number for the broker on the buy-side of a trade(Canadian securities only)Category NameContract DeliverableContract HighContract High DateContract LowContract Low DateCurrencyCurrent Inside Match PriceType of securityNumber of shares represented by an option contractThe High over the life of the ContractThe Date that the Contract High was setThe Low over the life of the ContractThe Date that the Contract Low was setCurrency the security trades inThe Current Inside Match Price reflects the price for which the number ofPaired Shares and the number of Imbalance Shares are calculated. Please notethat the Current Inside Match Price is determined by the price within theNASDAQ Inside where the maximum number of shares are paired, theimbalance is minimized and the distance from the bid-ask midpoint isminimized, in that order. If this field is null or blank, it is because there is noCurrent Inside Match Price for the specific security.Current RatioCUSIPNote: Market Depth qualification is required to use this fieldTotal Current Assets / Total Current Liabilities, on a trailing 12-month basisThe 9-character identifier for North American securitiesDateDays Til ExpirationDeltaDate of last update - can be trade or quote updateOptions: Number of days until the expiration of an option contractThe neutral hedge ratio, or the expected change in the option premium given aone point change in the price of the underlying Instrument (Measure of theoptions sensitivity to changes in the Underlying Instrument)DescriptionEquities, Indices, futures: Name. ETFs, ETNs & Mutual Funds: Issuer. Currency:Base Currency. Options: Underlying, Month, Strike, Type.Description2For mutual funds, the name of the fund (i.e., the "issue"). Equities with SEDOLswill display SEDOLDiv, Date AnncDiv, Pay DateDiv, Prev XDateDiv, Rec DateDiv, XdateDate the dividend was announcedDate the dividend was/will be paidDate of the previous ex-dividend dateRecord date of the dividendThe ex-dividend date of the most recently announced or paid dividendDividendSee Fundamentals window Dividend History for more information ondividendsThe dividend farthest out in the future - almost always the most recently paidor announced dividend.Dividend IntervalDividend YieldNumber of days between dividend paymentsDividend Yield (indicated annual dividend / current price) * 100EBITDA (TTM)Earnings before interest, taxes, depreciation, and amortization on a trailing 12month basisPage 12 Option Chain3402200
EPSEPS, Current FYEPS, Exp NextQEPS, Next FYEPS, Next FYDtEPS, Next Two FYEPS, NextQDtEPS, PrevQEPS, PrevQDtExchangeExpirationExtHoursEarnings per share (TTM). Sum of last 4 recently reported earnings (excludingextraordinary items and discontinued operations), divided by outstandingshares.Earnings per share for the current fiscal yearEstimated Amount of Upcoming EarningsEstimated earnings per share for the next fiscal yearEstimated date for the release of the fiscal year’s earnings per shareEstimated earnings per share for the fiscal year after nextEstimated Announcement Date for Upcoming Quarterly EarningsMost Recently Reported Quarterly EarningsAnnouncements Date of Most Recently Reported Quarterly EarningsExchange security is listedOptions and futures: Date of expiration.Last Price during extended hours tradingExtHours Change %ExtHours Net ChangeExtended hours Percentage Change ValueExtended hours change ValueFar indicative clearing priceThis field indicates the price level at which buy orders and sell orders match inthe opening/ closing book. If this field is null or blank, this indicates one of twocircumstances: There are no on-open (or on-close) orders entered for the security; or There is no substantial on-open (or on-close) interest on the opposite side ofthe market to execute all of the MOO (or MOC) orders on the other side.When this occurs, the No Indicative Price field displays either a Market Buy orMarket Sell indicating that offsetting imbalance only orders should be enteredon the other side of the market.For the midday opening process, the Current Inside Match Price, the NearIndicative Clearing Price and the Far Indicative Clearing Price will be equal.Note: Market Depth qualification is required to use this fieldPage 13 Option Chain3402200
FlagsFlagsN News article todayS Split TodayR Record Date is todayX XDiv Date is todayP Pay Date is todaySE Significant event for securityNASDAQ Filing Status codes. Off by default - right click Display Properties Flags to enableD - Deficient: Issuer Failed to Meet NASDAQ Continued Listing RequirementsE - Delinquent: Issuer Missed Regulatory Filing DeadlineQ - Bankrupt: Issuer Has Filed for BankruptcyG - Deficient and BankruptH - Deficient and DelinquentJ - Delinquent and BankruptK - Deficient, Delinquent, and BankruptFloatForward Earnings DateForward P/E Current Fiscal YearForward P/E Current QuarterForward P/E Next Fiscal YearForward P/E Next QuarterForward P/E Next Two Fiscal YearForward P/E Next Two QuarterGammaShares outstanding, less restricted sharesDate which the next earnings announcement is expectedPrice per Share / Expected Earnings per Share, for Current Fiscal YearPrice per Share / Expected Earnings per Share, for Current QuarterPrice per Share / Expected Earnings per Share, for Next Fiscal YearPrice per Share / Expected Earnings per Share, for Next QuarterPrice per Share / Expected Earnings per Share, for next Two Fiscal YearsPrice per Share / Expected Earnings per Share, Next Two QuartersMeasure the expected change in Delta, given a one point change in the valueof the underlying Instrument (Measures the stability of the options Delta)Headline CountNumber of headlines availableHighHighest trading price for the current sessionHistorical VolatilityImpVol20 day close-to-close volatilityCalculated by using an option pricing model and is the amount of price changethat can be expected over a given period of time, expressed as a percentage.IndustryInsider Owned %Institution Owned %Intrinsic ValueIndustry group (sub section of Sector)Insider Owned % Shares owned by insiders / Shares outstandingInstitution Owned % Shares owned by institutions / Shares outstandingDifference between the last price for underlying security and the option strikeprice. Only calculated for options in the moneyISINInternational Securities Identification Number. A unique international codewhich identifies a securities issue.Issue DescriptionETFs: Part of Instrument's name.LastLast price the asset has tradedPage 14 Option Chain3402200
Last News UpdateTimestamp of the last news updateLast Trade TimeLast ChangeDate and Time of Last TradeCombination of the Last and the Change between the Last traded price, andthe previous session's closeLast SettleLowLast settlementLowest price traded in the current sessionMargin CodeMarketY Marginable, N Not marginableThe Average of the Bid & Ask. If Bid 0 it will be Ask. If Ask 0 it will be Bid. Ifneither are present than Market will equal Recent.Market CapMarket capitalization - outstanding, non-diluted number of shares, multipliedby the current share priceMid PriceThe Average of the Bid & Ask. If Bid 0 it will be Ask. If Ask 0 it will be Bid. Ifneither are present than Market will equal Recent.Mid Price ChangeMidpointMinutes DelayedMonth Prev CloseMov Avg 150Percentage Mark Price change for current sessionMid price between session's High and Low pricesReports number of minutes a quote is delayed.The price as of the last workday of the previous monthThe average trade price over the most recent 150 business days, U.S. holidaysand weekends excludedMov Avg 20The average trade price over the most recent 20 business days, U.S. holidaysand weekends excludedMov Avg 200The average trade price over the most recent 200 business days, U.S. holidaysand weekends excludedMov Avg 50The average trade price over the most recent 50 business days, U.S. holidaysand weekends excludedMTD ChangeMTD % ChangeMTD Div Paid change of current price to closing price at the end of the previous monthPercentage Change since the 1st of the Current MonthThe MTD dividend will be the sum of the cash dividends which have gone ex inthe current month.MTD%RetAdjPercentage change between current price and last price of previous month [(current price / previous month's end price) – 1] * 100MTD%TotRetAdjPercentage price change between current price and last price of previousmonth, plus any dividends received for that period [(current price MTD cashdividends) / previous
You can use the option chain to perform analysis of several option strategies To begin, select a strategy from the Calls & Puts menu Use the quick filters or advanced filters to further refine which options are displayed The following data elements are shown for each of the option