Transcription
Big-Data Architecture for Cyber Attack GraphsRepresenting Security Relationships in NoSQL Graph DatabasesSteven Noel, Eric Harley, Kam Him Tam, and Greg GyorCyber Security DivisionThe MITRE CorporationMcLean, Virginia, USA[snoel, eharley, ktam, ggyor]@mitre.orgAbstract— The construction of cyber attack graphs is well studiedin the literature. However, previous approaches generally applyonly specific sets of algorithms against fixed data models. Weintroduce a much more flexible approach for attack graphmodeling, analysis, and visualization based on general-purposeand extensible architecture. In this architecture, the modelschema is implicit, and evolves with the available data sources,rather than being predetermined at design time. Graph patternmatching queries provide flexible analytic capabilities againstarbitrary graph structures. We then process query results in ageneric way for visualization. Our highly scalable implementationincludes the MongoDB document-oriented NoSQL database,Apache Spark for cluster computing, and the Neo4j graphdatabase. We illustrate our approach with a novel attack graphmodel that merges a complex blend of network data, includingtopology, firewall policies, vulnerabilities, attack patterns, andintrusion alerts, through standardized languages for cybersecurity data.Keywords-attack graphs; topological vulnerability analysis;network attack modeling; cybersecurity standards; clustercomputing; NoSQL databasesI.INTRODUCTIONNetwork relationships are complex and can often becombined by adversaries in unexpected ways. We need tounderstand how cyber attackers can leverage initial footholds toextend their reach through the network. Rather than relying onperimeter defenses and being overwhelmed by many pointsources, a unified picture of attacker movement through thenetwork is needed.We must also extend our notion of vulnerabilities, beyondthe usual assumption of system flaws. Once inside a network,attackers can behave in ways that would otherwise beconsidered legitimate, while still achieving their goals.Furthermore, attacker movement does not depend on hostvulnerabilities and configurations alone. The location of hostswithin the overall network topology, security mechanism suchas firewalls (both perimeter and internal), and specific accesspolicy rules can all play roles.Building such a comprehensive web of network attackrelationships poses significant challenges. We must correlatedata from numerous sources (topology, vulnerabilities,client/server configurations, policy rules, trust relationships,security events, etc.) into a common model. An architecture fordata representation and persistence must be flexible and easy toextend, and map naturally to network attack relationships. Forinteroperability with other tools, we should leverage securitydata standards where applicable.Such a model has potential application to a variety of usecases (offensive/defensive, proactive/reactive, etc.), suggestingthe need for ad hoc queries. In many cases, our query andanalytic results are complex graph relationships, motivating theneed for interactive graph visualization.To address these challenges, we introduce an approach formapping multi-step attack vulnerability and event dependenciesthrough networks. We build a predictive model of possibleattack paths, which we correlate with network events (intrusionalerts, sensor logs, etc.). We consider vulnerabilities not onlyin the sense of exploitable system flaws, but also legitimateaccesses that can be leveraged once an attacker has establisheda foothold inside the network.Correlating detected attack events with potential attackpaths gives the best options for response, especially forprotecting critical assets, and improves situational awareness,e.g., inferring missed attack steps and identifying falsepositives. We store the resulting attack graph in Neo4j [1], aNoSQL graph database. This is much more flexible for ourproblem domain than a relational database, and providessignificantly better performance for graph analytics.II.PREVIOUS WORKA variety of approaches have been proposed for analyzingmulti-step attacks through cyber networks. A predominantmeta-model in this problem domain is to represent attackrelationships as graphs or trees. The abstractions and semanticsfor these kinds of graphs vary depending on the network entitiesunder consideration and the kinds of analytics supported.For example, graphs can represent network state transitionsleading to attack goals [2][3], attacker exploitation steps relatedby preconditions and postconditions [4][5], intrusion alertsequences [6][7], logical dependencies for attack goals [8][9], orhost attack reachability [10][11][12]. Attack graphs have alsobeen implemented with the relational database model [13]. Weshow results for the attack graph tool Cauldron [14] as a baselineof comparison for our much richer model.Approved for Public Release; Distribution Unlimited. Case Number 14-3549
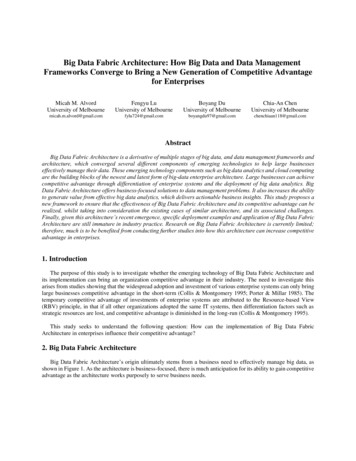
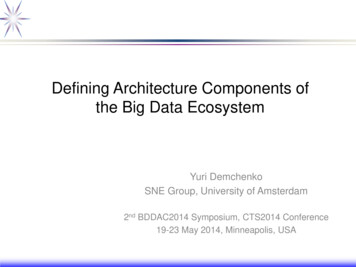
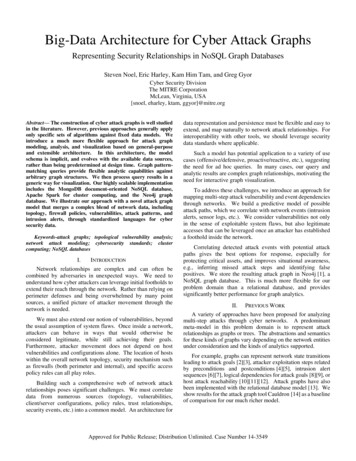
A common theme in these kinds of approaches is to focus ona limited set of entity types in the graph model. These systemshave generally been designed with fixed data models andalgorithms, making them expensive to extend to new datasources and analytics. However, security concerns in realenvironments are complex and always evolving. Our aim is anextensible and scalable framework that can incorporate a richvariety of data about potential and actual adversary activities,supporting ad hoc queries and interactive visualization of queryresults.The result of our iterative analysis is a graph of potentialattack steps and associated network events, which we store in aNeo4j graph database. Graph databases represent nodeadjacency without indices, via direct pointers. The relationalmodel relies on expensive join operations (Cartesian products)when traversing graph edges, having complexity O(nd) fortraversals of depth d over n graph nodes. In Neo4j, traversalsfollow direct links (edges only) so that complexity depends onlyon the size of query results sub-graph, independent of the totalgraph.Our data model incorporates standardized languages forcyber security (developed by MITRE and others) knowncollectively as Making Security Measurable [15]. Thisincludes Common Vulnerabilities and Exposures (CVE) [16],Common Vulnerability Scoring System (CVSS) [17], CommonWeakness Enumeration (CWE) [18], Common PlatformEnumeration (CPE) [19], and Common Attack PatternEnumeration and Classification (CAPEC) [20].As a simple example, consider Figure 2. This illustrates theattack graph model employed by the Cauldron tool. It definesprotection domains (e.g., a subnet or enclave), which containmachines with vulnerabilities. Implicitly, a machine can reachthe vulnerabilities of all other machines in its domain. Graphedges across domains (exploits) are vulnerabilities that areexposed over the network (e.g., through firewalls) and reachableby machines in other domains.APPROACHMachine 1.1Vuln 1.1.1Machine 2.1Vuln 1.1.2Machine 1.2DomainDomain 22Figure 1 shows the components of our system for mappingattack relationships through a network. We ingest data fromvarious sources, map them to a common environment model.We analyze elements of the environment model for potentialattack paths, and associate them with network events (alerts,logs, etc.). We store the resulting attack graph in a Neo4jdatabase.DomainDomain 11III.Vuln 1.2.1Vuln 1.2.2Vuln 2.1.1Vuln 2.1.2Machine 2.2Vuln 2.2.1Vuln 2.2.2Vuln 1.2.3Vuln 2.2.3Exploit12ExploitDomainDomain 33Exploit 32ExploitMachine 3.1Vuln 3.1.1Figure 2. Protection domains, machines, vulnerabilities, and exploits.Figure 1. Components for cyber attack mapping.We ingest data from various sources relevant to attacks (bothpotential and actual). For this, we rely primarily on the Splunkplatform [21]. The ingest process maps the data to an agnostic(vendor-neutral) model using standardized language. TheCauldron tool ingests data from vulnerability scans and firewallconfigurations. We include additional sources for a much richerdata model, including network flows, IDS/IPS alerts, anti-viruslogs, operating system logs, host inventory agents, and proxyserver logs. For mapping network attack relationships (e.g.,testing source/destination/protocol/port combinations in firewallrules) we leverage Apache Spark [22], which has an in-memorycompute model optimized for iterative computation on ApacheHadoop [23] clusters. As input, we build a model of the networkenvironment and events, stored in MongoDB [24].Figure 3 shows our Neo4j representation of the attack graphin Figure 2. Neo4j employs the property-graph model [25]. Aproperty graph contains nodes and nodes (vertices) andrelationships (edges). Nodes and relationships are named;relationships are directed. Nodes and relationships can alsocontain properties, which are key-value pairs. A particular kindof property are labels, which define groups (types) of nodes orrelationships.Figure 3 has four node labels {Exploit, Machine, Vulnerability,Domain} and four relationship labels {IN, ON, LAUNCHES,AGAINST, VICTIM}. Machine-domain membership is:INd:Domainm:Machine:IN This represents that machine m is in protection domain d. Theedges are needed in both directions to support graph traversalqueries, which are directional. This allows traversal in bothdirections (from machine to domain and domain to machine), asneeded to follow a particular flow of attack, including attacksteps implicitly possible within a domain.Approved for Public Release; Distribution Unlimited. Case Number 14-3549
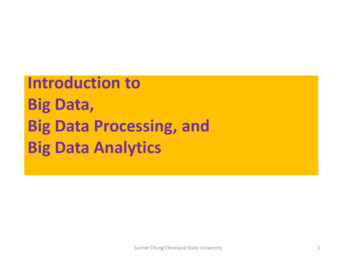
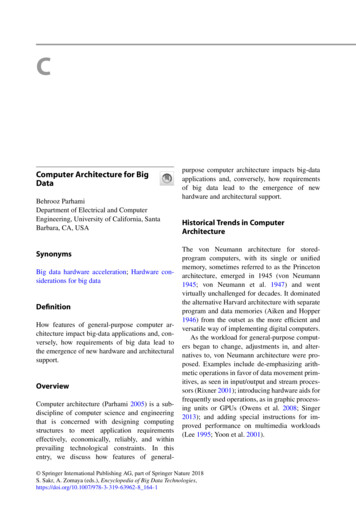
Figure 4. Query result for paths between two chosen machines.IV.Figure 3. Attack graph represented as property graph.This explicitly encodes the domain membership that isimplicit in Cauldron. An advantage of the protection domainabstraction is that the number of edges among machines in adomain is linear in the number of machines rather thanquadratic [26]. Our property-graph representation retains thisadvantage. However, in Cauldron, the implicit domainmembership is built into the system, and cannot be changed forcases in which the assumption of full access among machinesdoes not hold. In our flexible property-graph representation, wecan simply omit protection domains, and explicitly connectmachines through exploits.ILLUSTRATIVE EXAMPLEIn this section, we examine our approach to our cyber attackmodeling. We first compare it to an existing attack graph tool(Cauldron). We then extend the baseline attack graph modelwith richer content for more in-depth analysis. Figure 5 showsthe network for this illustrative example.Here is the representation for vulnerability v on machine m:v:Vulnerability:ONm:Machine An exploit e from machine m1 against vulnerability v on machinem2 is thenm1:Machine tv:Vulnerabilitym2:Machine With this basic attack graph representation as a propertygraph, we can perform the same kinds of analysis as theCauldron tool. For this we leverage the Cypher querylanguage [25] for Neo4j. For example, this Cypher querytraverses the graph of Figure 3, finding all paths of exploitablevulnerabilities between a particular pair of machines:Figure 5. Network for illustrative example.The internal network is segmented into three protectiondomains (DMZ, mission client workstations, and data center).The external firewall protects the internal network from theoutside, and the internal firewall protects the critical data-centerservers. Intrusion detection sensors monitor traffic crossingthrough the firewalls. Figure 6 is the resulting attack graphgenerated by the Cauldron tool.MATCH path (start:Machine {name:'Machine 1.1'})-[r:LAUNCHES VICTIM IN*]- (end:Machine {name:'Machine 3.1'})RETURN pathFigure 4 shows the result of this query.This query seeks a sub-graph starting on Machine 1.1 (inDomain 1) and ending on Machine 3.1 (in Domain 3). Itconstrains the matching sub-graph to relationships of typeLAUNCHES, VICTIM, or IN. This yields paths of Machine, Domain,and Exploit nodes. That is, it finds paths from the start machineto the end machine, through and across domains as required.Figure 6. Cauldron attack graph for Figure 5.This shows that the DNS server has a known vulnerability,which is exposed (through the external firewall) to the outside.Approved for Public Release; Distribution Unlimited. Case Number 14-3549
The client workstation has two vulnerabilities, one of which isexposed to the outside. In the data center, a database has avulnerability, although it is blocked (by the internal firewall)from the other domains. While not shown here, Cauldronsupports drilldown into the details for the vulnerabilities withinand across domains. Assume those details are supplied by avulnerability scanner in terms of CVE.Next, assume that intrusion alerts are generated (red nodes inFigure 7). While Cauldron does not support such real-timeevents, this is a straightforward extension to our model.Consider then this query:We build our model containing domains, machines,vulnerabilities, and exploits as described in the previous section.We then extend the model as additional nodes and relationshipsof our property graph. This includes the network topology(placement of firewalls between domains), attack patterns fromCAPEC, vulnerability details from NVD, and intrusion alerts.Figure 7 is the resulting Neo4j property graph.This query starts on alert nodes, and then traverses the ALERT,AGAINST, VICTIM, and ON relationships, resulting in Figure 9.MATCH path (start:Alert)-[r:ALERT AGAINST VICTIM ON*]- (end)RETURN pathFigure 9. Vulnerable path between intrusion alerts.Figure 7. Neo4j property-graph model for Figure 5.The property graph of Figure 7 is relatively complex.However, the intention is not to necessarily view the full graph.Rather, the property graph provides a rich framework foranalytics and queries. For example, consider this query:MATCH path (start)-[r:IN ROUTES*]- (end)RETURN pathThis query finds the IN and ROUTES relationships of the propertygraph, which define the network topology (domains, machines,and firewall devices). Figure 8 is the result of this query. Thisshows how firewalls separate domains, e.g., to identify theappropriate firewalls for network hardening.By including the AGAINST, VICTIM, and ON relationships in ourquery, traversal leads away from alerts along paths of potentialexploitation (via Exploit nodes). The LAUNCHES relationships isincluded because it spans the set of query result nodes. Thisquery shows that the “client-side buffer overflow” alert (againsta QuickTime vulnerability on the mission client) leads along anexploitable path to the “web application fingerprinting” alert(against the database front-end). From this, we might surmisethat the alerts are potentially multiple attack steps by the sameadversary.We can expand the scope of exploits through this query:MATCH path (start:Alert)-[r:ALERT AGAINST VICTIM ON LAUNCHES*]- (end)RETURN pathThis query adds the LAUNCHES relationship, to show all exploitslaunched when traversing away from alerts, not just immediatevictims. The result is Figure 10.Figure 10. Vulnerable paths in the vicinity of alerts.This shows that there is in fact a larger chain of potentialexploits near the alerts:Figure 8. Query result showing network topology. Client-side buffer overflow against mission client. Lifting of database login credentials on client.Approved for Public Release; Distribution Unlimited. Case Number 14-3549
Logging in to database (via web front-end) from client. Fingerprinting to discover back-end database details. SQL injection attack against the database.This ability to discover vulnerability paths between near alerts isespecially important because in many cases key attackerbehaviors go undetected.Figure 12 is the query result. A CVE node is the root of a subtree for a vulnerability, and nodes for CVSS score, CWEsoftware weaknesses, and references (e.g., vendor bulletins). Inthis example, there is no CVE vulnerability associated with thefingerprinting exploit.We can further extend the search for exploitation paths byignoring the alerts:MATCH path (start)-[r:LAUNCHES VICTIM PREPARES*]- (end)RETURN pathFigure 11 is the query result. This finds all paths involvingLAUNCHES, VICTIM, and PREPARES relationships. The PREPARESrelationship represents the idea that one exploit prepares foranother in a chain of attack. The LAUNCHES and VICTIM thendefine the attacker and victim machines for each exploit.Figure 12. Incorporating NVD content in property graph.Our model also incorporates CAPEC, a communitydeveloped catalog of common cyber attack patterns. CAPECcurrently contains over 450 attack patterns, organized in aclassification hierarchy of general to specific. CAPEC attackpatterns capture knowledge about classes of attacks againstcyber resources. Each attack pattern includes details aboutspecific phases of the attack, the vulnerable attack surface, theresources required by the attacker, and ways to mitigate theattack. This provides a frame of reference for correlating variousrelevant information about attacks.Figure 11. Chain of potential exploits with attackers and victims.This query result introduces two preparatory exploits into thechain: cache poisoning by an outside attacker against the DNSserver in the DMZ, followed by a pharming attack by a maliciousweb site. This leverages a vulnerability in the DNS server thatallows an attacker to cause domain names to be resolved to aserver under the attacker’s control. The resulting pharmingattack lets the malicious web site serve content that exploits theclient-side vulnerability, compromising the client.This query finds the CAPEC attack pattern content relevantto a particular intrusion alert:MATCH path (start:Alert{name:'Client-Side BOF Alert'})-[r: ALERT AGAINST CAPEC PATTERN CHALLENGE PHASE CONTEXT MECHANISM CONSEQUENCE MITIGATION IMPACT*]- (end)RETURN pathFigure 13 is the query result.Our cyber-attack model leverages various standards definedunder the Making Security Measurable framework. Thisincludes CVE for known vulnerabilities, CVSS for vulnerabilityscoring and categorization, CWE for software weaknesses, andCPE for vulnerable software versions. Standardized languagefor security data helps close the gap for automated modelgeneration. For example, many vulnerability scanners are CVEcompliant, and the National Vulnerability Database (NVD) [27]maintained by NIST reports CVSS scores, CWE weaknesses,and CPE software versions for each CVE vulnerability.For example, this query finds NVD content relevant tointrusion alerts:MATCH path (start:Alert)-[r:ALERT AGAINST CVE CVSS SEVERITY METRICS CWE CPE REFERENCES REFERENCE CONTAINS*]- (end)RETURN pathFigure 13. CAPEC attack pattern associated with an intrusion alert.Approved for Public Release; Distribution Unlimited. Case Number 14-3549
V.SUMMARYWe describe an open extensible modeling and analyticalframework for tracing cyber-attack vulnerability paths throughnetworks, correlated with observed security events. Weconsider a variety of relationships, such as network topology,firewalls, host vulnerabilities, potential attack patterns, andintrusion alerts. Our model leverages a property-graphformalism, implemented through Neo4j, a NoSQL graphdatabase. Our modeling framework employs standardized datarepresentations under the Making Security Measurable suite oflanguages.We demonstrate how our approach supports the same kindsof analytics as an existing attack graph tool (Cauldron). Wethen extend the baseline analytics, developing a much richermodel of the network environment and attacker activities.Through the application of the Neo4j Cypher query language,we iteratively explore attack relationships, building a morecomplete picture of security state.Our work represents the first investigation of attack graphanalysis based on NoSQL graph databases. These databasearchitectures are optimized for graph analytics, especiallytraversals. This provides a flexible, scalable, high-performancepersistence layer for our approach.We provide the necessary context for responding to attacks,based on known vulnerability paths.We considervulnerabilities not only in the usual sense of exploitable systemflaws, but also legitimate accesses that can be leveraged oncean attacker has established a foothold inside the network, e.g.,capturing login credentials. In this way, we analyze systeminterdependencies to map how an attacker can incrementallypenetrate a network. This makes our results particularlyrelevant to advanced persistent threats and malicious ][14][15][16][17][18]Our analysis guides the hardening of the network inadvance of attacks. Potential attack paths are then correlatedwith detected attack events. We address the problem of missingalerts (false negatives), and extrapolate observed attackerpresence to trace attack origins and next possible steps. Thiscontext gives the best options for response, especially forprotecting critical assets, and improves situational awareness.Overall, we assemble disparate data sources into a globalpicture of overall security posture.[19]ACKNOWLEDGMENTS[24][25][26]This work was supported by the MITRE Innovation Program(project number EPF-14-00341), with Vipin Swarup asInformation Area Lead.REFERENCES[1][2][3]J. Partner, A. Vukotic, N. Watt, Neo4j in Action, Manning, 2014.R. Ritchey and P. Ammann, “Using model checking to analyze networkvulnerabilities,” IEEE Symposium on Security and Privacy, 2000.O. Sheyner, J. Haines, S. Jha, R. Lippmann, and J. Wing, “Automatedgeneration and analysis of attack graphs,” IEEE Symposium on Securityand Privacy, 2002.[20][21][22][23][27]P. Ammann, D. Wijesekera, and S. Kaushik, “Scalable, graph-basednetwork vulnerability analysis,” ACM Conference on Computer andCommunications Security (CCS), 2002.S. Jajodia, S. Noel, B. O’Berry, “Topological analysis of network attackvulnerability,” Managing Cyber Threats: Issues, Approaches andChallenges, Springer, 2005.P. Ning, Y. Cui, and D. Reeves, “Constructing attack scenarios throughcorrelation of intrusion alerts,” ACM Conference on Computer andCommunications Security (CCS), 2002.S. Noel, E. Robertson, and S. Jajodia, “Correlating intrusion events andbuilding attack scenarios through attack graph distances,” AnnualComputer Security Applications Conference (ACSAC), 2004.S. Mauw, M. Oostdijk, “Foundations of attack trees,” Lecture Notes inComputer Science Volume 3935, 2006.S. Noel, S. Jajodia, L. Wang, A. Singhal, “Measuring security risk ofnetworks using attack graphs,” International Journal of Next-GenerationComputing, 1(1), 2010.K. Ingols, C. Scott, K. Piwowarski, K. Kratkiewicz, M. Artz, R.Cunningham, “Validating and restoring defense in depth using attackgraphs,” Military Communications Conference (MILCOM), 2006.S. Jajodia, S. Noel, “Topological vulnerability analysis,” CyberSituational Awareness, Springer, 2010.J. Hong and D. Kim, “Scalable security models for assessing effectivenessof moving target defenses,” IEEE/IFIP International Conference onDependable Systems and Networks (DSN), 2014.L. Wang, C. Yao, A. Singhal, S. Jajodia, “Implementing interactiveanalysis of attack graphs using relational databases,” IFIP WG 11.3Working Conference on Data and Applications Security, 2008.S. Jajodia, S. Noel, P. Kalapa, M. Albanese, J. Williams, “Cauldron:mission-centric cyber situational awareness with defense in depth,”Military Communications Conference (MILCOM), 2011.R. Martin, “Making security measurable and manageable,” CrossTalk:The Journal of Defense Software Engineering, September/October 2009.The MITRE Corporation, Common Vulnerabilities and Exposures: s,https://cve.mitre.org/.FIRST, Common Vulnerability Scoring System (CVSS-SIG),http://www.first.org/cvss.The MITRE Corporation, Common Weakness Enumeration:ACommunity-Developed Dictionary of Software Weakness Types,http://cwe.mitre.org/.National Institute of Standards and Technology, Official CommonPlatform Enumeration (CPE) Dictionary, http://nvd.nist.gov/cpe.cfm.The MITRE Corporation, Common Attack Pattern Enumeration andClassification:A Community Resource for Identifying andUnderstanding Attacks, https://capec.mitre.org/.D. Carasso, Exploring Splunk, CITO Research, 2012.M. Zaharia, M. Chowdhury, T. Das, A. Dave, J. Ma, M. McCauley, M.Franklin, S. Shenker, and I. Stoica, “Fast and interactive analytics overHadoop data with Spark,” ;login: Magazine, 37(4), 2012.M. Bhandarkar, “MapReduce programming with apache Hadoop,” IEEEInternational Symposium on Parallel & Distributed Processing, 2010.K. Chodorow, MongoDB: The Definitive Guide, O’Reilly Media, 2013.I. Robinson, J. Webber, and E. Eifrem, Graph Databases, O’Reilly, 2013.S. Noel, S. Jajodia, “Managing attack graph complexity through visualhierarchical aggregation,” ACM CCS Workshop on Visualization andData Mining for Computer Security (VizSec), 2004.National Institute of Standards and Technology, National VulnerabilityDatabase:Automating Vulnerability Management, SecurityMeasurement, and Compliance Checking, http://nvd.nist.gov/.Approved for Public Release; Distribution Unlimited. Case Number 14-3549
Big-Data Architecture for Cyber Attack Graphs Representing Security Relationships in NoSQL Graph Databases Steven Noel, Eric Harley, Kam Him Tam, and Greg Gyor Cyber Security Division The MITRE Corporation McLean, Virginia, USA [snoel, eharley, ktam, ggyor]@mitre.org Abstract