Transcription
Geospatial InformationTechnologyin EcoCity PlanningWendy Guan2009 International Ecocity Forum(Huaibei, China)
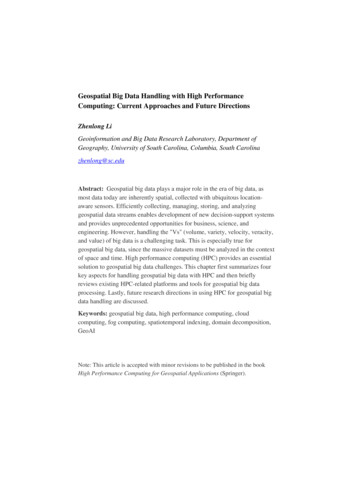
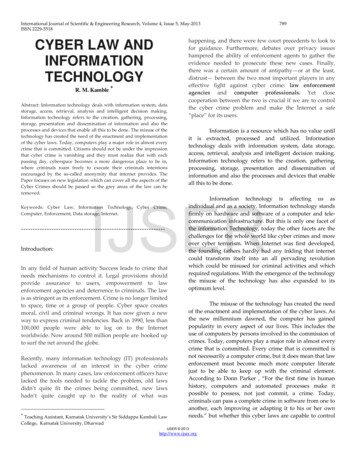
Location MattersLearning to ThinkSpatially: GIS as aSupport System in theK-12 Curriculumby Committee on the Supportfor the Thinking Spatially: TheIncorporation of GeographicInformation Science Acrossthe K-12 Curriculum,Committee on Geography,National Research Council2006, National Academy ofSciences
Geospatial Technology – Its Values It provides a framework for us toorganize our knowledge – geographically. It reveals patterns, relationships andprocesses – broadens our knowledge anddeepens our understanding. It helps us conceptualize, represent andcommunicate ideas – reconstruct history,illustrate the present, or plan for the future.
Geographic Information Systems(GIS) started in the 1960sIan L. McHarg wasthe founder of theDepartment ofLandscape Architectureat the University ofPennsylvania. His 1969book Design withNature pioneered theconcept of ecologicalplanning.Roger Tomlinson developed theCanadian Geographic InformationSystems, the first of its kind. Henamed the field in the early 1960sand has been a leader ever since.
The Harvard Laboratory for ComputerGraphics and Spatial Analysis (19651991) is regarded by many as thebirthplace of GISNicholas Chrisman (Professor, GeomaticSciences, Université Laval) speaking aboutthe Lab at the CGA launch event in 2006
Innovation in the1960s US Bureau of the Censusimplemented the GBF/DIME(Geographic Base File using DualIndependent Map Encoding) systemin 1967, in preparation for theautomation of geocoding of the 1970census. ESRI (Environmental SystemsResearch Institute) and Intergraph,two major GIS companies, were bothformed in 1969.
Evolution through the Decades Computer Mapping in the 1970s– The LandSat program launched its first satellite in 1972– First International Symposium on Computer-AssistedCartography (AUTOCARTO) was held in Reston, Virginia in1974. Spatial Database Management in the 1980s– Raster and vector data models– Topology– Compression Map Analysis and Modeling in the 1990s– Integration with Numerical Models– Graphic User Interface– Global Positioning System completed its 24 satellitesconstellation in 1993
Current Status Enterprise andSocial GIS in the2000s– Server GIS– Mobil GIS– EmbeddedApplications– Web GIS– Volunteered GIS(crowd sourcing)
Future Perspective Multi-media Mapping 4 Dimensions and Beyond Fuzzy Spatial ObjectsThis figure shows the green dots (locationpoints from which the kernel was createdfrom using the LSCV) against theutilization distribution grid.Source: RafDouglas Candidi Tommasi CrudeliThis figure is a display of the location points(shown in yellow) within the selected 50, 75,and 90% probability /animal mvmt.htm
A Skyful of Satellites3,100 orbiting satellitesOver 845 844 active satellitesCredit: Union of Concerned ScientistsCredit: New York Times, 2/6/2007Union of Concerned Scientists, Satellite Databasehttp://www.ucsusa.org/global security/space weapons/whats-in-space.html
SpatialResolutionGeneral Principle:To resolve an object ofinterest (e.g., my 10-inchdiameter head), it isnecessary to obtainimagery with a spatialresolution that is one-halfthe size of the object’sgreatest dimension (e.g., 5inches).http://gis.harvard.edu/icb/icb.do?keyword k235&state popup&topicid icb.topic543139&view view.do&viewParam name 2007 Remote Sensing&viewParam fname
Earth Imaging Storagepixel size(meter)1000804020105210.5# of pixel (million) singleband 8 bit image size ,516,400 37,234,775510,065,600 148,939,1002,040,262,400 595,756,400
Improvements in Remote Sensor Resolution10 m Spatial- the size of the field-of-view, e.g. 10 10 m.10 mB G R NIRJan16Feb16 Spectral - the number and size of spectral regions(or frequencies) the sensor records data in,e.g. blue, green, red, near-infrared, thermal infrared. Temporal - how often the sensor acquires data,e.g., every 30 days. Radiometric - sensitivity of detectors to small differencesin electromagnetic energy.00ruler8-bit(0 - 255)10-bit(0 - 1023)
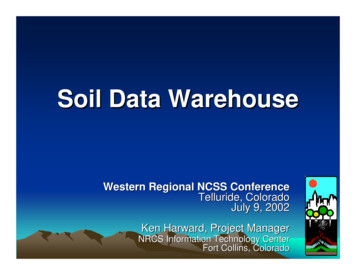
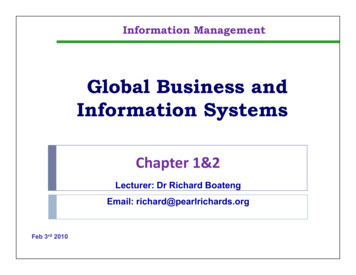
Change detectionwith time seriesimage analysisThree images of part of the state ofRondonia in Brazil, for 1975, 1986,and 1992.Note the increasing fragmentation ofthe natural habitat as a result ofsettlement.Such fragmentation can adverselyaffect the success of raphics/Rondonia.jpg
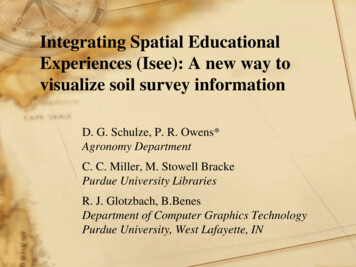
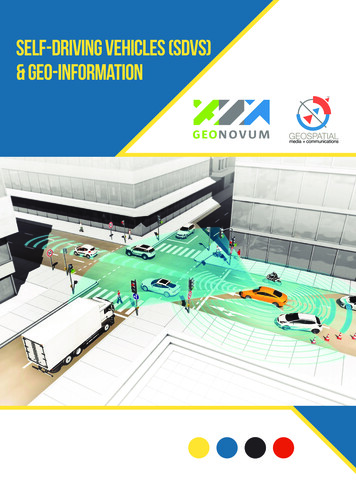
Lake Chad was once the sixthlargest lake in the worldLandSat images taken in 1972, 1987 and 2002, all in December.http://landsat.usgs.gov/images/gallery/97 M.jpg
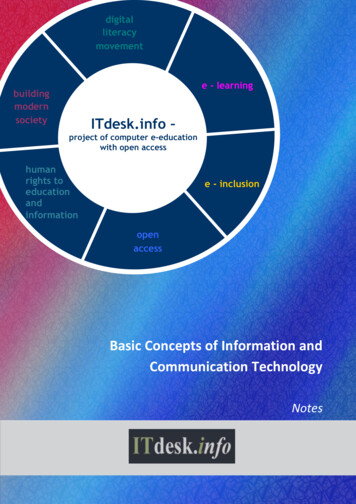
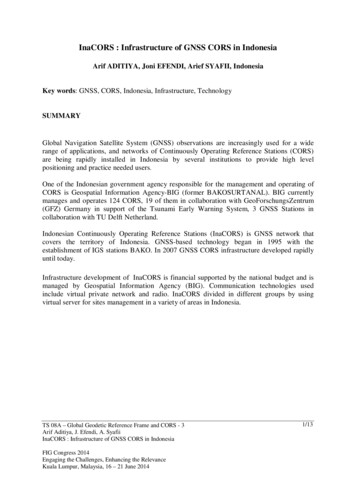
Hypothetical Sea Level Rises in the Gulf of Mexico
The GPS ConstellationNavstar GPS IIANavstar GPS IIR-MNavstar GPS IIFSource:http://images.google.com/imgres?imgurl http://www.defenseindustrydaily.com/images/SPAC GPS NAVSTAR IIA IIR IIF Constellationlg.gif&imgrefurl page/2/&h 800&w 800&sz 246&hl en&start 1&tbnid mWMWht9mHEPlM:&tbnh 143&tbnw 143&prev m%3D10%26hl%3Den
LPS with cellulartowers, RFID,wireless networkedsensors, etc.http://www.amazon.com/gp/reader/0849333490/ref sib dp pt/103-6993360-4148651#reader-link
The possible location of sensors in the firstcitywide wireless network in Cambridge-- to monitor the "health" of the city and investigatehow such networks could be used in the relessnetwork tec zoom0.html?category technology&guid 20070420091530
GeoRSS (Geographically Enabled Really Simple Syndication )
Scales of GIS Personal GIS – one individual– Desktop or workstation Workgroup GIS – a project team– Networked computers Enterprise GIS – an agency or business– Client/Server (multi-tier) Citrix serverApplication serverWeb (usually an intranet)Mobile/Handheld Social GIS – the public– Web (usually the Internet)
Geographic 22 mLocation optimization for business
Geodatabase AdvancementsThrough topology rules,spatial objects in ageodatabase can haveproperty driven ddleeast/2006/sep-oct/28 2.htm
Throughconnectivity rules,geometricnetworks in ageodatabase cansupport modelingof complex ents/Network/ArcGISNetworkModel/ArcGISNetwork.htm
Geospatial Technology– Summary of Status Data explosion– Satellite image resolution changes– GPS accuracy improves– Local Positioning Systems (cell phones, RF IDs,networked sensors, etc.)– Volunteered Geographic Information (crowd sourcing) Analytical advancement– Geometry and topology– Spatial statistics and geo-statistics– Pattern recognition and feature extraction System evolution– From individual/group to enterprise/societal– From isolated system to server/client to web
Geospatial Technology– Shared Challenges Data volumeComputational intensityMulti-dimensional visualizationGeo-referencing non-spatial dataRepresenting phenomena without finitegeographic location Data and System Integration
City OperationRegional PlanningUrban DesignBuilding ManagementLand SurveyArchitectural DesignLandscapingEngineering Construction
OGC Initiatives The Open Geospatial Consortium, Inc. (OGC)– a non-profit, International, voluntaryconsensus standards organization– leading the development of standards forgeospatial and location based services Relevant OGC Initiatives– Building Information Modeling (BIM)– OpenGIS City Geography Markup Language(CityGML)
Building Information Modeling BIM is a cumulative digital representation of physical andfunctional characteristics of a facility in the builtenvironment. BIM is a shared knowledge resource containinginformation about a facility. BIM provides a reliable basis for decisions during thefacility's entire life cycle. Different stakeholders at different phases of the life cycleof a facility insert, extract, update or modify informationin the BIM to support and reflect the roles of thatstakeholder.Source: gies/bim
Memorial HallHarvard University(Before and after2001)
City Geography Markup Language CityGML is the Encoding Standard for therepresentation, storage and exchange ofvirtual 3D city and landscape models. CityGML is implemented as an applicationschema of the Geography MarkupLanguage version 3.1.1 (GML3).Source: http://www.opengeospatial.org/standards/citygml
IFC: Industry Foundation ClassesGSA: U.S. General Service Administration
Geospatial Technology – Its Values It provides a framework for us toorganize our knowledge – geographically. It reveals patterns, relationships andprocesses – broadens our knowledge anddeepens our understanding. It helps us conceptualize, represent andcommunicate ideas – reconstruct history,illustrate the present, or plan for the future.
AcknowledgementPaul Cote, Harvard Graduate School ofDesign, Architect of the OGC OWS-4 CGBTestbed– “Integrating Building Information Models withOpen Geospatial Web Services”, OpenGeospatial Consortium, InteroperabilityTestbed4 for CAD/GIS/BIM, 2007– “A Data Model for Representing Cities inThree Dimensions”, ESRI User Conference,2008
THANK YOU !Questions ?
Learning to Think Spatially: GIS as a Support System in the K-12 Curriculum by Committee on the Support for the Thinking Spatially: The Incorporation of Geographic Information Science Across the K-12 Curriculum, Committee on Geography, Nat