Transcription
Accounting Information SystemsFourteenth EditionChapter 17Database Design Using theREA Data ModelALW AYS LEARNINGCopyright 2017,2017, 2016,2016, 20152015 PearsonPearson Education,Education, Inc.Inc. AllAll RightsRights ReservedReservedCopyright
Learning Objectives Discuss the steps for designing and implementing adatabase system. Explain the nature and use of Entity-Relationship (E-R)diagrams. Explain the content and purpose of the REA data model. Read an REA diagram and explain what it reveals aboutthe business activities and policies of the organizationbeing modeled.Copyright 2017, 2016, 2015 Pearson Education, Inc. All Rights Reserved
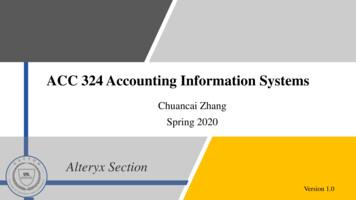
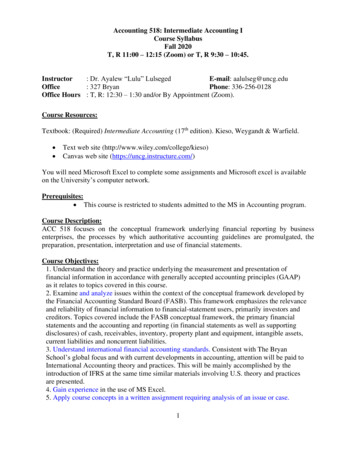
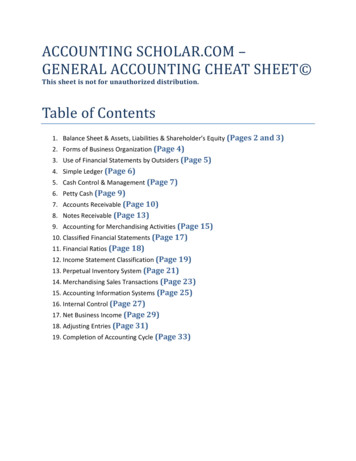
Database Design ProcessCopyright 2017, 2016, 2015 Pearson Education, Inc. All Rights Reserved
Data Modeling Process of defining a database so that it faithfullyrepresents all aspects of the organization, including itsinteractions with the external environment.– Entity-relationship (E-R) diagrams– REA data modelCopyright 2017, 2016, 2015 Pearson Education, Inc. All Rights Reserved
Entity-Relationship Diagrams Entity-Relationship (E-R) diagrams are a graphical way todiagram the relationships between entities An entity is anything that the organization wants to collectand store information For AIS database design, the decision is understandingwhat entities should be included. REA diagrams are E-R diagrams specifically designed forAIS.Copyright 2017, 2016, 2015 Pearson Education, Inc. All Rights Reserved
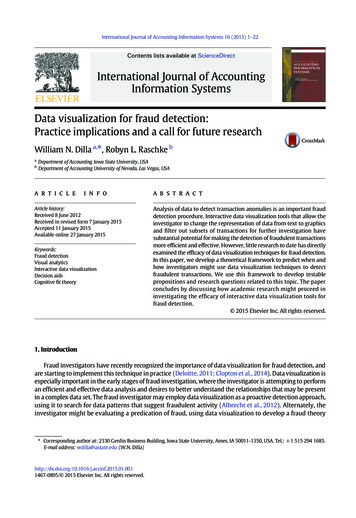
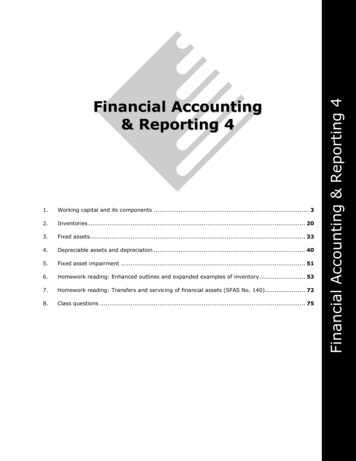
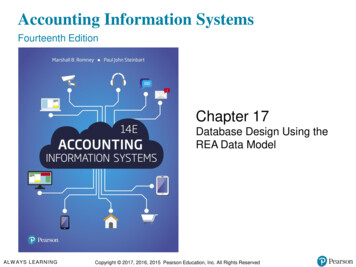
REA Modeling Resources– Things that have economic value to the organization (e.g.,inventory, cash) Events– Various business activities that management wants to collectinformation on Agents– People and organizations that participate in events (both internal(e.g., employees) and external (e.g., customers/vendors) to theorganization)Copyright 2017, 2016, 2015 Pearson Education, Inc. All Rights Reserved
REA Basic TemplateCopyright 2017, 2016, 2015 Pearson Education, Inc. All Rights Reserved
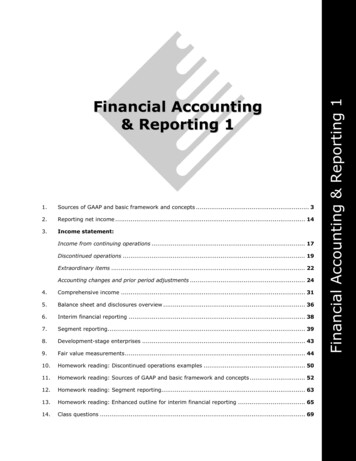
Creating an REA Model Identify relevant events– Give-get exchange (economic duality) Identify resources and agents– Resource reduced in give event– Resource acquired in get event Determine cardinalities of relationships– Nature of the relationship between the two entitiesCopyright 2017, 2016, 2015 Pearson Education, Inc. All Rights Reserved
Cardinality Notation Methods Graphical symbols– Graphical symbols represent minimum–maximum cardinalities (Min, Max) notation– Pairs representing the minimum–maximum cardinalities UML notation– Pairs representing the minimum–maximum cardinalities Maximums only (Microsoft Access)Copyright 2017, 2016, 2015 Pearson Education, Inc. All Rights Reserved
Key Terms Data modeling Minimum cardinality Entity-relationship (E-R) diagram Maximum cardinality REA data model One-to-One (1:1) relationship Resources One-to-Many (1:N) relationship Events Many-Many (M:N) relationship Agents CardinalitiesCopyright 2017, 2016, 2015 Pearson Education, Inc. All Rights Reserved
Creating an REA Model Identify relevant events –Give-get exchange (economic duality) Identify resources and agents –Resource reduced in give event –Resource acquired in get event Determine cardinalities of relationships –Nature of the relationship between the two entities