Transcription
PlateMate: Crowdsourcing Nutrition Analysis from FoodPhotographsJon Noronha, Eric Hysen, Haoqi Zhang, Krzysztof Z. GajosHarvard School of Engineering and Applied Sciences33 Oxford St., Cambridge, MA 02138, RACTWe introduce PlateMate, a system that allows users to takephotos of their meals and receive estimates of food intakeand composition. Accurate awareness of this information canhelp people monitor their progress towards dieting goals, butcurrent methods for food logging via self-reporting, expertobservation, or algorithmic analysis are time-consuming, expensive, or inaccurate. PlateMate crowdsources nutritionalanalysis from photographs using Amazon Mechanical Turk,automatically coordinating untrained workers to estimate ameal’s calories, fat, carbohydrates, and protein. We presentthe Management framework for crowdsourcing complex tasks,which supports PlateMate’s nutrition analysis workflow. Results of our evaluations show that PlateMate is nearly as accurate as a trained dietitian and easier to use for most usersthan traditional self-reporting.H5.2 [Information interfaces and presentation]: User Interfaces. - Graphical user interfaces.ACM Classification:General terms:Design, Human FactorsKeywords: Human computation, Crowdsourcing, Mechanical Turk, Nutrition, Remote Food PhotographyINTRODUCTIONThe majority of Americans perceive healthy eating as complicated [5]. Seeking comprehensible and actionable advice,Americans spend over 40 billion each year on diets and selfhelp books [18], but achieve little success: the majority eventually regain any lost weight and more [13].There are many factors that may impact successful long-termchange in eating habits. Our work is based on the observation that food intake monitoring is a popular component ofmany diets. For people who make a commitment to changingtheir eating habits, accurate logs of what they eat may helpin monitoring progress toward set goals [11]. Currently, foodlogging is typically done by hand using paper diaries, spreadsheets, or a growing number of specialized applications. ThisPermission to make digital or hard copies of all or part of this work forpersonal or classroom use is granted without fee provided that copies arenot made or distributed for profit or commercial advantage and that copiesbear this notice and the full citation on the first page. To copy otherwise, torepublish, to post on servers or to redistribute to lists, requires prior specificpermission and/or a fee.UIST’11, October 16-19, 2011, Santa Barbara, CA, USA.Copyright 2011 ACM 978-1-4503-0716-1/11/10. 10.00.process is both time-consuming and error-prone [17, 6]. Nutritionists have explored alternative methods such as daily interviews with trained experts. While these methods improveaccuracy, they are costly and still require substantial time investment.Our work is inspired by the Remote Food PhotographyMethod (RFPM) [16], a novel approach from the nutritionliterature. Rather than remembering foods or writing downrecords, users take two photographs of each meal: one atthe beginning of the meal and one at the end documentingthe leftovers. These images are analyzed by a third party,making logging easier and discouraging self-deception. Thechallenge is in finding a qualified third party without prohibitive costs. Expert nutritionists are scarce and costly, limiting the system to wealthy users or patients with particularconditions.To make accurate food logging easier and more affordable,we introduce PlateMate, a system for crowdsourcing nutritional analysis (calories, fat, carbohydrates, and protein)from photographs of meals using Amazon Mechanical Turk.Complex tasks like this are hard problems for crowdsourcing, as workers may vary drastically in experience and reliability. To achieve accurate estimates, we propose a workflowin which the overall problem is decomposed into small, manageable, and verifiable steps. PlateMate uses this workflowto assign tasks to contributors, to validate and combine results, and to appropriately route tasks for further processing.This paper makes three main contributions:1. We present PlateMate, an end-to-end system for crowdsourced nutrition analysis from food photographs.2. We discuss the results of a two-part evaluation, which suggests PlateMate can be as accurate as experts and selfreport methods, and more usable than manual logging foreveryday use.3. We introduce the Management framework—inspired bythe structure of human organizations, it provides effectivesupport for managing crowdsourcing of complex heterogeneous tasks.PlateMate implements the first step in the Remote Food Photography Method. In the last section we suggest how it canbe extended to also support the second step: the analysis ofphotographs of food waste.
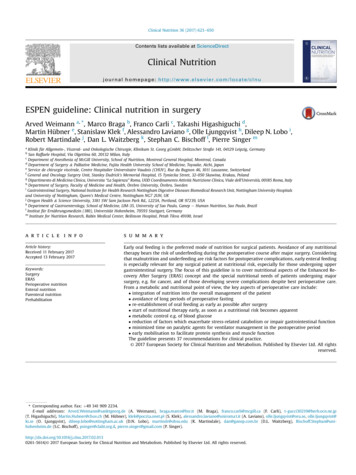
In the next section we review relevant prior work. We thendescribe the design and implementation of the PlateMate system and its components. Next, we discuss our Managementframework. We then present an evaluation of the accuracyand usability of PlateMate and discuss the results. Finally,we consider future extensions to PlateMate.RELATED WORKNutritionists have established several methods for measuringfood intake. One prominent approach is 24-hour recall, inwhich a trained dietitian interviews a subject about her consumption over the previous day [16]. Accuracy depends onthe subject’s memory and honesty, and the technique requiresa costly expert to conduct analysis. The main alternative isfood journals, in which subjects record meals and estimateportions themselves, usually with pen and paper.Both methods require significant time and self-reports alsosuffer from limited accuracy. A review of nine studies founderror rates from 76% (underestimates) to 24% (overestimates) [19]. Prior work also suggests a dangerous bias inself-report methods. Most subjects selectively underreportfat intake, and obese people underestimate portions muchmore than leaner ones [17, 6]. These errors imply a largerproblem of self-deception, especially in vulnerable groups.A number of online interfaces exist to simplify the processof food logging. Smartphone applications and online calorie databases improve on earlier methods by performing calculations automatically. However, they still require tediouslogging that discourages recording. Self-reports using theseinterfaces are no more accurate than pen and paper [2, 21].The Computer Science community has explored additional alternatives, such as automatic analysis of chewing sounds [1] and scanned grocery receipts [12]. Thesemethods, while potentially more scalable and less timeconsuming than current approaches, remain inaccurate.Martin et al. recently suggested an alternative approachcalled the Remote Food Photography Method (RFPM) [16].Rather than typing names of foods and estimating portions,users take photographs of their plates both at the beginningof the meal and at the end to accurately capture how muchfood was actually eaten. Trained dietitians identify the pictured foods remotely and estimate portions. The results oflaboratory studies showed that dietitians using RFPM underestimated calories by 5-7% compared to the ground truth obtained by directly weighing the foods [16].RFPM thus combines the accuracy of direct observation byexperts with the convenience of free-living conditions. Usersof the method found it extremely satisfying and easy touse [16]. The problem is cost. RFPM relies on experts toanalyze each photograph, limiting the system’s accessibilityand potential scale.Kitamura et al. attempted to use computer vision to cheaplyimplement RFPM [7]. They were successful in algorithmically detecting if a photograph contained food and in estimating amounts of general categories of food, such as meats,grains, and fruit. They did not attempt to identify the specificfoods in a photo or provide actual intake totals.The cost of experts and limitations of computer vision suggest an opportunity for crowdsourced nutritional analysis.Prior research indicates that the most difficult part of nutritional analysis is estimating portion size [16], and that trainedamateurs have low bias but high variance [15]. The “wisdomof crowds” is ideally suited to these situations, since the average of amateur estimates often beats a single expert [20].A recent iPhone application demonstrates, however, thatnaive approaches to crowdsourcing for nutritional analysisare not sufficient. In April, 2011, the fitness website DailyBurn released Meal Snap, which allows users to photograph foods and receive calorie estimates by so-called “puremagic.”1 Meal Snap creates a single Mechanical Turk taskfor each image. Workers provide a free text description offood, and the application appears to match this descriptionwith a database of average consumption to estimate a rangeof possible calories. This approach is appealing, but criticshave accused it of failing to provide useful data2 and our evaluation showed that Meal Snap’s results do not correlate withthe meal’s actual caloric content.PhotoCalorie3 is a recent on-line tool that encourages usersto upload photographs of their meals, but it uses them justto illustrate the user’s personal photo journal. The apparentsimilarity to PlateMate is superficial because to obtain calorieestimates, users have to enter short descriptions of the contents of the meals and manually estimate the amounts eaten.PLATEMATEPlateMate allows users to upload food photographs and receive nutrition estimates within a few hours. The estimatesconsist of a list of foods in the photograph, with associatedmeasurements of serving size, calories, fat, carbohydrates,and protein for each food item. The information is displayedto the user via the user interface shown in Figure 1.Estimates are generated from a series of tasks on Amazon Mechanical Turk. Crowdsourcing nutritional analysispresents several challenges in interface and workflow design.First, Turkers are inexperienced, and may thus produce unreliable estimates. Second, most Mechanical Turk tasks aresimple, and Turkers may be unaccustomed to performingcomplex operations like nutritional analysis if presented asa single, complex task. Finally, any individual Turker maybe biased in their estimates or have trouble recognizing certain foods contained in a photograph, making it necessary toselect from or combine the outputs of multiple workers.To best design a workflow for crowdsourcing nutritionalanalysis, we started by observing a dietitian as she determined nutritional data from several photographs. Her process consisted of three distinct steps: identifying foods ineach image, estimating their portions, and then calculatingthe corresponding nutrition data. The final step can be fullycomputerized, but PlateMate implements the first two with1 http://mealsnap.com/,accessed July 5, 20112 your-meal/3 http://photocalorie.com/, accessed on July 5, 2011
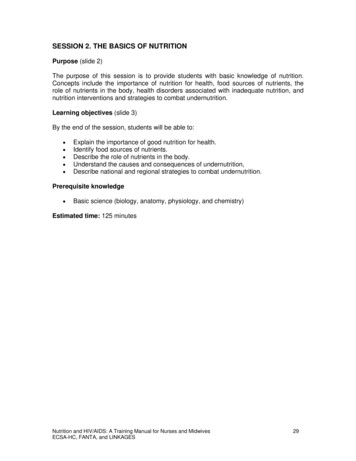
kcalfat (g)carbs (g) protein (g)Figure 1: The PlateMate user interface. Users upload photographs of their meals, which are processed through MechanicalTurk to produce a list of foods, serving sizes, and nutrition information.crowdsourcing. Following Soylent [3], we also add an inputdecomposition stage at the start to parallelize work.The result is a workflow with three major stages, shown inFigure 2. Tag takes photos and labels them with boxes drawnaround distinct foods on a plate. Identify matches each box toone or more foods in a commercial nutrition database. Measure returns portion estimates for each identified food.pared in the number, size, and position of boxes. If the twogroups are sufficiently similar, one is picked at random as thefinal answer.If the box groups differ significantly, three additional Turkersare shown each set overlaid on the photo and asked to selectthe better option, using similar guidelines. The box groupreceiving more votes is returned as the final result.Step 1: TagStep 2: IdentifyThe goal of the Tag stage is to find every food item in a photograph. One picture may depict several plates, and each platemight contain several distinct foods. Tag discovers thesefoods and distinguishes them by drawing a rectangle aroundeach. The result is a group of boxes overlaid on the picture.Each box corresponds to a single food item, like a sandwich.The Identify step matches a tagged box to one or more foodentries in a commercial nutrition database. While each boxoutput from Tag should only contain one food, some composite items do not exist in the database. For example, if “hamand cheese sandwich” is missing, Identify should choose“wheat bread,” “sliced ham,” and “American cheese.”This step has the same benefits as the Find stage in Soylent’sFind-Fix-Verify pattern [3]. Results can be surfaced morenaturally in the user interface, and this makes estimates easier to understand and correct. Parallel work can also be combined more carefully, since we know which identificationsdescribe each pictured food. Finally, the Tag step encourages completeness, preventing “Lazy Turkers” from ignoringor forgetting to match certain foods.There are two main challenges in this stage. Identificationsmust be correct, and when several correct identifications exist, the most compact one should be used in order to simplifymeasurement and eventual presentation of data to end users.Tag’s first Human Interactive Task (HIT)asks workers to draw boxes around each food in the picture.Workers need cultural background knowledge to understandhow foods on a plate fit together. Pure computer vision candetect edges and boundaries, but it cannot recognize that anopen-faced hamburger with half of the bun off to the side isin fact one item. The HIT relies on Turkers’ general intuitionabout food items, and provides examples of sandwiches, salads, and pasta with vegetables as appropriate items.Drawing BoxesTwo Turkers are askedto tag each photo, and a combination of machine and humancomputation is used to select the better box group. Once bothassignments are completed, they are algorithmically comSimilarity Comparison and VotingIn an initial pilot study, Identify was performed in a singleHIT. Workers used an autocomplete text input to list eachfood in the box. Their answers were frequently incorrect orincomplete. Workers appeared to type a one-word description of the picture, like “chicken,” and then select the firstoption regardless of how closely it fit. Like the “Lazy Turkers” in [3], they performed the minimal work necessary toget paid and nothing more.These problems also occurred because the interface askedTurkers to perform two conceptually different tasks sequentially but only produce one final output. Turkers first had toidentify the food in their own minds, and then locate the corresponding entries in the database. To correct for this, wedeveloped a workflow that contained two simpler HITs. Thefirst asks workers to describe the food in their own words.The second asks them to match this description to items inthe database.
kCal:Fat:Protein:Carbs:PlateMateTagStagesHITsDraw Boxes (2)IdentifyVote (3)Describe (3)Match (2)MeasureVote (5)Baked or Fried Chicken DrumstickBarbeque Sauce (Low Sodium, Canned)Results869.641.9g53.1g69.4gCooked Spinach (from Fresh)Italian Flatbread FocacciaMeasure (5)2.53 drumstick.40 cup.83 cup, fresh1.33 sliceFigure 2: The PlateMate system. Work travels between stages and Human Intelligence Tasks (HITs) along the blackarrows, starting from the input on the left and concluding with the output on the right. The system takes submitted photosand creates Tag tasks to annotate these photos with boxes. Each box becomes the input to a series of Identify taskswhich end with a list of foods from a commercial food database. Each individual food is then input to a Measure task,which produces a unit and amount. Dashed boxes represent optional stages, which may be skipped during routing.In this HIT, Turkers see a box on a photo.One question asks “What is this food?”, requesting one-linedescriptions like “pepperoni pizza“ or “salad with chicken.”Another asks “What is it made of?”, providing a free-formtext field where workers can list component parts. For simple foods like broccoli these fields will be identical, but forcomposite foods the fields should have different answers thatare each useful.Describing ItemsFollowing successful prior experiments in describing images [9], we made this step iterative. One worker startsfrom blank boxes. Her answer becomes input to another HIT,where the next Turker is asked to improve on it by correcting mistakes and adding detail. This process is well-suited tothe “Eager Beavers” of [3], who provide minute details andlist many possibilities. It also handles “Lazy Turkers” well,since terse descriptions are progressively expanded.After three iterations, the output of theDescribe task is fed into a Match HIT. Here, workers seethe photo and the final descriptions. They are asked to select the best entry or set of entries in the database to matchthe box, with the descriptions as a suggestion for what tosearch. Workers first attempt to locate the description of thebox as a whole in the database. If they find no good match,they search for each part. For example, workers should firstsearch for “salad with chicken and tomatoes.” If this fails,Matching Foodsthey should look for “chicken breast”, “romaine lettuce”, and“cherry tomatoes.”The search interface is modified from a standard autocomplete. Search results display below the input box, but thekeyboard cannot be used for quick selection. Turkers mustuse the mouse to click the correct items to add. The interface also makes it clearer that multiple items can be selectedthrough several searches. These changes negate the instinctof “Lazy Turkers” from the pilot study to select the first itemthey see.This decomposition makes each step manageable for Turkersmoving rapidly through HITs. The results of the Describestep are not necessary for the end goal of calculating nutritioninformation, but the generated descriptions reduce the mentalwork required for the Match step. We can then ask Turkersworking on Match HITs to find the simplest representationin the database, using the Describe results as a guide.Two workers are asked tocomplete each Match HIT. If each returns a list pointing tothe exact same item or items in the food database, then thatlist is used. Otherwise, five workers complete a Vote HIT todecide between them.Agreement Detection and Voting
Step 3: MeasureThe Measure step produces an estimated portion size for eachfood matched in Identify. Following this stage, the nutritiondata for a photo can be calculated by multiplying the per-unitnutrition breakdown from the food database with the estimated measurement for each identified food.ceptance rate. We chose to require American Turkers due tothe unique cultural context required for most elements of theprocess. Pilot tasks with foreign workers showed commonmistakes like identifying the ketchup on a hamburger bun asstrawberry jam, showing the necessity of cultural context.THE MANAGEMENT FRAMEWORKMeasure uses only one HIT, which shows Turkers a photowith a box highlighted along with the name of one food inthat box. They are asked to first select a measurement unitand then provide a numeric estimate in terms of that unit.The units provided by the food database are specific to eachfood. “Pepperoni pizza” includes options like “slice, large”or “whole pie, medium,” while “white rice, cooked” usescups or ounces.Measurement is considered the most difficult step of this process for amateurs [16], so the Measure stage uses a numberof techniques to produce accurate results. Presenting multiple measurement options is helpful, since many of these onlyrequire counting rather than estimating a weight or volume.For example, it is much easier to count florets than to estimate grams of broccoli.Not every food can be measured by counting. To help incases where weight or volume estimates are necessary, HITsinclude a portion guide which provides common approximations for different measurements. For example, 3oz of meatlooks like a deck of cards, and a quarter cup is roughly thesize of a golf ball. These approximations are more errorprone than simple counting, but they allow workers to estimate portions without any training.The interface also warns Turkers who appear to be makingcommon errors. Pilot testing revealed that measurements inweight were significantly less accurate than those using volume or counting, so a warning is presented when Turkerschoose grams, ounces, or pounds. Testing also indicated thatsome workers misunderstood the serving types. For example, for “chicken nuggets,“ one worker selected “serving, 6nuggets” and then entered 6 as the value. This indicated 6servings of 6 nuggets each for 36 total.To reduce these errors, the interface generates a calorie estimate on the fly and asks workers to eyeball their answer.They are given common calorie ranges for different mealsand shown warnings if the count becomes unusually low orhigh. These warnings cannot prevent all errors, but they encourage Turkers to double-check their answers.Five Turkers are presentedwith Measure HITs. The results from these HITs can becompared in the common units of calories. This means estimates can be aggregated without any additional human computation like voting. Drawing on the principle that averagingmany high variance by low bias estimates can lead to accurate results [20], we remove outliers and then return the meanof the remaining estimates.Aggregating MeasurementsTurker QualificationsAfter several iterations during pilot testing, we decided to accept only Turkers located in the United States who had previously completed at least 200 HITs and had a 98% HIT ac-In this section, we introduce a programming framework forsolving problems with crowds based on a human organizational hierarchy. This approach differs conceptually fromprior work, which has focused on creating “crowd programming languages” that combine human and machine computation. For example, TurKit [9] lets requesters program crowdsin JavaScript, Qurk [14] integrated crowds into SQL, andCrowdForge [8] parallelized work with MapReduce scripts.In each case, these toolkits have attempted to make workingwith crowds more like working with computers. This approach emphasizes computation as the natural glue for combining individual worker contributions and the resulting artifact is a computer program with some of the primitive operations implemented as “functional calls” to human workers [9].Because PlateMate relies primarily on human work, dividedinto a number of heterogenous and interacting tasks, and because the issues of worker skill and motivation were centralto our design process, we found it conceptually helpful touse human organizational hierarchies as the metaphor for designing our system. Specifically, we observe that in the realworld, expert-level work (e.g., building a table) can be reproduced by less skilled workers—each working on a specific part of the process—supervised by managers who arenot necessarily skilled craftsmen themselves, but who knowhow to assign tasks, route work among workers, and verifythe quality of the work.Thus, to implement division of labor for crowdsourcing, wecreated a new framework organized around objects calledmanagers. Managers communicate with their supervisorsand their employees using asynchronous message passing:managers assign tasks by placing them in inboxes of lowerlevel managers and communicate with their superiors byplacing results of completed tasks in their own outboxes.This hierarchical message-passing approach allows programmers to implement workflows by decomposing problems intoprogressively smaller steps.As illustrated earlier in Figure 2, the root of this tree is a chiefmanager, which gathers new inputs and produces completedoutputs. In PlateMate, the chief has three employees: Tag,Identify, and Measure. Each of these are in turn managersand have their own employees, corresponding to the individual HITs described above.This hierarchical structure creates a flexible workflow consisting of modules connected by higher-level managers.Managers can route work intelligently among their employees, and may dynamically alter the sequence of steps in theprocess depending on a situation. For example, PlateMate’sTag manager compares the outputs from its DrawBoxes employee. If they are sufficiently different, they are sent to theVoteBoxes manager to decide between them. Otherwise, one
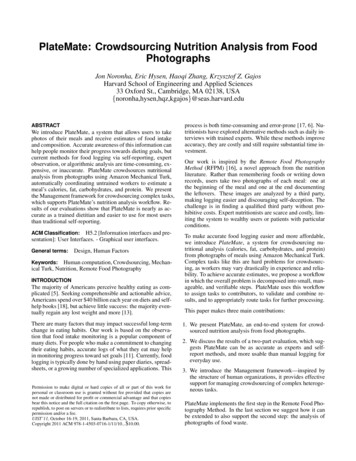
answer is chosen randomly and sent up the hierarchy as Tag’scompleted output. All managers work in parallel, each processing its own stream of work.When multiple tasks are submitted, processing is done justin-time: for example, as soon as one photograph is tagged,the Identify manager begins the process of finding out whatfoods are present in each of the boxes without waiting for theremaining photographs to be tagged.At the lowest level of the hierarchy are managers whose employees are the crowd workers. Managers at this level createjobs (such as asking for the food in one tagged box on a phototo be identified) and receive responses. Programmers createHIT templates and validation functions which are used by theframework to create HITs and approve work. Managers simply assign work to the crowd and receive validated outputsthat can be passed up the tree.Of course, the Management Framework is a computationalframework, and it naturally supports a number of the recentlyintroduced design patterns for programming the crowds. Forexample, the Tag step is an analog of the map step in MapReduce and the Describe step (part of Identify, see Figure 2) relies on iterative refinement [10] to improve the level of detailof the descriptions.Management is implemented as an extension of Django, aweb application framework for Python. It builds on severaluseful features from Django, including an HTML templatelanguage for defining HIT instructions, examples, and interfaces. It also uses Django’s object-relational mapper, whichautomatically stores Python objects in a MySQL database.This means that the precise state of the system is alwaysstored, including managers’ inboxes and outboxes, activeHITs and completed assignments, and intermediate inputsand outputs. This simplifies later analysis, since requesterscan go back and query responses from each stage in the workflow. It also protects completed work from program errorsor service outages; after crashes, execution simply resumesfrom the last good state.EVALUATIONOur evaluation focused on PlateMate’s feasibility as a replacement for traditional food logging. We considered threebroad criteria:1. Accuracy. How accurate were crowdsourced estimatescompared to current alternatives? Could users trust them?2. Usability. How much effort or discomfort would users experience in photographing food, uploading the photos, andcorrecting errors in PlateMate’s estimates?3. Robustness. How well does the PlateMate system farewith “real world” photographs?We designed two experiments to answer these questions. Inthe first, nutrition data returned from PlateMate was compared with ground truth, expert dietitian estimates, and a recent commercial application. In the second study, ten participants used PlateMate and a manual food-logging system forfour days.Figure 3: Examples of photos from the study of PlateMate’s accuracy.Evaluation of AccuracyOur first study had two goals. The first was to determinethe accuracy of PlateMate with ground truth data obtainedfrom manufacturers or preparers. The second was to comparePlateMate’s performance with two alternative approaches toremote food photography: analysis by experts and resultsfrom Meal Snap. Because Meal Snap only returns calorieinformation and to make the task manageable for our expertparticipants, we limited our comparison to estimated calorieseven though PlateMate generates reports that also include fat,protein, and carbohydrates.We conducted the experiment with a sample of 18photographs showing 36 distinct foods. Some depicted individual foods or packages, while others showed complexplates containing many items, as shown in Figure 3. Eachpictured food had nutritional data available through the manufacturer or preparer, and foods were weighed when necessary to ensure accuracy. These foods were selected to spana variety of meals and sources, including restaurants, cafeterias, and grocery items. We also included a mix of simplefoods and composite items like salads and sandwiches.MethodWe recruited three professional dietitians to provide expertestimates: one was a private nutrition counselor, and theother two were employed by a hospital. They received compensation for their time and provided estimates from theirown offices. They were encouraged to use any aids, likebooks and calorie databases, that they would typically usefor a similar task.Our third set of estimates came from Meal Snap, a recentcommercial application. Meal Snap returns a range of calories rather than a definitive answer, so we used the mean ofits high and low values.In terms of mean absolute error on calorie estimates, PlateMate was not significantly different from the human experts or the Meal Snap application. Figure 4 illustrates the results in detail. As expected, trained dietitiansResults
photo of a hamburger with mushrooms, overlapping boxeswere drawn over the burger and topping. In this case, themushrooms were identified in both boxes.)## ##%"## ##%Error (calories)&## ##%'## ##%(## ##%# ##%!(## ##%!"# %&'('!"# %&')'!"# %&'*' ,-./,#'0-,& ,& '!'## ##%!&## ##%!"## ##% ,/'!%%1%' ,/'2341-5& '!%%1%'Figure 4: Mean errors (i.e., overall bias) and meanabsolute errors (average magnitude of an error) forestimates made by the human experts, the Meal Snapapplication, and PlateMate compare
ical Turk, Nutrition, Remote Food Photography INTRODUCTION The majority of Americans perceive healthy eating as com-plicated [5]. Seeking comprehensible and actionable advice, Americans spend over 40 billion each year on diets and self-help books [18], but achieve little success: the m