Transcription
African Journal of Hospitality, Tourism and Leisure, Volume 8 (5) - (2019) ISSN: 2223-814XCopyright: 2019 AJHTL /Author/s- Open Access- Online @ http//: www.ajhtl.comCustomers’ expectations and perceptions of servicequality dimensions: A study of the hotel industry inselected cities of Tigray Region, EthiopiaGuesh Berhe Gebremichael*PhD. Research Scholar, Punjabi University, Patiala, IndiaE-mail: goshub11@gmail.comProf. Dr. Amar Inder SinghPunjabi University, Patiala, IndiaE-mail: dramarindersingh@yahoo.co.inCorresponding author*AbstractThis study investigates the gap between customers’ expectations and perceptions of service quality ofhotels in selected cities of Tigray region, Ethiopia. Data was collected from 282 customers through use ofa self-administered questionnaire. This study employed non-probability sampling techniques mainlyconvenient and purposive approaches in order to select respondents. Service quality was measured usinga modified version of the SERVQUAL scale having 29 items. Using factor analysis four dimensions ofservice quality such as tangibility, reliability and responsiveness, assurance and empathy were identified.The results of the study indicated that the level of customers’ perception was below their expectations forall dimensions of service quality. Moreover, tangibility was found to be an important dimension forcustomers in evaluating the service quality of hotels. The study finally suggested that in an attempt toimprove the quality of service provided to customers, managers should improve or renew all physicalfacilities, equipment and communication materials used by hotels.Keywords: Expectation, perception, service quality, SERVQUAL, Hotel, Ethiopia.IntroductionIn the service industry, customer satisfaction is created through ensuring quality in servicedelivery, and service quality is connected to customer perceptions and customer expectations.Despite much debate on how to incorporate expectations into a service quality measurement,researchers generally agree that expectations serve as reference points in customers'assessment of service quality (Parasuraman et al., 1994, and Oliver, 1980). Brogowicz et al.(1990) argue that there is no generally accepted conceptual definition of what service qualitymeans, nor is there any generally accepted working definition of how to measure service quality.According to the authors, however, there is a consensus that customers evaluate service qualityby their service quality expectations based on the perceptions of the service quality they haveexperienced and this concurs with Ramphal and Nicolaides (2014:1-2) who state that:Whenitcomestothehospitality industry, a customer’s qualityperception is highly influenced from outside the hotel with the informationfeeds such as brochures, billboards and advertisements andrecommendations in general. More simple things, such as availability ofparking or a friendly service at the reception desk also plays a role. Theabsence of a car park or bad experience at the reception desk will notsecure a satisfactory customer’s quality perception. Generally customersconsider if the money they are paying is going to be good value-for-1
African Journal of Hospitality, Tourism and Leisure, Volume 8 (5) - (2019) ISSN: 2223-814XCopyright: 2019 AJHTL /Author/s- Open Access- Online @ http//: www.ajhtl.commoney or not. It is thus imperative that the hotel reception employeesmust be well-trained and they must conduct their business in a highlyprofessional and efficient manner.Service quality measurement has become an area of growing interest to researchers andmanagers (Parasuraman et al., 1994). However, Shahin (2006) argued that despite the attemptsmade to study service quality, there has been no general consensus on the measurement of theconcept. This is because the specific nature of service makes it difficult to provide, measure andmaintain its quality (Markovic & Raspor, 2010). Despite this fact, Parasuraman et al. (1985) laida solid foundation for research work in this area. They were amongst the earliest researchers whorecognized that the concept of quality prevalent in the goods sector is not applicable to the servicesector. Consequently, the authors proposed a SERVQUAL scale which is used for measuringservice quality.According to Parasuraman et al. (1994), measuring service quality as disconfirmation is valid andit further enables service providers to identify gaps in service delivery. On the other hand, thefindings of some researchers did not support the application of SERVQUAL for measuring servicequality (e.g. Cronin & Taylor, 1992). Therefore, despite its limitations, until a better but equallysimple model emerges, SERVQUAL will predominate as a service quality measure (Asunbontenget al., 1996). In line with this idea, Bloemer et al. (1999) recognized that on an operational levelresearch service quality has been dominated by the SERVQUAL instrument.Literature reviewedDefinition of Service QualityAccording to Apte (2004), service quality is defined as the ability of a service firm to satisfycustomer needs and wants. While Parasuraman et al.(1985) described service quality as afunction of the differences between expectations and performance along the quality dimensions,Cronin and Taylor (1994) considered service as an attitude indicating a long term overallevaluation. Nicolaides (2008) mentions that quality service exists where the hotel’s employeesdeliver a service that they are proud of and are willing to put their name to. In addition theservice must be delivered timely and customer needs must be met immediately and beappropriate.Service quality is described as the degree of discrepancy between customers’ normativeexpectations for the service and their perceptions of service performance (Gronroos, 1984;Parasuraman et al.1985; Mudie & Pirrie, 2006). Bolton and Drew (1991) pointed out that servicequality has become an important topic because of its apparent relationship to customersatisfaction. Hernon and Nitecki (2001) argued that service quality is an evaluation of specificattributes, and this judgment is cognitive.Customers’ Expectation and Perceptions of service qualityExpectation is an anticipation of future consequences based on prior experience, currentcircumstances, or other sources of information (Oliver, 2010). According to Mudie and Pirrie(2006), expectations are usually formed prior to the usage of a service but may also occur wherea customer is actively involved in the delivery of service. Some researchers maintain the idea thatexpectations serve as a comparison standard to judge the performance of service delivery (e.g.Oliver & DeSarbo, 1988; Nicolaides & Grobler, 2017; Tse & Wilton, 1988, Oliver & Swan, 1989).2
African Journal of Hospitality, Tourism and Leisure, Volume 8 (5) - (2019) ISSN: 2223-814XCopyright: 2019 AJHTL /Author/s- Open Access- Online @ http//: www.ajhtl.comOne important contribution made by Cadotte et al. (1987) towards understanding the kinds ofstandards used is that expectation is important for consumers to form disconfirmation beliefs andsatisfaction feelings. However, the authors argue that it is not the only standard that consumersuse. Hence, customers have many sources of information (such as words of mouth, publicity,expert opinion, communications, and prior exposure to competitive services) that lead toexpectation about future services encounters with a particular company (Boulding et al., 1993).Bolton and Drew (1991) highlighted that expectations and perceptions of performance levelsinfluence customer satisfaction directly, as well as indirectly via disconfirmation.Almsalam (2014) also confirmed that both customer expectation and perceived service qualityhave significant impact on customer satisfaction. Brogowicz et al. (1990) supported the idea thatcustomer satisfaction is thought to occur when perceived service quality meets or exceeds servicequality expectations.The Gap ModelThe gap model of service quality, which was developed by Parasuraman et al. (1985), has beenused as a framework for research in service marketing, including hospitality marketing for morethan three decades. The model suggests four specific gaps leading to a fifth gap betweencustomers’ expectations and perceptions. The widely appeared gaps in service delivery includeknowledge gap, design gap, communications gap, performance gap, and customer gap.According to Parasuraman et al. (1985), SERVQUAL is based on the perception gap between thereceived service quality and the expected service quality, and has been widely adopted forexplaining consumer perception of service quality. In line with this idea, Bloemer et al. (1999)recognized that on an operational level research service quality has been dominated by theSERVQUAL instrument. The series of studies conducted by Parasuraman et al. (1985) gave birthto SERVQUAL, a five dimensional, two part instrument.The first part of the SERVQUAL measures customers’ expectations whereas the second partmeasures customers’ perceptions. However, despite the presence of several publications onservice quality, the number and content of dimensions are quite diverse (Tan et al., 2014).Nicolaides (2012) in his study found that three of the biggest gaps related to “waitronresponsiveness”, “inadequate assurance” and “clean ablution facilities”, in hotels meaning thatcustomers’ generally expected much more responsive waitrons, greater assurance that qualityof service and food would be good, and cleaner rest rooms than was actually experienced.The findings indicated that most of the customers’ expectations concerning restaurant qualityservice provision are best explained by the following factors, namely, appearance andambience of facilities, a feeling of assurance, personalized service, satisfaction, responsivenessand reliability of waitrons. The concluding factor determined the tip size wiatrons obtainedto a large extent. The results strongly suggested that restaurant managers must train staffeffectively and make certain that they provide timely service on an ongoing basis.3
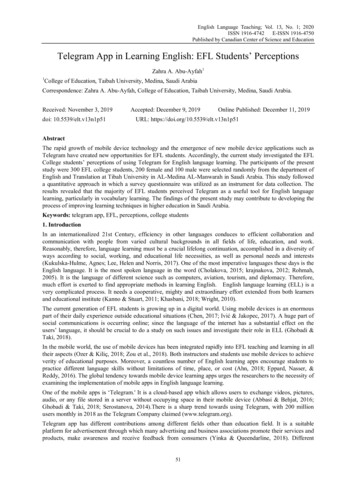
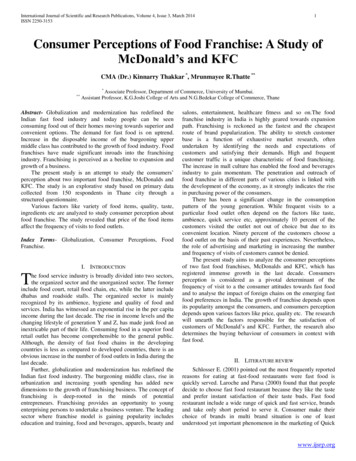
African Journal of Hospitality, Tourism and Leisure, Volume 8 (5) - (2019) ISSN: 2223-814XCopyright: 2019 AJHTL /Author/s- Open Access- Online @ http//: www.ajhtl.comFigure 1. Model of Service Quality GapSource: Parasuraman A. Zeithaml A. and Berry L. (1985)Personal needsWord of mouthcommunicationsPast experienceExpected serviceGap 5Perceived serviceCustomerGap 1ProviderGap 4Service delivery (includingExternalpre and post-contracts)communication ofcustomersGap 3Translation of perceptionsin to service qualityspecificationsGap 2Management perceptionof customer expectationsMain objective of the studyThe main purpose of the study was to examine the gap between customers’ expectations andperceptions of hotel service quality in selected cities of Tigray region, Ethiopia.Specific objectives1. To identify the gap between customers’ expectations and perceptions of hotel servicequality.2. To determine whether there is significant difference between customers’ expected meanand perceived mean of hotel service quality.3. To identify the most important service quality dimension for customers in evaluatingservice quality.4
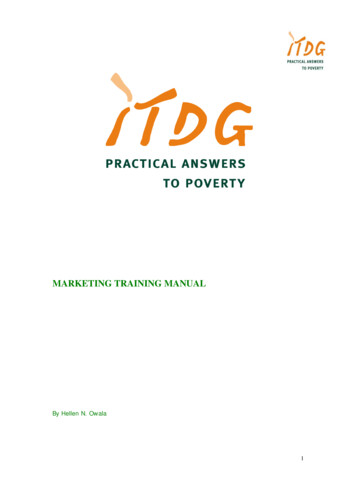
African Journal of Hospitality, Tourism and Leisure, Volume 8 (5) - (2019) ISSN: 2223-814XCopyright: 2019 AJHTL /Author/s- Open Access- Online @ http//: www.ajhtl.comItemNoService quality items and dimensionsFactorloadingsEigen CronbachvalueAlphaEmpathyP28Employees of this hotel understand customers’ specific needsThis hotel has operating hours which are convenient to customers’ requirements (e.g.,P29 pool, gym, and food and beverage outlets)0.76311.290.890.757Employees of this hotel give customers individual attentionP30P27P24P23P250.725Employees of this hotel have the interests of their customers at heartThe behavior of employees in the hotel instills confidence in customersEmployees of this hotel anticipate their customers’ needsThe employees of the hotel are always courteous to guests0.6130.5400.5190.468Employees of this hotel show genuine care and concern when giving customers personalP26 attention0.463This hotel has knowledgeable staff to answer questions about local attractions, shoppingP22 and major events0.435TangibilityP2P8P6P7P4P3P1P5This hotel is a comfortable place to stayThis hotel has public areas which are visually appealing, inviting and comfortableThis hotel has facilities such as a pool, spa and gymnasiumThis hotel has a good choice of food and beverage outlets (e.g., a café/bistro, a diningroom, room service)The bedrooms and bathrooms of this hotel are bright, airy and spaciousThe accommodation rooms in this hotel are quiet and provide the utmost privacy forguestsThis hotel has immaculately clean bedrooms, bathrooms, and living areasThe employees of this hotel are always neat in 5290.497Reliability &ResponsivenessP15P16P9P14When the hotel staff promise to do something by a certain time, they do soWhen hotel customers have a problem, this hotel shows a sincere interest in solving itEmployees of this hotel promptly solve any problems I might haveThis hotel delivers services promptly, once promisedFront desk employees of this hotel ensure that the check-in and check-out service isP12 conducted quickly and without delay-0.781.55 0.88-0.762-0.707-.690-0.6835
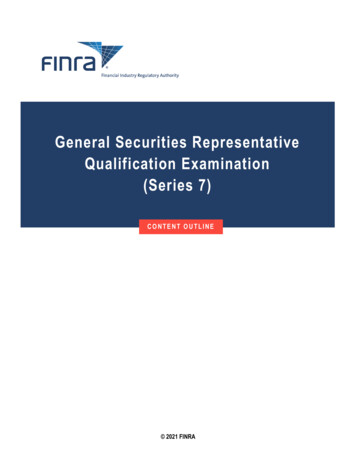
African Journal of Hospitality, Tourism and Leisure, Volume 8 (5) - (2019) ISSN: 2223-814XCopyright: 2019 AJHTL /Author/s- Open Access- Online @ http//: www.ajhtl.comP11Employees of this hotel give prompt service to customers-0.610Employees of this hotel are always willing to help customers with their queries orP10 requests-0.602This hotel performs the service right the first timeP17P18-0.569The hotel presents bills that are error free-0.440AssuranceP210.629This hotel ensures the security and safety of their customersThis hotel provides acceptable solutions to customers’ problemsP20P190.531The employees of this hotel have in-depth knowledge of the hotel and its servicesSource:1.03 0.740.400Author’s computation using SPSS 20, 2017Service Quality Gap AnalysisThe gap model of service quality, which was developed by Parasuraman et al. (1985), has beenused as a framework for research in service marketing, including hospitality marketing for morethan three decades. The model suggests four specific gaps leading to a fifth gap betweencustomers’ expectations and perceptions. The widely appearing gaps in service delivery includea knowledge gap, design gap, communications gap, performance gap, and customer gap. Thegap model would enable management to identify reasons for poor performance in its organizationand to take appropriate measures for the improvement of the same (Blesic et al., 2011).Customer Gap (Customers’ Expectations and Perceptions gap)The first issue to be addressed in service gap analysis is that the gap between customers’expectations and perceptions. This gap occurs when there is discrepancy between customers’expectations and perceptions. Therefore, to ensure good quality the service provider must at leastmeet or else exceed customers’ expectations.A detail analysis of the gap between customers’ expectations and their perceptions of servicequality delivery provides managers with valuable insights about how well actual serviceperformance is when compared with the expectations of the consumers. In other words, analysisof this particular gap is important for managers to monitor service delivery by comparingcustomers’ expectations and perceptions and this in turn enables them to know whether theirhotel is exceeding, meeting or falling below customers’ expectations in service provision. Table 3below presents the means and the difference scores computed for each item of service qualitydimensions. The gap score for each item was computed by deducting mean expectation frommean perception.Table 3. Mean and Gap ScoresVariables/DimensionsCustomers’ perception (P)MeanCustomers’Mean(E)t1 P1t2 P2t3 5-0.25-0.136
African Journal of Hospitality, Tourism and Leisure, Volume 8 (5) - (2019) ISSN: 2223-814XCopyright: 2019 AJHTL /Author/s- Open Access- Online @ http//: www.ajhtl.comt4 P44.154.36t5 P54.174.43t6 P63.914.42t7 P74.174.42t8 P83.934.45rl1 P94.104.41rl2 P104.064.42rl3 P114.214.46rl4 P124.074.29r1 P134.004.28r2 P144.164.42r3 P154.094.33r4 P164.104.43r5 P174.194.48em1 P183.984.14em2 P194.104.37em3 P203.954.26em4 P214.074.30em5 P224.164.33em6 P234.204.34as4 P243.974.00as5 P254.214.11as6 P264.244.32as1 P274.024.15as2 P284.104.25as3 P294.134.19Source: Author’s computation using SPSS 20, 0.14-0.03 0.1-0.08-0.13-0.15-0.06The negative gap score in table 3 indicates the existence of deficiency in service quality ascustomers’ expectations were not adequately met by the service provided. The wider negativegap shows a serious deficiency and more dissatisfaction of customers with quality of servicerendered. Hence, this issue demands managers’ closer attention so as to make improvement inthe service performance outputs. On the other hand, the positive gap score shows better thanexpected service and customers are delighted with the quality of service provided. When a zeroscore occurs it indicates that service quality is as expected and according to expectancydisconfirmation theory customers have a neutral feeling.The above table 3 demonstrates the gap scores on 29 items which was supposed to measureservice quality of hotels. Here, the gap scores of all items except for one are negative whichindicates that the hotels were not doing enough in meeting customers’ expectations. However,the gap score of the eighth item of empathy dimension is positive. This indicates that theemployees of the hotels are always courteous to guests. A paired t-test was used to evaluate thesignificance of the gap scores.As can be seen from table 5, it was found that the mean difference between customers’expectation and perception of service quality is significant for 25 items which indicates that themanagement failed to provide the services according to customers’ expectations. However, themean difference between customers’ expectations and perceptions of one assurance item andthree items of empathy are insignificant which shows management’s failure to meet customers’expectation but the situation is not worse.7
African Journal of Hospitality, Tourism and Leisure, Volume 8 (5) - (2019) ISSN: 2223-814XCopyright: 2019 AJHTL /Author/s- Open Access- Online @ http//: www.ajhtl.comThe maximum negative gap score is for the eighth item of tangibility (t8) i.e. visually appealingand comfortable area (-0.52). This implies that the hotels have no visually appealing, inviting andcomfortable public areas. On the other hand, the minimum negative gap score is for the seventhitem of empathy dimension .i.e. the staff have knowledge to answer questions about localattractions, shopping and major events but still it is not satisfactory. This implies that the gap inthis case is insignificant and this area needs little improvement as compared to the other issues.The highest positive gap score is seen on the eighth item of empathy with (P-E) 0.1.This showsthat the performance of service providers(hotels) on this item is adequate. Hence, customerswere delighted with the courtesy of the employees of the hotels.Table 4. Gap Analysis of Customers’ Expectations and Perceptions (satisfaction levels)NoDeterminants of servicePerceivedExpectedSERVEQUAL GapqualityMean score(P)Mean score(E)(P-E) action)OverallSource: Author’s computation using SPSS 20, 2017The above table 4 portrays gap analysis between customers’ expectation and customers’perception of the four service quality dimensions. The empirical findings of this study revealedthat the level of customers’ perception for all dimensions was less than customers’ level ofexpectation. Hence, the gap analysis results in an overall negative gap score. This result is similarwith the findings of Sidin et al. (2001). However, it contradicts with the findings of Ravichandranet al. (2010). With perception of service held constant, the higher the expectations, the lower theperceived quality (Boulding et al.,1993). This negative discrepancy indicates that customers weredissatisfied with the services provided by hotels. This is similar to the finding of Amissah (2013)who found that tourists’ perception was lower than their expectations indicating dissatisfactionwith services delivered by hotels in Ghana.According to Oliver (1980) satisfaction level is a result of the difference between expected andperceived performance. Here, performances were below customers’ expectations which resultedin negative disconfirmation (dissatisfaction). In other words, customers were not happy with alldimensions of service quality. This may be due to high expectation of customers. Analogousargument is provided by Cooper (as cited in Presbury, 2009) who recognized that today’scustomers are demanding a much high level of service based on their international experience.Another possible reason is that hotel managers’ failure to be fully aware their customers’expectation is a problem.Therefore, hotels were not meeting customers’ expectation. The result of this study revealed thatthe expected mean score of all SERVQUAL dimensions was higher than the correspondingperceived mean score which results in a negative total SERVQUAL gap scores. This finding isconsistent with the results of previous studies (e.g. Al-Momani, 2015; Kumar et al., 2011; andGrzinic, 2007). However, this contradicts with the findings of Rao and Sahu (2013) who found thatoverall mean perception was higher than expectations in all dimensions in a hotel industry.8
African Journal of Hospitality, Tourism and Leisure, Volume 8 (5) - (2019) ISSN: 2223-814XCopyright: 2019 AJHTL /Author/s- Open Access- Online @ http//: www.ajhtl.comThe overall negative score value of (-0.209) SERVQUAL dimensions indicates that customerswere dissatisfied with the overall service of hotels. Therefore, hoteliers should at least meet or ifpossible exceed customers’ expectations in order to ensure customer satisfaction.Identifying the most important service quality dimension for customers in evaluatingservice qualityOf all gap scores tangibility has the largest gap with mean score of (-0.294) and this in turnindicates that customers were not happy with the appearance of the physical facilities, equipment,personnel and communication materials displayed by hotels. The importance of tangibility issupported by Gronroos (1984) who suggested that the appearance and behavior of a restaurantwaiter is critical to the perception of service. Hence, managers should primarily focus on thisdimension in order to improve service quality. Grzinic (2007) and Blesic et al. (2011) also foundthat the biggest negative SERVQUAL gap was observed for tangibility. Here, tangibility is themost important dimension with the highest negative gap (-0.294).Hence, customers place greater importance on the appearance of physical facilities, equipment,personnel and communication materials. This result is consistent with the findings of Kleynhansand Zhou (2011) and Ramchurrun (2008) who indicated that customers attach a high expectationto the tangible elements of hotel. Moreover, Matilla (as cited in Kwee & Kandasamy, 2011)showed that the hotel’s physical environment plays a critical role in the guest’s value perception.Rao and Sahu (2013) also found that tangibility is the most important factor in determiningsatisfaction.The second largest gap score was observed in reliability and responsiveness dimension;suggesting that the hotels were not performing the promised service dependably and accurately.Moreover, it implies that the willingness of employees to help and provide prompt service tocustomers was not good enough. In other words, the hotels were not responding well tocustomers’ demands. In contrast, the smallest gap was for assurance dimension (-0.113). Thisshows that although performance of hotels in this dimension is below customers’ expectation butit is not much worse than other dimensions of service quality. However, this is still one of theareas of concern where performance improvement is needed.Determination of significance for differences between customers’ expectations andperceptionsA paired t-test was conducted for each of the service quality dimensions. The paired t-test wasapplied to check whether a significant mean difference exists between two sets of scores. Thelevel of significance is determined by looking at the probability level specified under the heading‘two-tailed significance’.Hypothesis: H1: There is significant mean difference between customers’ expectation andcustomers’ perception of service quality in the hotel industry9
African Journal of Hospitality, Tourism and Leisure, Volume 8 (5) - (2019) ISSN: 2223-814XCopyright: 2019 AJHTL /Author/s- Open Access- Online @ http//: www.ajhtl.comTable 5. Mean difference between customers’ perception and expectation using paired sample t- testDimensions(ExpectationPerception)andPaired differencesMeanStd. DeviationStd.ErrorSig.(2-tailedtdfMeanPair 1Q1E – Q1P.25177.97500.058064.336281.000*Pair 2Q2E - Q2P.24823.92152.054884.523281.000*Pair 3Q3E – Q3P.124111.03094.061392.022281.044*Pair 4Q4E – Q4P.195041.01286.060313.234281.001*Pair 5Q5E – Q5P.26950.99020.058974.571281.000*Pair 6Q6E- Q6P.514181.10070.065557.845281.000*Pair 7Q7E – Q7P.241131.02912.061283.935281.000*Pair 8Q8E – Q8P.503551.06128.063207.968281.000*Pair 9Q9E – Q9P.30851.92062.054825.627281.000*Pair 10Q10E – Q10P.35106.99866.059475.903281.000*Pair 11Q11E – Q11P.25177.93779.055844.508281.000*Pair 12Q12E – Q12P.216311.02947.061303.529281.000*Pair 13Q13E- Q13P.276601.12308.066884.136281.000*Pair 14Q14E – Q14P.25532.89605.053364.785281.000*Pair 15Q15E – Q15P.237591.01428.060403.934281.000*Pair 16Q16E- Q16P.329791.00236.059695.525281.000*Pair 17Q17E – Q17P.29078.95104.056635.134281.000*Pair 18Q18E – Q18P.156031.00379.059772.610281.010*Pair 19Q19E – Q19P.27305.89676.053405.113281.000*Pair 20Q20E – Q21P.312061.02381.060975.118281.000*Pair 21Q21E – Q21P.230501.02984.061333.759281.000*Pair 22Q22E – Q22P.17021.98355.058572.906281.004*Pair 23Q23E – Q23P.13830.96856.057682.398281.017*Pair 24Q24E – Q24P.021281.25966.07501.284281.777Pair 25Q25E – Q25P.095741.02011.06075-1.576281.116Pair 26Q26E – Q26P.07447.92309.054971.355281.177Pair 27Q27E- Q27P.131211.10667.065901.991281.047*Pair 28Q28E –Q28P.14894.92368.055002.708281.007*Pair 29Q29 – Q29P.056741.04880.06245.908281.364*(Significant), t-test 2-tailed, p 0.05, Source: Author’s computation using SPSS 20, 2017,In the above table 5 the (“Sig.” column) values less than 0.05 indicate that there is a significantdifference between the perceived and expected values and the results are not due to chance. Onthe other hand, the (“Sig.” column) values greater than 0.05 indicate that there is no significantdifference in the mean values between perceptions and expectations. Accordingly, table 5 showsthat the significant values are below 0.05 for most of the items, with the exception one item of10
African Journal of Hospitality, Tourism and Leisure, Volume 8 (5) - (2019) ISSN: 2223-814XCopyright: 2019 AJHTL /Author/s- Open Access- Online @ http//: www.ajhtl.comassurance and three items of empathy dimension. Hence, the p-values for the 25 items indicatethat there is significant difference between the customers’ service expectation and perception.Hence, the result showed that the hypothesis (H1) cannot be rejected. For each item in the servicequality dimension, the perceived service quality was found to be significantly below the expectedservice quality. The significant difference between expectation and perception in these items(factors) implies that hoteliers need to pay more attention to these factors in order to improve thequality of service delivered to customers. The presence of unmet expectations indicates that thereis a deficiency in the quality of services delivered to customers. Conversely, the insignificantvalues show that there is no significant difference between customers’ expectations andperceptions in the last three items of empathy and one item of assurance. Hence, hotels’performances on this dimension are not much worse when compared to other service qualitydeterminants.ConclusionExploratory factor analysis was used to test the dimensionality of service quality in the Ethiopianhotel industry particularly Tigray region. The appropriateness of data to factor analysis waschecked using KMO value and Bartlett’s test of sphericity. The result of exploratory factor analysisindicated that only four dimensions or factors such as assurance, reliability and responsiveness,tangibility, and empathy were found important determinants of service quality of hotels.The SERVQUAL gap model was used to measure the gap between customers’ expectations andperceptions of service quality. The result of the study showed that the level of customers’perception for all service quality dimensions was below their level of expectation. Consequently,a negative discrepancy occurred between customers’ expectations and perceptions of servicequality. In this case, the negative discrepancy indicates that the actual service delivered tocustomers did not match with their expectations suggesting dissatisfaction with the serviceprovided by hotels. Analogous results were identified by other studies (e.g. Sidin et al., 2001;Angelova & Zekiri, 2011, Amissah, 2013). However, the result of this study contradicts with thefindings of Rao and Sahu (2013) who found overall mean score
According to Apte (2004), service quality is defined as the ability of a service firm to satisfy customer needs and wants. While Parasuraman et al.(1985) described service quality as a function of the differences between expectations and performance along the quality dimensions, Cronin and Taylor (199