Transcription
Paper 2670-2018Take a Dive into HTML5Brandon George and Nathan Bernicchi, Grand Valley State University and Spectrum HealthOffice of Research Administration; Paul Egeler, Spectrum Health Office of ResearchAdministrationABSTRACTThe SAS Output Delivery System (ODS) provides several options to save and display SAS graphs andtables. You are likely familiar with some of these ODS statements already, such as ODS RTF for rich textformat, ODS PDF for portable document format, and ODS HTML for hypertext markup language.New to SAS 9.4, users have several additional ODS statements to choose from; among them is ODSHTML5. The ODS HTML5 statement differs from ODS HTML in that it uses HTML version 5.0 instead ofHTML version 4.01. As such, the user can now take advantage of several new features introduced to thelanguage. ODS HTML5 also uses a different default graphics output device, trading out the old standbyportable network graphics (PNG) for the up-and-coming scalable vector graphics format (SVG).Throughout the paper, we will look at some of the differences between ODS HTML and ODS HTML5, witha focus on computer graphics. The paper also begins with a short primer on technologies such as HTML,CSS, and computer graphics. We will also demonstrate a few ways that you can enhance your reportsusing some ODS tricks. Our goal is to convince you to switch to ODS HTML5 and start using SVG asyour graphical output of choice.INTRODUCTIONIn SAS , you have numerous options for how to output your graphs and tables. You can create a rich textformat (RTF) document, a PDF document, or even an HTML static webpage, just to name a few! Eachoutput destination has its advantages and disadvantages. For example, HTML documents are excellentfor sharing reports (not just on the web) because you know that your audience is most likely going to havea browser to view its contents. HTML documents also give you a lot of control over how your content isdisplayed, navigated, and integrated with other documents. And now, SAS has just made designingbeautiful and functional HTML reports better with their new output delivery system, ODS HTML5.HTML was first introduced back in the early 1990’s and has gone through several versions, the mostrecent being HTML5, which was released in 2014 (W3, 2014). HTML5 adds a lot of functionality to theHTML specification—such as embedded audio and video! It also represents a philosophical shift in howHTML documents are created (W3, 2014). This cleans up a lot of problems that web developers used toface with older HTML specifications. SAS followed suit and added the ODS HTML5 destination to SAS9.4 to take advantage of the recent HTML specification update. ODS HTML, which follows the HTML 4.01specification, is still available but is a separate ODS destination.You are probably familiar with ODS HTML since it has been the default delivery destination in the SASWindowing environment since SAS 9.3. You might also be familiar with ODS HTML5 if you use SASStudio. You might think that they are basically the same since both output HTML documents in the sameHTMLBlue style by default. Indeed, plain vanilla ODS HTML output has much the same look and feel asplain vanilla ODS HTML5 output. But underneath, the two documents are constructed differently. Thisallows you to take advantage of some great new features that were not previously available to you.One of the biggest changes that came with ODS HTML5 was the way that graphics are output. Thedefault graphics device for ODS HTML is portable network graphics (.png). In ODS HTML5, the defaultgraphics device is scalable vector graphics (.svg). This single change can have a huge effect on theimage quality of your plot outputs and how they are used. We will explain some important concepts thatwill help you get the most out of this new image format.We will begin the paper by explaining the basic background of HTML and its related technologies andgive you a brief primer on computer graphics file formats. We will go into some of the differences between1
HTML 5 and its older implementation. We will then show you how you can make the most of your ODSHTML5 documents.It’s time to dive in!A LITTLE TECHNICAL BACKGROUNDThis paper contains some tech jargon that might be new to you. We’re going to be talking about webtechnologies, including HTML and CSS, as well as graphics file formats. You are likely familiar with thesetechnologies as an end-user, but you might not have gotten into the nitty-gritty of graphics outputs orlooked under the hood of your favorite website before. Therefore, let’s take just a little time to cover thebasics of some of the technologies we’re going to talk about.WHAT IS HTML?Hypertext markup language (HTML) is the language of web pages. It is a language that consists of tagsthat give structure to a document. The document can be thought of as a tree, where each node (denotedby a tag) can branch into zero, one, or many descendent nodes. Following the tree analogy, we usefamilial terms to denote the relationships of nodes to each other. A direct descendent of a node is its childnode; likewise, its immediate ancestor is its parent node. Nodes at the same level are siblings. The topmost node (highest ancestor) is called the root node.These nodes provide the semantic context for all your content, such as the document title, sections andheadings, paragraphs, images, tables, and hyperlinks. These nodes also contain information that thebrowser does not directly render, such as metadata, scripts, and styling instructions.Tags are enclosed in angle brackets ( and ) and usually come in pairs, called “opening” and “closing”tags. Although XML (e.g., XHTML) requires that all tags be closed, HTML5 has looser rules with regard tosome tags, so not all tags are required to be closed. Tags must be nested so that a hierarchal structure ismaintained throughout the document. Let’s take a look at this basic website to explore those concepts:Code:001002003004005006007008009010011 !DOCTYPE html html head meta charset "UTF-8"/ title An example webpage /title /head body h1 Hello world! /h1 p This is a webpage! /body /html Result:2
The table below goes over the example above line-by-line so we can understand what it all means.LineExplanation001The first line declares the document type as HTML (it is implied that we are specifying HTMLversion 5)This tag begins the HTML document. It is the root node. All nodes within the document will bedescendants of this node.This begins the header section of the HTML document. It is the first direct descendant (child) ofthe html node.The metadata tag contains an attribute that defines the character set used in this document. Thisan example of a self-closing tag: it does not need a closing /meta tag because the /character is present at the end of the opening tag.This is the title that will show up in the title bar of your browser. Note that the opening andclosing tags are on the same line in this example.This is a closing tag for our head tag on line 003.This line begins the body of the document. This is the second child of the html tag and asibling of the head tag. Content within the body may be (but is not always) rendered by thebrowser.This is a heading level one. Think of it as the main title. Headings are usually rendered withlarger font size.The p tag indicates a paragraph node. Closing this node (with a /p tag) is optional.This closes the body node that was opened on line 007.The /html closing tag indicates the end of the HTML document.002003004005006007008009010011WHAT IS CSS?Whereas HTML provides the content and semantic structure of a document, cascading style sheets(CSS) are used to determine the styling, formatting, and layout used when your browser renders the webpage.Basically, CSS allows you to identify different elements within your document and assign differentproperties to them. You can define styles for specific elements or element types. You can even assignstyles based on node attributes and classes. For example, you might want all text enclosed withinemphasis ( em ) tags to be bold and red. You could define that like this:em {font-weight: bold;color: red;}Similarly, you might want text in a specific node to be twice as big as the rest of the text on the page. Youcan use the CSS selector # to identify the node with the id property that matches like so:#my-node {font-size: 2em;}Then the text within the node that has the ID my-node will have double-sized font.When embedding CSS in an HTML document, it is customary to do so in the header of the documentwithin a style tag (although you can also assign styles to specific elements as attributes). Addingthese concepts to our example webpage above, we will just add a little bit of code:3
016017018019020021022 !DOCTYPE html html head meta charset "UTF-8"/ title An example webpage /title style em {font-weight: bold;color: red;}#my-node {font-size: 2em;} /style /head body h1 Hello world! /h1 p This is a webpage br with em style /em ! p id "my-node" This is 'my-node' /body /html Result:As you can see, we’ve added a little bit of flair to our basic HTML document. Line 006 nested in theheader node begins our style node. Within the style node, we can use CSS syntax to define howelements of the webpage are rendered. At line 014, we close the style node and are back to HTMLsyntax. We also show the use of a br tag at line 019 that inserts a line break within a paragraph. Likethe p tag, this br tag does not need a closing tag. On that same line, we also introduce em opening and closing tags around the word style, which renders the font as italicized by default and is alsobold and red thanks to our CSS above. Finally, we show how to add attributes to tags using name-valuepairs on line 020. In this case, we are giving the id attribute the value "my-node" for that specificparagraph element. This helped us uniquely identify the "my-node" paragraph using a CSS selector sothat we could change the font size.You can embed CSS into your HTML document like we saw above, or you can create a link to a localCSS file or URL in your HTML documents. Linking to a common CSS file has the advantage of allowingyou to have consistent styling on all of your HTML documents; you only have to worry about makingchanges in one place rather than in each HTML document individually. This also makes your files smaller4
by allowing you to define your styles in one centralized spot rather than having to repeat all thatinformation in each document. With that said, it is nice to be able to embed CSS in your HTML documentso that the document is self-contained. For example, if you are sending an HTML document as an emailattachment, you don’t have to worry about whether the recipient has the correct CSS files or a constantconnection to the internet!The World Wide Web Consortium (W3C), which maintains the specifications for HTML and CSS,encourages the use of CSS for controlling presentational aspects of your webpage. Meanwhile, yourcontent and its semantic relationships are stored in the HTML document itself. A big part of the HTML5specification is about reinforcing that paradigm.WHAT’S NEW IN THE HTML5 SPECIFICATION?The HTML5 specification is largely similar to its most recent predecessors, HTML4 and XHTML. Onemajor component of the change is that it adds some new tags, retires some old ones, and changes themeanings of a handful of others (W3C, 2014). It also provides web developers with more tag attributesand changes some rules and syntax. For the most part, these changes contribute to cleaner, morestandardized documents. But some of these changes also result in some cool functionality we haven’tpreviously seen with pure HTML.You probably are not interested in learning the minutiae of all that’s new and different in HTML5 unlessyou want to go on to do some more web development outside of generating SAS reports with ODSHTML5. However, there are a few important application programming interfaces (APIs) and other featuresthat have been added that you will want to be aware of: Multimedia Playback: Prior to HTML5, you needed an external plugin for your browser in order toplay movies or music. Some of you might remember Adobe Flash, which was a common plugin ofchoice for that kind of thing. Now with HTML5, audio and video playback can be handled nativelywithin the HTML document and customized with JavaScript. Starting in the third maintenance releaseof SAS 9.4, this API has been brought to you so that you can embed audio and video into your SASreports with a few data step commands. Scalable Vector Graphics (SVG): SVG is a graphics format that is perfect for the web. It is compact,scalable, and easily read by humans and computers alike. Its data format is based on XML, so itssyntax fits neatly within an HTML document. We will go into SVG in greater depth in just a moment. Mathematical Markup Language (MathML): HTML5 supports MathML, which means that you canrender professional-looking mathematical formulae in your HTML document using natively-supportedsyntax. MathML is also based on XML syntax. (W3C, 2003)HTML5 also represents a philosophical shift as it codifies a lot of the advice the W3C has been givingaround using HTML for structural content and CSS for presentational rules. These changes are alsoreflected in the HTML code generated by ODS HTML5.A 5-MINUTE INTRO TO COMPUTER GRAPHICS FILE FORMATSThink of how many graphics you see out on the World Wide Web. You have logos, pictures, icons, andmore. All of those graphics are stored in one of two types of files: 1) raster graphics files or 2) vectorgraphics files. You are probably familiar with raster graphics if you’ve ever used a digital camera or madea picture in MS Paint, but you may be less familiar with vector graphics. We hope that is about to change!Here is what you need to know to understand the advantages of each file type and how they are used inpractice.Raster GraphicsA raster graphic is an array of data organized into a grid of pixels. Each element of the data representspoint on the screen which is represented by a color defined by the data element’s value. Hence we getthe word “pixel,” which is a portmanteau combing the words “picture” (pix) and “element” (el).You set the number of pixels that a file contains when you save it, so resizing it can cause issues. Thesegraphics give you a pixelated, or blocky, appearance when you zoom in. This also means that you can5
lose detail in the smaller features of an image unless you make your image file large enough so that it hasenough pixels to adequately represent the image.There are dozens of different raster graphics file types, and they all have their own purpose. Each formathas its own strengths and weaknesses which will affect how the displayed graphic looks, how much diskspace it will take, what software is able to display it, and even whether it is considered publication quality.Carefully consider which file type, file size, and color space you choose when creating plots so that yourimages are represented appropriately for their intended medium and purpose!Raster Graphics File TypesThere are a few file types you should definitely know. You have probably made plots before in theportable network graphics (.png) format (a common default format for SAS ODS). Meanwhile, you haveprobably taken pictures which were saved in the Joint Photographic Experts Group (.jpg or .jpeg) format.A few other types that might be familiar are bitmap (.bmp), tagged image file (.tiff), and graphicsinterchange format (.gif). We will go into detail about a few of the file formats below.Portable Network Graphics (PNG)Portable network graphics (PNG) files are the default graphical output in SAS ODS HTML. These filesuse lossless compression. This means that the graphic is compressed, but all of the original information isstill available from the original graphic. In other words, you can reconstruct the image exactly as it was inthe original file. Lossless compression results in a better quality image, but the file sizes can be ratherlarge when compared “lossy” compressed files. PNG supports a lot of different ways to represent colors,such as grayscale, pseudocolor (indexed color), and Truecolor (24-bit color) plus an optional alphachannel for transparency. All mainstream browsers and image viewers support PNG files and they offeran acceptable mix of file size and graphic quality for web and general purpose images.Joint Photographic Experts Group (JPEG)Unlike PNG files, JPEG uses “lossy” compression. This compression allows you to greatly decrease thesize of graphic file. However your compressed file may differ from the original file and there is no way ofreturning to that original file. Often times you can choose what degree of compression you want, whichmeans you can choose how much quality you want to lose in the image (how small you want the file tobe). The loss in data is often not seen by the human eye, but that is not the case in every situation. Thisfile type is commonly used by digital cameras. It supports Truecolor, but does not support an alphachannel for transparency.Graphics Interchange Format (GIF)This type, like PNG, uses lossless compression which means the original file is not lost during thecompression stage. The difference between GIF and PNG is that GIF has a much smaller file size incomparison to other lossless compression files. GIF files are compressed by reducing the number ofcolors down to 256 and by replacing multiple similar colors into one. For example, instead of storing fivedifferent blues for a certain graphic; it will only store one blue. Obviously this isn’t the format of choice forany colorful graphic, but it does work well for graphics with few colors. Another attribute of GIF is that youcan include animation with your graphics, which can be an advantage over other file types with manygraphs.Image Compression and Anti-aliasingImage CompressionOne main difference between these file types is the way the files are compressed. As we mentionedbefore, file formats such as PNG use lossless compression, meaning that the original raster image can bereconstructed exactly. Meanwhile JPEG images use lossy compression, which results in a loss of data.This means that your JPEG images will be approximations of the original content, resulting in unattractiveartifacts where parts of the image look fuzzy or blocky.6
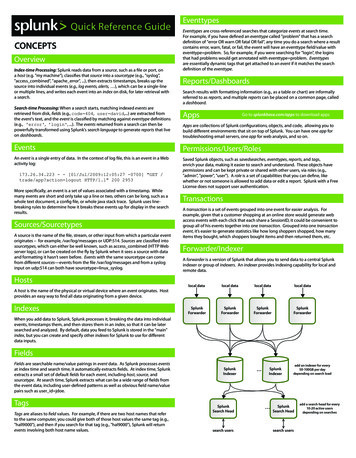
Let’s take this example of an image of a SAS programmer diving into HTML5 for the first time (Figure 1).The file has been saved in PNG format with lossless compression with and without using anti-aliasingtechniques (left and center). The same image has also been saved as a JPEG file with high lossycompression (far right). Note the fuzzy, discolored edges compared to the other two PNG images on theleft. These are compression artifacts. Figure 1 also zooms in to show how the images differ close up.Figure 1. Kid Diving into HTML5.Anti-AliasingRaster images sometimes don’t look good because your eye can see the individual pixels that make up acurve or diagonal line. The jaggedness that you see is a result of aliasing. You see it even more when theraster image is blown up larger than its original resolution. This is called pixelation.SAS makes your statistical graphics raster images look a little better by using anti-aliasing. Anti-aliasingblends image components so that pixels adjacent to the curve will appear smoother. This gives yourimage the illusion of a higher resolution. However, the price you pay is that the blending can muddy detailon some images. Figure 1 shows the same zoomed-in section of our diving SAS programmer with andwithout anti-aliasing. You control this as an option in your ODS GRAPHICS statement. It is on by defaultand we recommend that you leave it on!Vector GraphicsUnlike raster graphic files, vector graphic files contain instructions of how to draw a given graphic ratherthan the rasterized image data itself. This set of instructions tells the computer where each componentstarts and ends, as well as curves along the way. You can even use it to specify where text should bedrawn. This allows the computer to rasterize the image on the fly, meaning that panning and zooming willre-draw the image.This can result in better image quality and higher fidelity to detail. Your biggest advantage to using vectorgraphics over traditional raster graphics is the idea of resizing the image. When you resize a vectorgraphic the paths are redrawn and you do not lose image quality in the process. When blowing up a7
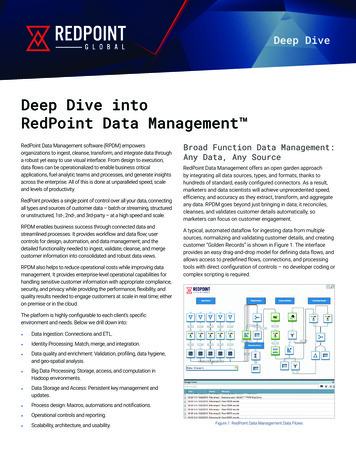
raster graphic, you get pixelation (explained above). This look appears unprofessional and can evencause issues when submitting a manuscript to a publisher.Let’s revisit our image of the SAS programmer to demonstrate the advantages of using vector graphics.This image is stored as a vector graphic. We have rasterized it at several zoom levels to show that detailis not lost (Figure 2). The computer redrew the image at each zoom level to maximize quality.Figure 2. Zooming in to show image quality is conserved.Another bonus of vector graphics is that they are often smaller files in relation to a similar raster graphicfile. Images with relatively few graphical elements can be stored as just a few “drawing instructions” in thevector file format, rather than as a large array of pixels.There are several common vector image file formats, such as Encapsulated PostScript (.eps), AdobeIllustrator (.ai), and scalable vector graphics (.svg). The file format that is probably most relevant to you asa SAS programmer is the SVG format, so we will focus on explaining that one in detail.Scalable Vector Graphics (SVG)The scalable vector graphics (SVG) file format is a very common vector graphics format. It is defined bythe World Wide Web Consortium (W3C) and is an open standard. The data are stored in eXtensibleMarkup Language (XML), which means that the information can be embedded directly into an HTMLdocument or stored as a standalone file. This also allows the graphic to be both human and machinereadable. You can even create and edit SVG files in a simple text editor!These files are comprised of three components: 1) vectors, 2) images, and 3) text (W3C, 2011). Thismeans you can mix and match the three components to suit your needs. For example, you may want tocreate a plot with your company’s logo as a raster image, but have the plot itself rendered as vectorimages, and have the axis labels as actively rendered text. SVG graphics are more “alive” than theirraster counterparts; interactive and dynamic graphics (such as animations) can be done relatively easily.Because SVG graphics are built on XML, they can be integrated tightly with the HTML document, styledusing CSS, and brought to life using scripting (like JavaScript). This means you can do things like changecomponents of the image on mouse-over or add tool-tips. Scripting opens up a wide world of dynamiccontent display and interactivity that is well beyond the scope of this paper.WHAT’S NEW IN ODS HMTL5So now that we have covered some of the more technical background of web technologies and graphicfiles, we can dive into what might be most important to you as a SAS user in ODS HTML5. There arenumerous changes and additions made within ODS HTML5 over what is available in ODS HTML, so wewill not be covering every single difference between the two output delivery systems.One of the bigger changes that SAS made in ODS HTML5 was how graphics are handled. ODS HTML5now has the ability to completely encode your plots right into the HTML file. In the past, with ODS HTML,8
you had keep track of multiple files for a report—the report itself as well as plots and graphics. This meantthat you had to send multiple files when emailing reports and dealing with broken image links whenmoving a report from place to place. Now with ODS HTML5, your graphics can be associated with yourreports in several ways. In fact, the default is that the graphics are encoded directly into the HTMLdocument so you will have standalone HTML reports that can be easily shared with colleagues (SASf).Another change in ODS HTML5 is the default graphics output format. In ODS HTML, the default graphicsdevice was PNG. Now with ODS HTML5, the default graphics device is SVG (SASf). In laymen’s terms,the major advantage of using SVG is that you can resize the image without worrying about the blown upimage looking fuzzy or jagged. Figure 2 above provides a good illustration of this. We will paddle out toexplore this more in the MAKING THE MOST OF ODS HTML5 section below.SAS has also incorporated the HTML5 specification’s ability to embed audio and/or video content right inyour HTML output document. Starting in the third maintenance release of SAS 9.4 (SAS 9.4M3), you canput audio and video files right in your HTML document using the Report Writing Interface. Theapplications with this are virtually endless. For example, you could add in an audio file that contains yourvoice explaining important output or a video that helps explain what a certain output means. We will divemore into depth on this idea in the next section.MAKING THE MOST OF ODS HTML5We have talked about many of the new additions and options you have with ODS HTML5. So, how canyou use these changes to make the most of your SAS experience? In this section, we will highlight somekey ideas to brush up on from outside ODS HTML5, as well as show you how to implement all the newtools you are offered within ODS HTML5.ACCESSIBILITYAccessibility refers to making the content of a document accessible for everyone, including people withdisabilities. You have to think about the part of your audience with sight impairments, hearingimpairments, and/or other impairments. Having an accessible document will allow these folks to navigateand understand your document more easily. According to SAS, ODS HTML5 provides the bestaccessibility among all ODS destinations. If you want your document to be readable and accessible byeveryone, using ODS HTML5 and its accessibility features will allow you to make this happen.The first and most important step to accessibility is having a good design (SASc). In an HTML document,this means both a clean look to the content as well as clean HTML code working in the background.Removing visual clutter, choosing colors with care, and using high contrast themes can help people withlow vision or other sight impairments. Meanwhile, well-structured and annotated HTML can be read andunderstood more easily by screen reader software.Here are a few specific examples of how ODS HTML5 can help make your reports more accessible(SAS): The ODSTEXT procedure within ODS HTML5 allows to specify tags such as heading tags ( h1 , h2 , etc.). This will help keep your document well organized and readable. Use of RWI to enhance accessibility using IMAGE, TABLE START, LAYOUT ABSOLUTE,LAYOUT GRIDDED, REGION Gridded, REGION Absolute. Using DESCRIPTION to add alternate text in various statements. Custom table of contents (more below) Adding style (more below) Inline SVG graphics (more below)We don’t have enough space to go into great detail about how to maximize the accessibility of yourdocument. As noted above, we will highlight some of these features in the following sections. Pleaseconsult the RECOMMENDED READING section for a link where you can find details.9
CUSTOM CSS AND STYLESTo give you a slight refresh on what was covered in the WHAT IS CSS? section, remember that CSS iswhat controls the styling, format, and layout of the given document. SAS allows the use of CSS threedifferent ways: 1) embedded, 2) inline, and 3) external (SASa). Embedded: Style, formatting, etc. is defined in the header of the HTML file. SAS allows you togenerate embedded CSS in your HTML output. This allows you to make standalone HTML files whosestyling is not dependent on an internet connection or the presence of a styling file. Inline: Much like embedded CSS, inline CSS can generate standalone HTML files. However, in thiscase, styles are defined tag-by-tag rather than in the header of the HTML document. This type ofstyling is discouraged unless there is a good reason to do so. External: You can link to CSS files based on relative or absolute path on your file system. You canalso link to CSS files on the internet. This has many advantages, such as consistency across reportsand the reduction of file size. However, the styling of these reports can be lost if the CSS file isunlinked somehow.These concepts are not unique to ODS HTML5. The use of these CSS styling techniques is available inseveral other output delivery systems, such as ODS HTML and even ODS PDF. However, they are sopowerful that it is worth reviewing them here.The following code shows how you can use the headtext option to create embedded CSS styles. Thiscode will affect all content within a td tag. Specifically, it will change the font color within the body ofthe table. The td tag denotes table data, so in this case the data cells of the PROC PRINT output tablewill be affected. Everything else will be styled based on the built-in “minimal” ODS style. The code can beseen below:filename filedir "c:\Users\&sysuserid\Desktop";ods html5path filedirfile "example embedded css.html"style styles.minimalheadtext ' style td {color: red;} /style ';proc print data sashelp.fishstyle(table) {prehtml " p style 'text-align: center;' Fish /p "}style(data) {htmlstyle "font-weight: bold;"};run;ods html5 close;Note in the code above that we’ve also snuck in some inline styling using the style option in theprocedure statement. In this case, it does not make a lot of sense to use inline styling to change the fontweight (since we could include that in our embedded CSS). However, there may be times when it isappropriate, like when we want to quickly cent
Dec 09, 2014 · format, ODS PDF for portable document format, and ODS HTML for hypertext markup language. New to SAS 9.4, users have several additional ODS statements to choose from; among them is ODS HTML5. The ODS HTML5 statement differs from ODS HTML in that it uses HTML version 5
![[MS-HTML5]: Microsoft Edge / Internet Explorer HTML5 .](/img/13/ms-html5-170314.jpg)