Transcription
Getting Started with SPSS for Mac OSJohn SamuelEdited Spring 2013 - Takuya NoguchiIntroductionHow to Use this DocumentThis document introduces prospective researchers to SPSS for Mac OS, whichcurrently runs only under Mac OS X 10.6 or higher. Those who do not own a personalcopy of SPSS for Mac OS X may access the software from various UITS StudentTechnology Centers at IU. Under the SPSS Enterprise License Agreement, faculty,staffs, and students can purchase SPSS CD for use at home.What is SPSS?SPSS is a comprehensive and flexible statistical analysis and data managementsystem. SPSS can take data from almost any type of file and use them to generateabulated reports, charts, and plots of distributions and trends, descriptive statistics,and conduct complex statistical analyses. SPSS is available on Windows and Mac OSX on Indiana University campus. The latest version for Mac OS X is only availableunder OS X 10.6 or higher.SPSS for Mac OS X provides a user interface that makes statistical analysis moreintuitive for all levels of users. Simple menus and dialog box selections make itpossible to perform complex analyses without typing a single line of command syntax.The built-in SPSS Data Editor offers a simple and efficient spreadsheet-like utility forentering data and browsing the working data file. High-resolution, presentation-qualitycharts and plots can be created and edited. Using the SPSS Viewer, you can handlethe output with greater flexibility. SPSS for Mac OS X also reads data files from avariety of file formats including Excel, SAS, and Stata.Hardware and Software RequirementsThe minimum hardware and software requirements for SPSS for Mac OS X are: OS X 10.6 or higherIntel processor1 GB RAM or more800 MB free harddisk spaceDVD-ROM driveSuper VGA (1024x768) or a high resolution monitor
OrientationWindows in SPSSThere are a number of different types of windows that you will see in SPSS for MacOS:Data Editor windowThis window displays the contents of the data file. You may create new datafiles, or modify existing ones with Data Editor. The Data Editor window opensautomatically when you start a new SPSS session.Viewer windowThe Viewer window displays the statistical results, tables, and charts from theanalysis you performed (e.g., descriptive statistics, correlations, plots, charts).A Viewer window opens automatically when you run a procedure thatgenerates output. In the Viewer windows, you can edit, move, delete and copyyour results in the Finder.Pivot Table Editor windowOutput displayed in pivot tables can be modified in many ways with the PivotTable Editor. You can edit text, swap data in rows and columns, add color,create multidimensional tables, and selectively hide and show results.Chart Editor windowYou can modify and save high-resolution charts and plots by invoking the ChartEditor for a certain chart (by double-clicking the chart) in a Viewer window. Youcan change the colors, select different type fonts or sizes, switch the horizontaland vertical axes, rotate 3-D scatterplots, and even change the chart type.Text Output Editor windowText output not displayed in pivot tables can be modified with the Text OutputEditor. You can edit the output and change font characteristics (type, style,color, size).Syntax Editor windowYou can paste your dialog box selections into a Syntax Editor window, whereyour selections appear in the form of command syntax. You can then edit thecommand syntax to utilize special features of SPSS not available throughdialog boxes. If you are familiar with SPSS software under other operatingsystems (e.g., Windows), you can open up a Syntax Editor window and enterSPSS commands exactly as you did under those platforms and execute thejob. You can open multiple syntax windows and the contents of a Syntax Editorwindow may be saved for later use.Script Editor windowScripting (e.g., Python programming language) allows you to customize andautomate many tasks in SPSS. Use the Script Editor to create and modify basicscripts.
Menus in SPSS for Mac OSMany of the tasks you want to perform with SPSS start with menu selections. Eachwindow in SPSS has its own menu bar with menu selections appropriate for thatwindow type. The Data Editor window, for example, has the following menu with itsassociated toolbar:Most menus are common for all windows and some are found in certain type ofwindows.Common menusFileUse the File menu to: Create a new SPSS system file, open an existing systemfile, read in spreadsheet or data files created by other software programs (e.g.,SAS or Stata), read in an external ASCII data file from the Data Editor; create acommand file, retrieve an already created SPSS command file into the SyntaxEditor; open, save, and print output files from the Viewer and Pivot TableEditor; and save chart templates and export charts in external formats in theChart Editor, etc.EditUse the Edit menu to: cut, copy, and paste data values from the Data Editor;modify or copy text from the Viewer or Syntax Editor; copy charts for pastinginto other applications from the Chart Editor, etc.ViewUse the View menu to: turn toolbars and the status bar on and off, and turn gridlines on and off from all window types; and control the display of value labelsand data values in the Data Editor.AnalyzeThis menu is selected for various statistical procedures such ascrosstabulation, analysis of variance, correlation, linear regression, and factoranalysis.GraphsUse the Graphs menu to create bar charts, pie charts, histograms, scatterplots,and other full-color, high-resolution graphs. Some statistical procedures alsogenerate graphs. All graphs can be customized with the Chart Editor.Utilities
Use the Utilities menu to: display information about variables in the workingdata file and control the list of variables from all window types; change thedesignated Viewer and Syntax Editor, etc.WindowUse the Window menu to switch between SPSS windows or to minimize allopen SPSS windows.HelpThis menu opens a standard Help window containing information on how to usethe many features of SPSS. Context-sensitive help is available through thedialog boxes.Data Editor specific menusDataUse the Data menu to make global changes to SPSS data files, such astransposingvariables and cases, or creating subsets of cases for analysis, andmerging files. These changes are only temporary and do not affect thepermanent file unless you save the file with the changes.TransformUse the Transform menu to make changes to selected variables in the data fileand to compute new variables based on the values of existing ones. Thesechanges are temporary and do not affect the permanent file unless you savethe file with changes.Viewer specific menusInsertUse the Insert menu to change the page breaks.FormatUse the Format menu to change font characteristics, underline, and bold.Pivot Table Editor specific menusInsertUse the Insert menu to insert titles, captions, and footnotes; and to create tablebreaks.PivotUse the Pivot menu to perform basic pivoting tasks, to turn pivoting trays onand off, and to go to specific layers in a multidimensional pivot table.FormatUse the Format menu to modify table and cell properties; to apply and changeTableLook formats; and to change font characteristics, footnote markers, andthe width of data cells.Chart Editor specific menusOptionsUse the Options menu to change x/y reference line and add title.ElementsUse the Elements menu to add a fitted regression line in a scatter plot.Text Output Editor specific menuInsert
Use the Insert menu to change the page breaks.FormatUse the Format menu to change font characteristics, underline, and bold.Syntax Editor specific menuRunUse the Run menu to run the selected commands.Script Editor specific menuMacroUse the Macro menu to run your code.DebugUse the Debug menu to step through your code, executing one line orsubroutine at a time and viewing the result. You can also insert a break point intht script to pause the execution at the line that contains the break point.Toolbars in SPSS for Mac OSEach SPSS window has its own toolbar that provides quick and easy access tocommon tasks. ToolTips provide a brief description of each tool when you put themouse pointer on the tool. For example, the toolbar with Syntax Editor window showsthe following tooltip when the mouse pointer is put on the Opne syntax document icon:Status Bar in SPSS for Mac OSA status bar at the bottom of the SPSS application window indicates the current statusof the SPSS processor. If the processor is running a command, it displaysthecommand name and a case counter indicating the current case number beingprocessed. When you first begin an SPSS session, the status bar displays themessage Starting SPSS Processor. When SPSS is ready, the message changesto SPSS Processor is ready. The status bar also provides information such ascommand status, filter status, weight status, and split file status. The followingstatusbar in an Viewer window, for example, shows that the current Viewer window is thedesignated output window and the SPSS is ready to run:
Options in SPSS for Mac OSYou can personalize your SPSS session by altering the default Opitons settings. Select SPSS Statistics/Preferences Click the tabs for the settings you want to change.Change the settings.Click OK or Apply.For example, within variable list boxes in dialogs, you have the option to display thevariable name as always or the variable label (up to 255 characters) can be displayed.
Click General from the Options dialog boxClick either Display labels or Display names under the Variable ListsClick OKPreparing Your Data forAnalysisOrganizing Your Data for AnalysisSuppose you have three test scores collected from a class of 10 students (5 males,and 5 females) during a semester. Each student was assigned an identificationnumber. The information for each student you have is an identification number, genderof each student, and scores for test one, test two, and test three (the full data set isdisplayed toward the end of this section for you to view). Your first task is to presentthe data in a form acceptable to SPSS for processing.SPSS uses data organized in rows and columns. Cases are represented in rows andvariables are represented in columns.Name Test1 Test2 Test3Tim 202324Hans 212628A case contains information for one unit of analysis (e.g., a person, an animal,amachine). Variables are information collected for each case, such as name, score,age, income, educational level. In the above chart, there are two cases and fourvariables. When data in files are arranged in rows and columns (as shown above), it iscalled cases-by-variables, or rectangular data files.In SPSS, variables are named with eight or fewer characters. They must begin with aletter, although the remaining characters can be any letter, any digit, a period, or thesymbols (@, #, , or ). Variable names cannot end with a period. Variable namesthat end with an underscore should be avoided. Blanks and special characters suchas &, !, ?, ‘, and * cannot be used in a variable name. Variable names are not casesensitive. Each variable name must be unique; duplication is not allowed.Most variables are generally numeric (e.g., 12, 93.23) orcharacter/string/alphanumeric (e.g., F, f, john) in type. Maximum width for numericvariables is 40 characters, the maximum number of decimal positions is 16. Stringvariables with adefined width of eight or fewer characters are short strings, more thaneight characters (up to 255 characters) are long strings. Short string variables can beusedin many SPSS procedures. You may leave a blank for any missing numeric
values or enter a user-missing (e.g., 9, 999) value. However, for string values a blankis considered a valid value. You may choose to enter a user-missing (e.g.,x, xxx, na)value for missing short string variables, but long string variables cannot have usermissing values.Following the conventions above, let us assign names for the variables in our data set:id, sex, test1, test2, and test3. Once the variables are named according to SPSSconventions, it is a good practice to prepare a code book with details of the datalayout. Following is a code book for the data in discussion. Note that this step is topresent your data in an organized fashion. It is not mandatory for data analysis. Acode book becomes especially handy when dealing with large number of variables. Ashort sample data, like the following, may not need a code book, but it is included forillustration.var. namewidthcolumnsvar. typevar.labelsid28Numericidentification no.sex18Stringstudent gender (f, m)test128Numerictest one scoretest28Numerictest two scoretest38Numerictest three score22In the above code book, width stands for the number of fields/columns taken by eachvariable. For example, the value for variable id takes a maximum of two fields sincethe highest identification number in our example is going to be 10. The value forvariable sex takes a maximum of one field, and so on. Columns affect only thedisplay of values in the Data Editor. Changing the column width does not change thedefined width of a variable. Var. type specifies the data type (numeric, comma, dot,scientific notation, date, custom currency or string). In our example, sex is the onlystring variable coded as f for female, m for male.The next issue is entering your data into the computer. There are several options. Youmay create a data file using one of your favorite text editors (e.g., TextEdit). Filescreated using word processing software should be saved in text format before trying toread them into an SPSS session. You may enter your data into a spreadsheet (e.g.,Excel) and read it directly into SPSS for Mac OS. Finally,you may enter the datadirectly into the spreadsheet-like Data Editor of SPSS for Mac OS. In this documentwe are going to examine two of the above data entry methods: using a text editor, andusing the Data Editor of SPSS for Mac OS.Using an Editor to Enter DataLet us first look into the steps for using a text editor for entering data. Note that if youhave a data set with a limited number of variables, you may want to use the DataEditor to enter your data. However, this example is for illustration purposes. Open upyour editor session, or word processing session, and enter the variable values into
appropriate columns as outlined in the code book. Your completed data file will appearas follows. (Note: The first line is included as a column marker line and is not part ofthe data. It must be removed before saving or using the data for analysis.)1234567890123456789001 f 83 85 9102 f 65 726803 f 90 94 9004 f 87 80 8205 f 78 86 8006 m 60 74 6407 m 88 96 9208 m 84 79 8209m 90 87 9310 m 76 73 70Save the data as a text file named, grade.dat onto a flash drive or onto the hard drive.Notice in the above data layout that one blank space is left after each variable asspecified in the code book. It is optional whether to leave a space between variablevalues. For example, you may choose to enter the data as 8868006m60746407m889692Whichever style (format) you choose, as long as you convey the format correctly toSPSS, it should not have any impact on the analysis. In the above layout, eachcase/observation has only one line (record) of data. In another situation you may havemultiple records per observation.Creating a Command file to read in yourdataIn many instances, you may have an external ASCII data file made available to you foranalysis, just like the data, grade.dat, we discussed earlier. In such asituation, you donot have to enter your data again into the Data Editor. You can direct SPSS to readthe file from the Syntax Editor window.Suppose you want to read the file, grade.dat, into SPSS from a SyntaxEditor window and create a system file – as you did with the previous data(sample.sav) by using the Data Editor. Creating a command file is a faster way todefineyour variables, especially if you have a large number of variables. You maycreate a command file using your favorite editor and then read it into a SyntaxEditor window or open a Syntax Editor window and type in the command lines.To read your already created command file into a Syntax Editor window Select File/Open/Syntax Choose the syntax file you want to read and click OpenIn the following example we are opening a new Syntax Editor window to enter thefollowing command lines. Select File/New/Syntax
When the Syntax Editor window appears, type:DATA LIST FILE ’/Users/myuser/Desktop/grade.dat’ FIXED/ id 1-2 sex 4 (A) test1 6-7 test2 9-10 test3 12-13.EXECUTE.SAVE OUTFILE ’/Users/myuser/Desktop/sample.sav’.Click and drag with your mouse to highlight the lines entered, then click Run andchoose selection. Alternatively, you can clickfrom the toolbarThe command file will read the specified variable values from the data file, grade.dat,on diskette, and create a system file, sample.sav, on diskette. Make sure you specifythe pathname appropriately indicating the location of the external data file and wherethe newly created file is to be written. However, you donot have to save a system fileto do the analysis. This means the last line is optional for data analysis. Every timeyou run the above lines, SPSS does create an active file stored in the computer’smemory. However, for large data sets, itwill save processing time if you save it as asystem file and access it for analysis.In the above command lines, DATA LIST defines a raw data file by assigning namesand formats to each variable in the file. They can be in fixed format (valuesfor thesame variable are always entered in the same location on the same recordfor eachcase) or in freefield format (values for consecutive variables are notin particularcolumns but are entered one after the other, separated by blanks orcommas). In ourexample, we used the fixed format. FIXED is the default if no format is specified. Thatis, in our example we did not have to use the FIXED keyword, but it is included for thesake of illustration. The only string variable in the data is sex, which is identified with a(A) after the variable name and column location.We do not have any numeric variables with decimal places. SPSS assumes thatdecimal points are explicitly coded in the data file. If there are no decimal points, thenumeric variables are assumed to be integers. To indicate noninteger values for datathat have not been coded with decimal points, specify the implied number of decimalplaces in parentheses after the variable name and column locationas in gpa 16-18 (2).This means the variable gpa is in columns 16-18 and is recorded as, for example,389, and it will be assigned 3.89 by SPSS.Inline dataIn the above example your data are being read from an external file, grade.dat, ondrive A. Still another option is to keep the data within the command file. Insuch aninstance you direct SPSS to read your inline data from the command lines with theBEGIN DATA and END DATA commands. In this mode of data input you willomit theFILE subcommand from the DATA LIST command. The BEGIN DATA commandfollows the DATA LIST command, and the END DATA command follows the last lineof data. All procedure commands should come after the END DATA command, but
transformation commands can be specified before BEGIN DATA. For example, if youwant to read the above data file, grade.dat, as inline data, you should modify theabove command lines as following:DATA LIST FREE/ id * sex (a) test1 test2 test3. BEGINDATA. 01 f 83 85 91 02 f 65 72 68 03 f 90 94 90 04 f 87 8082 05 f 78 86 80 06 m 60 74 64 07 m 88 96 92 08 m 84 79 8209 m 90 87 93 10 m 76 73 70 END DATA. EXECUTE. SAVE OUTFILE '/Users/myuser/Desktop/sample.sav'.In this example, we used a FREE format data layout for illustration. Each variablevalue is separated by a blank space. Since we are using free format, the columnspecification, after each variable, is dropped. Note that the variable sex is a onecharacter string variable. In free field format, when you specify a string format, thatformat applies to all preceding variables. This means SPSS will regard both id and sexto be read with the string format. To avoid this, place an asterisk (*) after the variableid, to convey that id must be read with the default numeric format. FIXED format canbe used with inline data. You may type the above lines in to a Syntax Editor window,or read in the text file with inline data into a Syntax Editor window and execute it asexplained above. Keeping data inline may not be an efficient option when you have alarge number of data lines.Using Text Import Wizard to Read TextDataUsing Text Import Wizard is another way to direct SPSS to read an external ASCIIdata file.Suppose you want to read the file, grade.dat, into SPSS from Text Import Wizard. Select File/OpenClick Text(*.txt, *dat, *csv) for the Files of type from the Open File dialog box,choose the data file grade.dat on your computer, and click OpenText Import Wizard is open, follow the Step1 to Step6 in this wizard to specifyhow the data should be read.In the following example we are opening grade.dat. Step 1 of 6: Check ‘no’ in ‘Does your text file match a predefined format?’ andclick Continue.Step 2 of 6: Check ‘Fixed width’ in ‘How are your variables arranged?’, check‘No’ in ‘Are variable names included at the top of your file?’ and click Continue.Step 3 of 6: Keep all default checks and click Next.Step 4 of 6: Insert breaks to specify the variables begin. Then click Continue.
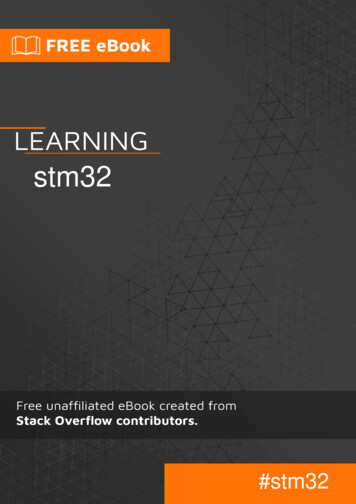
Step 5 of 6: This step is for specifications of variables selected in the datapreview. Click V1, the column highlight. Type id in the Variable name dialogbox, type numeric in the Data format dialog box. As the same way, change V2,V3, V4, V5 into sex, test1, test2, test3,respectively.Only sex is string variable. click Continue.Step 6 of 6: Keep all default checks and click Done.The data file is read into the SPSS. We can save the data file as sample.sav.Using the SPSS Data Editor for enteringdataSuppose you want to use the SPSS for Mac OS X features for data entry. In that case,you enter data directly into the SPSS spreadsheet-like Data Editor. This is convenientif you have only a small number of variables. The first step is to enter the data into theData Editor window by opening an SPSS for Mac OS X session. You will define yourvariables, variable type (e.g., numeric,alphanumeric), number of decimal places, andany other necessary attributes while you are entering the data. In this mode of dataentry, you must define each variable in the Data Editor. You cannot define a group ofvariables (e.g., Q1 to Q10) using the Data Editor. To define a group of variables,without individually specifying them, you would use the Syntax window.Let us start an SPSS for Mac OS X session to enter the above data set. If you areusing your own Mac OS X, start Mac OS X and launch SPSS.This opens the SPSS Data Editor window (titled Untitled). The Data Editor windowcontains the menu bar, which you use to open files, choose statistical procedures,create graphs, etc. When you start an SPSS session, the Data Editor window alwaysopens first.You are ready to enter your data once the Data Editor window appears. The first stepis to enter the variable names that will appear as the top row of the data file. Whenyou start the session, the top row of the Data Editor window contains a dimmed var asthe title of every column, indicating that no data are present. In our sample data set,discussed above, there are five variables named earlier asid, sex, test1, test2,and test3. Let us now enter these variable names into the Data Editor. To define thevariables, click on the Variable View tab at the lower left corner of the Data Editorwindow and: Type in the variable name, id, at the first row under the column Name.Press the Tab key to fill-in the variable’s attributes with default settings.
SPSS considers all variables as numeric variables by default. Since id is a numericvariable you do not have to redefine the variable type for id. However, you may wantto change the current format for decimal places. Enter 0 for Decimals.Now let us define the second variable, sex. Type in the variable name, sex, at the second row under the column Name.Press the Tab key to fill-in the variable’s attributes with default settings. To modify the variable type, click on theicon in the Type column.Select String by clicking on the circle to the left.Define the remaining three numeric variables, test1, test2, and test3, the same waythe variable idwas defined. Once you have finished, the Variable View screen shouldlook like:Click on the Data View tab. Now enter the data pressing the tab key or the right arrowkey after each entry. After entering the last variable value for case number one usethe arrow key to move the cursor to the beginning of the next line. Continue theprocess until all the data are entered.Saving Your SPSS DataAfter you have entered/read the data into the Data Editor, save it onto a flash drive.Those who are working from personally owned computers might want to save the fileto the hard disk. Select Save or Save As from the File menu. A dialog box appears.
Fill the File name box that you want to save and choose SPSS Statistics asSave as type.Click SaveThe data will be saved as an SPSS format file. Note that the data file, grade.dat, yousaved earlier and the file, sample.sav, you saved now are in different formats.Even after saving the data file, the data will still be displayed on your screen. If not,selectsample.sav-SPSS Data Editor from the Window menu.Descriptive Data AnalysisSuppose that you have the data set, sample.sav, still displayed on your screen. If not,selectsample.sav - SPSS Data Editor from the Window menu. (If you usedthe Syntax Editor window to read in your data file, grade.dat, then also makethe sample.sav - SPSS Data Editor window active.)The next step is to run some basic statistical analysis with the data you entered. Thecommands you use to perform statistical analysis are developed by simply pointingand clicking the mouse to appropriate menu options. This frees you from typing in yourcommand lines.However, you may paste the command selections you made to a SyntaxEditor window. The command lines you paste to the Syntax Editor window may be
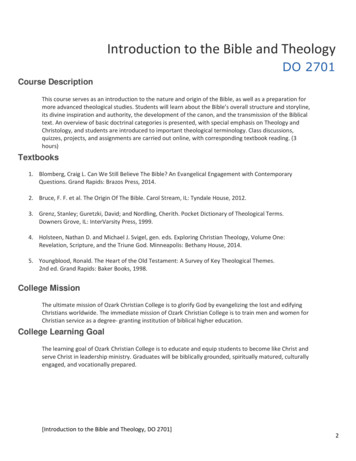
edited and used for subsequent analysis, or saved for later use. Usethe Paste pushbutton to paste your dialog box selections into aSyntax Editor window.If you don’t have an open Syntax Editor window, one opens automatically the firsttime you paste from a dialog box. Click the Paste button only if you want to view thecommand lines you generated. Once you click the Paste pushbutton the dialogselections are pasted to theSyntax Editor window, and this window becomes active.To execute the pasted command lines, highlight them and click run. You can alwaysget back to the Data Editor window by selectingsample.sav - SPSS Data Editor fromthe Window menu.Computing a New VariableBefore computing the descriptive statistics, we want to calculate the mean scorefromthe three tests for each student. To compute the mean score: Select Compute Variable from the Transform menu. A dialog box appears
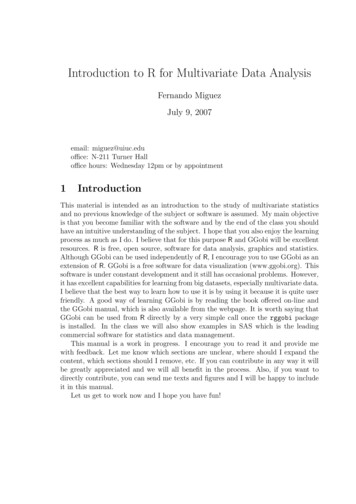
In the box below the Target Variable: type in average as the variable nameyou want to assign to the mean scoreMove the pointer to the box titled Numeric Expression: and type: mean (test1,test2, test3)Click OKA new column titled average will be displayed in the Data Editor window with thevalues of the mean score for each case.FREQUENCIESTo run the FREQUENCIES procedure: Select Descriptive Statistics from Analyze menuChoose Frequencies A dialog box appears. Names of all the variables in the data set appear on theleft side of the dialog box. Select the variable sex from the list. It is highlighted.Click the arrow button right to the selected variable.Now the selected variable appears in a box on the right and disappears from the leftbox. Note that when a variable is highlighted in the left box, the arrow button is pointedright for you to complete the selection. When a variable is highlighted in t
he right box, the arrow button is pointed left to enable you to deselect a variable (byclicking the button) if necessary. If you need additional statistics besides the frequencycount, click theStatistics button at the bottom of the screen. Whenthe Statistics dialog box appears, make appropriate selections and click Continue.In this instance, we are interested only in frequency counts. Click OKThe output appears on the Viewer screenDESCRIPTIVESOur next task is to run the DESCRIPTIVES procedure on the four continuousvariables in the data set. Select Descriptive Statistics from the Analyze menuChoose Descriptives A dialog box appears. Names of all the numeric variables in the data set appear onthe left side of the dialog box.
Click the variable average and click the arrow button to the right of the selectedvariableDo the same thing for the variables test1 through test3Now the selected variables appear in the box on the right and disappear from the boxon the left.The mean, standard deviation, minimum, and maximum are displayed by default. Thevariables are displayed, by default, in the order in which you selected them.Click Options for other statistics and display order. Click OKThe following output will be displayed on the Viewer screen.
MEANSSuppose you want to obtain the above results for males and females separately. TheMEANS procedure displays means, standard deviations, and group counts fordependent variables based on grouping variables. In our data set sex is the groupingvariable and test1, test2, test3, and averageare the dependent variables. Beforeproceeding with the analysis let us clear the output window to better view the outputfrom the MEANS procedure and later print it out. To do so, make the Viewerwindowactive (select Output1 - SPSS Vi
What is SPSS? SPSS is a comprehensive and flexible statistical analysis and data management system. SPSS can take data from almost any type of file and use them to generate abulated reports, charts, and plots of distributions and trends, descriptive statistics, and conduct complex statistical analyses.