Transcription
A Beginner’s Guide to Molecular Visualization Using PyMOLBy Nicholas FitzkeeMississippi State UniversityIn this lab, we will be using the program PyMOL to visualize and analyze protein structures.PyMOL is a powerful utility for studying proteins, DNA, and other biological molecules. Thesoftware itself is well written and easy to use, and in the past 10 years it has become very popularwith structural biologists.Many of the concepts we will learn are explored in greater detail in the PyMOL User’s Guide.Although somewhat dated, the User’s Guide has very useful information and is definitely worthreading. Several of the images from the User’s Guide have been reproduced in this document.You can download the guide at roughout this document, you will be asked to answer questions about proteins and proteinstructures. To differentiate questions from the rest of the text, the questions are placed against abackground of grey, like this. In some of the questions, you will be making molecular graphics,and while you can print this and submit them in class, you are welcome to submit your answersdigitally via email if it is more convenient. You can place your pictures into a Word documentusing the “Insert Picture” feature.Obtaining PyMOLPyMOL was originally written by Warren Delano as an updated molecular viewer. Back in theearly 2000’s, many viewer programs existed, but all of them were aging, and none tookadvantage of the recent advances in video card technology. Additionally, no one program wassufficiently polished to do many things well. RasMol was great for structural analysis, but it haddated graphics. Molscript produced fabulous illustrations, but it was cumbersome to use and wasnot designed for analyzing structures. MolMol was a great tool for analysis, but it was no longerbeing supported. Insight2 could do many things well, but it was expensive and was eventuallybought out by Accelrys, who has since let it stagnate. Other viewers, like SwissPDB Viewer andCn3D functioned well, too, but all of them had severe limitations of one sort or another. PyMOLis not perfect, but had several unique advantages for the time: Unlike most scientific software, PyMOL is highly polished; it won’t unexpectedly crashwhile you’re using it.PyMOL can produce high-quality graphics, on par with Molscript, without needing tomanually edit text files.PyMOL has an extensive help system, and documentation can be found by typing helpcommand for many commands.Measurement of bond distances and angles is straightforward in PyMOL. Structures canbe analyzed in a semi-automated way with scripting support.PyMOL is optimized to use high-end graphics hardware, and it can support 3-D graphics(the same 3-D that modern TVs are just now starting to use).
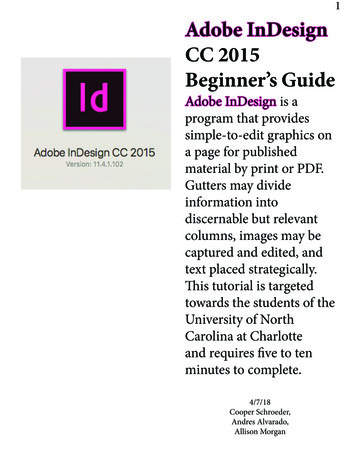
Warren implemented PyMOL in the Python programming language, which made it easy for endusers to extend its functionality with plugins and scripts. He also released PyMOL as acompletely open-source project, which encouraged other users to download the source code (forfree) and experiment with the program. Warren’s payment model was based on the honorsystem: if you were a student, you could use PyMOL for free, but academic labs wereencouraged to support PyMOL by paying a yearly subscription based on the size of the lab.Accordingly, subscribing labs could get support (often direct from Warren himself), and theywould have access to newer versions than what was made available for free. Since PyMOL wasopen source software, savvy users could always download and compile the latest version andcompile it themselves, but this required a certain level of expertise and time commitment thatmany academic users did not have.Unfortunately for all of us, Warren passed away in 2009, and the fate of PyMOL was uncertainfor a time. Eventually, the software company Schrödinger took over the project, and since 2009they have maintained Warren’s vision (more or less) and kept the project going.PyMOL is still freely available for academic use, with two main limitations: (1) the version youuse as an academic may lag somewhat behind the most recent version that Schrödingermaintains, and (2) no official support is offered. Fortunately, there is a strong user community,and it’s easy to find answers to questions on the web.To obtain PyMOL, visit the PyMOL website (http://www.pymol.org/educational), read thenotice, and then click on the “register here” link at the bottom of the page. You’ll need to fill outthe form, and the automated system will eventually send you a link with a username andpassword. This allows you to download the software for your Mac or PC system.Installation is straightforward, and PyMOL can be installed like any other PC or Macintoshsoftware. During the installation process on a PC, you may be presented with several dialogsregarding initial configuration of PyMOL. You may safely leave these set at the default values.Alternatively, you can obtain an older version of PyMOL directly (version 0.99 rc6) from thefollowing site: /. This version is fullyfunctional and is sufficient for this tutorial; however, it does not appear to work with Windows 7systems. You may have better luck than me, so it’s worth trying.Running PyMOLRunning PyMOL is like running nearly any other program on your computer. When you runPyMOL (on Windows, run “PyMOL Tcl-Tk GUI”), you will be presented with the maindisplay (Figure 1).Page 2
External GUIVisualizationAreaInternalGUIFigure 1. The PyMOL main display.In Windows, this display is set up across two windows. The top window constitutes the“External GUI,” and contains the menu options as well as buttons for advanced visualization. Itcontains a large text area as well, which logs the commands you have used in the viewer.The bottom window contains the “Visualization Area,” which is the main area where moleculeswill be displayed. The visualization area can also display text, like help text. When in textmode, the visualization area displays similar information to what is displayed in the external GUItext box.The bottom window also contains another “Internal GUI.” This GUI will contain a list ofmolecular objects once you have loaded a protein structure. The bottom of this GUI has a matrixdisplaying the current mouse configuration, namely what mouse button combinations controlwhich functions. It also contains additional buttons for making molecular movies.On Macintosh systems, all three of these regions are merged into the same window, but theregions are all there, and the behavior between Windows and Mac is otherwise identical.Opening Your First PDB FileHigh-resolution molecular structures are determined by one of two methods, namely X-raycrystallography or NMR spectroscopy. Unfortunately, time doesn’t permit us to discuss thesetechniques in depth; suffice it to say that once the three-dimensional atomic coordinates aredetermined, they can be formatted into a text file that programs like PyMOL can read. Thesefiles are called “PDB” files, short for the “Protein Data Bank.”Page 3
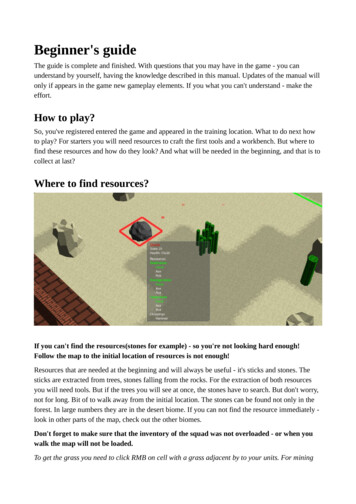
As scientists determine new molecular structures, they submit the coordinates to the ResearchCollaboratory for Structural Bioinformatics (RCSB). This organization maintains the PDB, andit ensures that all PDB files have the proper format and supporting data. They also offeroutreach and implement new approaches to understanding macromolecular structure. The PDBwebsite is available at http://www.pdb.org/, and you can browse this site to learn more aboutwhat the RCSB does.Database entries in the PDB are given a characteristic four-character code that is used to identifythe structure. For example, 1SNC is an entry for the protein staphylococcal nuclease.Staphylococcal nuclease is an enzyme that hydrolyzes (cleaves) DNA and RNA. It is used byStaph. aureus to destroy foreign genetic material from bacteria and other sources. Nuclease hasbeen extensively studied, and many of its properties were established by Chris Anfinsen in the1960’s. The following paper describes the properties of staphylococcal nuclease in detail,including the sedimentation and diffusion coefficients:Heins, James N., et al. (1967) J. Biol. Chem. 242 (5): 1015-1020.The crystal structure of nuclease has been determined, and you can access this entry by searchingthrough the PDB website for 1SNC. The web page for 1SNC contains much information abouthow the structure was obtained. It is possible to download the entry directly, and this file iscalled a PDB file. The normal extension for these files is PDB, e.g. the file would be named1SNC.pdb.Visit the PDB website page for 1SNC and download the file. At the right hand side of the screenis an option to “Download Files.” When you click this link, you’ll be presented with the optionto download the PDB file as text. Save this file to a convenient location – you will shortly openthe file in PyMOL.1. Several critical pieces of information are given on the 1SNC web page. What is thelength of this protein (the number of residues)? What is the resolution of this structure(in Angstroms)? Who are the scientists responsible for this structure?To open the PDB file, select “File Open” in the external GUI window, and select the 1SNCPDB file that you downloaded. The PDB file will load, and you will see the “lines”representation of the protein (Figure 2). In this representation, each chemical bond is drawn as aline, and atom nuclei exist where the bonds intersect. In the default representation, Carbonatoms are green, nitrogen is blue, oxygen is red, sulfur is yellow, and phosphorus is orange.Hydrogen atoms are rendered white, but they aren’t typically visible in a crystal structure.Page 4
Figure 2. Staphylococcal nuclease rendered as lines.Basic Viewing Functions and NavigationWithin the viewing window, you can click and drag with the left mouse button to rotate themolecule. Dragging with the right mouse button will allow you to zoom in and out. Finally,dragging with the middle mouse button will translate the structure in the X-Y plane of yourmonitor. Using a combination of rotations, translations, and zoom operations, it’s possible toposition yourself anywhere within the molecular frame, although it does take some getting usedto.Another useful visualization tool is called “slab.” As you look at the protein, the viewing axiscoming out of the monitor is the Z-axis. Sometimes, the region of interest is in the center of theprotein, occluded by the atoms on the surface. The slab setting allows you to adjust the viewing“slab” to eliminate the extra atoms from the display (Figure 3).Molecular z-axisYour point ofviewSlab limitsFigure 3. The concept of slab.In the figure, anything outside of the slab limits is hidden, and only the region between the dottedlines is displayed. As you adjust the slab, the slab limits change: the length of the red arrows canPage 5
be very large, allowing you to view the entire molecular frame. Alternatively, you can make theslab very small, focusing in on a particular region of the protein. In PyMOL, rolling the mousewheel toward you decreases the size of the slab, and rolling it away from you increases the slab.PyMOL also allows you to interact with the molecule itself, selecting individual residues (oratoms) by clicking on them. When you click on the protein, the atoms in the selected residue arehighlighted with pink boxes. You can see the selection in the text box of the external GUIwindow:You clicked /1SNC//A/LYS 16/CDSelector: selection "sele" defined with 9 atoms.From this syntax, I know that I clicked on the delta carbon (CD) of 1SNC, chain A, Lysine 16.Since multiple atoms were defined in my selection, I know that the whole residue was selected.You can select multiple residues with the mouse by clicking on additional atoms, or you canunselect residues by clicking the same residue again (not a double click; two single clicks).Whenever you make or modify a selection, you can see the number of atoms in the external GUIwindow. To unselect all residues, click on an area of the viewer window with no atoms.A summary of all this is displayed in the lower right hand corner of the viewer window. It willtell you that you are in “3-Button Viewing” mode, and that you are selecting “Residues.” Asummary of the mouse commands are displayed in a convenient matrix. By clicking on theregion, it is possible to change the mouse mode (from “3-Button Viewing” to “3-ButtonEditing”), and you can also change the selection mode (possible options are: Objects, Segments,Chains, Molecules, Residues, Atoms, and C-alpha atoms). For our purposes, we will operatemostly in “3-Button Viewing” mode, selecting residues.An alternative way to select residues is by directly using the protein sequence. In the externalGUI window, select “Display Sequence.” You’ll notice that at the top of the viewer windowyou can now see the sequence of residues in Staphylococcal nuclease (starting at residue 7,“LHKEP ,” or “Leu, His, Lys, Glu, Pro”). The sequence starts at the N-terminus (Ala 7) andends at the C-terminus (Ser 141). By using the scroll bar and clicking on the residues, you canselect residues by number without having to find them in the structure. This is a convenient wayto locate a residue if you aren’t sure of its location.Directly above the mouse mode matrix is a region in the viewing window which displays a list ofvisible objects available in PyMOL. At the top of this list is “all,” and clicking this will allowyou to quickly show or hide all visible objects. Below this, you will see “1SNC,” which is thePDB file we are currently viewing. And, depending on whether you have atoms selected, youwill see a “(sele)” below that, denoting the selection you have currently created. (Remember,since they have pink dots, selections are “visible” objects, too!)Next to each object name, you will see five letters: A (actions), S (show), H (hide), L (label), andC (color). Each of these buttons brings up a window with additional options for this object. Forexample, under the action menu (A) for 1SNC, you can select “zoom” to center the molecule inthe viewer window and zoom so that the entire molecule fits in the window. We will discussother options later on.Page 6
Before we move on, remember that the graphical viewer window can also be toggled with a textdisplay. If you select the viewer window and press ESC, you will see the text associated with allof the commands you have performed so far. Unlike the text in the external GUI, this text doesnot have a scroll bar, but it is helpful for seeing a log of what you’ve been doing. Pressing ESCagain will switch you back to graphics mode.2. What is the three-letter amino acid sequence for residues 100-105 in 1SNC?Selection CommandsIn the previous section, we demonstrated how molecules could be selected using the mouse orsequence display. However, often times it’s necessary to select atoms more precisely. Tofacilitate this, PyMOL offers a command-line for fine control of its functionality. Commands inPyMOL can be entered in two places: the PyMOL prompt at the bottom of the external GUIwindow, or the same prompt in the viewer.As an example of atom selection, type the following command into either PyMOL prompt:select loopca, resi 42-52 and name CAIf you zoom in on the selected region, you’ll notice that the C-alpha (CA) atoms have beenselected in the loop between residues 42 and 52. You’ll also notice that a new selection objecthas been created in your list of objects called “loopca” (selection objects are enclosed inparentheses). The external GUI once again notes the number of selected atoms. You can refer tothis selection object in other PyMOL commands, as we’ll see below.Breaking up this particular command, we can identify its distinct parts:select loopca,This tells PyMOL to define a new selection named “loopca.” The name of the selectionis the first “argument” to the selection command. The comma following this commandtells PyMOL’s parser that we’re going to move on to another argument. The secondargument of the select command is the selection itself.resi 42-52 and name CAThis syntax tells PyMOL how to define the selection “loopca.” The entire statement isthe second argument (arguments in PyMOL are separated by commas). The selectionsyntax is straightforward: The first selection statement (the text before the and) tells PyMOL to selectresidues by index (that’s the i in resi), from 42-52. The second selection (after the and) tells PyMOL to select all atoms with nameCA (the C-alpha atoms).Page 7
Finally, the and operator tells PyMOL to take the intersection of the two sets:only those atoms that are both named CA and are in the loop from residues 42-52.Obviously, we could have dropped the second half of the selection statement to select all atomsin residues 42-52. Similarly, we could have reversed the order of the residues: the intersectiondoes not depend on the order of operations.Some other useful selection statements are below. They can all be combined with the operatorsand, or, or not. You can also use parentheses to group statements if you aren’t sure howPyMOL will order them – just like in math. resn name This statement will select all residues with a given 3-letter name name . For example,select ala, resn ala will select all alanines in the protein. Multiple residue namescan be selected with the “ ” sign, e.g. select negative, resn asp glu. elem name This statement allows you to select elements by their atomic symbol, e.g. “He” forhelium, “C” for carbon, etc. It’s useful for changing the default color scheme, since youcan easily select all carbon atoms (if you don’t like green carbons.) selection 1 within distance of selection 2 This statement allows you to select things by distance, where distance is inAngstroms. The commandselect site, name CA within 10 of resi 25will select all C-alpha atoms within 10 Ǻ of any atom in residue 25. Note that thisinvolves some calculation: some CA atoms may be within 10 Å of parts of residue 25,but they may be farther from other atoms. If the distance cutoff applies for any atom pairfrom selection 2 and selection 1 , it will be included.The selections all and visible can also be useful sometimes, too. Respectively, they select allatoms or only those that are already visible in the viewer window. You can get more help onselection syntax by typing “help selection” into the viewer window prompt. Remember topress ESC so you can view the text!3. How many carbon atoms are there in all the Alanine residues between residues 15-60?What command did you use to determine this?Page 8
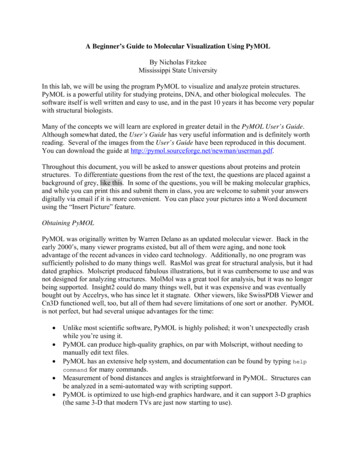
Molecular RepresentationsAs you have probably noticed by now, viewing only bonds has its disadvantages. For one,there’s no concept of how much space the atoms occupy. Secondly, the sheer number of atomsin a protein can be cumbersome. It would be nice to simplify the view a bit, and then highlightareas of interest as needed.To accomplish this, scientists have developed multiple schemes for visualizing proteins andnucleic acids. Some examples are Sticks: These are similar to the lines we have been working with so far, but they arethicker, like the molecular models used in organic chemistry.Spheres: In this representation, all atoms are drawn as spheres, with radii that arecharacteristic of their (s) electron orbitals. This is also called CPK representation, afterCorey, Pauling, and Branson, the originators of such models.Cartoons: In this representation, the side chain atoms are ignored, and smooth line isdrawn through the backbone alone. Alpha helices and beta strands are drawn as coils andarrows, respectively.As you might expect, it’s possible to draw these representations in PyMOL (Figure 4).SticksSpheres (CPK)CartoonsFigure 4. Alternative representations of protein structure.Each representation has its strengths and weaknesses. Cartoons, for example, work great forsimplifying the structure, but it’s hard to get information about the chemistry involved in theenzyme. Sticks, on the other hand, reveal the chemical structure but are hard to interpret forlarge systems. Spheres make it easy to understand packing and steric hindrance, but theyocclude the interior of the protein. Published figures often include some combination of thesethree representations.PyMOL supports all of these representations through the show and hide commands. So, typingshow spheres will show the CPK model of the protein. Typing hide spheres will hide it.Page 9
There are many representations to choose from, but for our purposes we will only work with:lines, sticks, spheres, and cartoon.Multiple models can be displayed simultaneously. For example when you type show cartoonwhen the program first loads the 1SNC file, you will still see that the lines representation isdisplayed until you type hide lines. Additionally, the show and hide commands can accept anoptional second argument. If you place a comma after the representation type, you can specify aselection of atoms to show, like so:show representation , selection hide representation , selection Here, selection is either a selection string (e.g., resi 40-52), or a named selection that youhave defined with the select command (e.g. “loopca”). This allows you to mix and matchrepresentations. Areas where interesting chemistry occurs (i.e. the active site) can be shown inatomic-level detail, while the rest of the protein can be drawn as a cartoon model. If you everreach a point where you are frustrated and want to start over, you can type hide everything tohide all of the representations.When a scientist prepares a molecular figure for publication, he or she must makereasonable decisions about how to create that figure. It is not always easy to know what levelof detail to include in a picture, and every picture represents an individual’s interpretation ofwhat’s important. This interpretation can be better or worse depending on the chemical reality.Importantly, by choosing to hide some atoms in the cartoon representation, a scientist canintentionally or inadvertently leave out important structural details.Now that you know how to change the molecular representation, there are only two morecommands you need to know to produce professional-quality molecular images. The first is thecolor command. It works exactly like the show command, except that its first argument is acolor. Most colors are okay to use, for example, this command:color orange, resn ser thr and elem Cwill color the carbons of all serine and threonine residues orange. This is useful for when youwant to highlight something distinct from the rest of the protein.Another useful command is the ray command. This command performs ray-tracing on themolecule to produce a photorealistic picture. Although ray-tracing is far beyond the scope of ourdiscussion of macromolecules, it is simply a simulation where calculations are made todetermine how light will reflect off of an object (our protein) and be visible from a viewport (ourscreen). Because this calculation involves simulating the paths of many photons, it takes a whileand it’s impractical to do all the time. However, ray-tracing produces the best moleculargraphics possible, and once you have your display configured, it’s well worth the time.To ray trace the image in PyMOL, simply type ray at the command line. After a few seconds,the ray-traced image will appear. We will talk about how to save the image in the next section,but note that if you click on the viewer window after ray tracing the image will be lost; thus, it’sPage 10
important to save the image right after ray tracing so you don’t lose the calculation. There areother commands to change the resolution of the final image, but for the purposes of this lab thedefault resolution is sufficient (640 by 480 pixels).Finally, for publications, it’s good to use a white background instead of black. You can changethis by selecting “Display Background White” in the external GUI window. Since black iseasier to view on a screen, you can change back to black by selecting “Black” from the menu.Saving Your ResultsOnce you have an appealing image, it’s a good idea to save your results. In PyMOL, the state ofthe molecule along with the coordinates and object listing are saved as a session file. A sessioncontains all the needed information to reproduce the view window, and you should save yoursession frequently to avoid losing work. To do this, select “File Save Session As ” from theexternal GUI window. When you restart PyMOL, you can load this session and all of thesettings you used will be recalled. Given that some molecular images can take a significantamount of time to design, this feature is very useful.While PyMOL sessions contain program information about your molecule, they do not containgraphical information for use in other programs (like MS Word). Since ray tracing can take along time, PyMOL provides a method for exporting images, too. Saving an image is like savinga session; select “File Save Image As PNG” to save your file in PNG format, which isreadable by nearly every word processing and presentation application available today. If you dothis immediately after ray-tracing, the ray-traced image will be saved. You can save images atany time, and it will capture the current display in the viewer window; however, if the images arenot ray traced they will be of much lower quality.4. The 1SNC file you are using contains several parts: The protein itself spans residues 1141. Additionally, there is a nucleic acid analog present in the active site (Thymidine3’,5’-diphosphate, resn THP). There is also a calcium ion in the active site.Construct a ray-traced image where all protein carbon atoms are colored grey. Startwith a cartoon model on a white background (no lines), and then add the followingdetails: The carbon atoms of the THP should be yellow, and all non-protein atoms shouldbe represented as spheres. Then, display as sticks all protein atoms with 10 angstroms ofthe THP and calcium atoms. Select an orientation that highlights the active site, andsubmit this image to your instructor with your completed assignment.For this figure, use a white background (Display Background White).Structural AnalysisOur lab is almost complete, but there is one more important feature of PyMOL that bearsmention. In addition to aiding in the visualization of proteins, it can also be used to analyzeproteins. It is possible to measure interatomic distances, scalar angles, and torsion angles usingPyMOL. These measurements can be used in interpreting other biophysical experiments. ForPage 11
example, one would expect tight binding to result in close contact between ligands and proteins,and one could also expect a correspondence between measured hydrodynamic data and theobserved shape of the protein (i.e. how spherical it is).To measure distances, select “Wizard Measurement” from the external GUI window. You’llsee some options appear in the object list (Figure 5).MeasurementmenuFigure 5. Distance measurement options in PyMOL.Once the measurement tool is enabled, you will be asked to pick atoms for use in themeasurement. Since we are currently measuring distances, PyMOL will ask you for two atoms.If you are measuring scalar angles, three atoms will be needed, and torsion angles require fouratoms. Go ahead and pick two atoms to measure the distance between them. A yellow dottedline is displayed indicating your distance, and the distance itself is displayed by the line (inAngstroms). A new measurement object appears in the object list as well, allowing you to hide itif you prefer. Eager to proceed, PyMOL asks you for another atom when the first measurementis complete.The measurement window has several options. By clicking on “Distances” you can select othermeasurements, including scalar and dihedral (torsion) angles. You can also control how PyMOLdeals with new distance objects. The default is to create a new object with each measurement,but by clicking on the “Create New Object” button, you can control this behavior as well.Finally, there are buttons to delete the last measurement object or delete all objects. When youare done with measurement, click the “Done” button and you will be returned to the normalmouse mode.5. What is the longest dimension you can find in staphylococcal nuclease? If you had toestimate the volume of a prolate spheroid of the same size, what would it be? (Recall thatସగܸ ൌ ܾܽ ଶ , where a is the radius of the major axis and b is the radius of the minor axis.)ଷPage 12
A Goldmine for the ObservantCurrently, there are over 77,000 structures of biological macromolecules in the PDB. Back in2001, the number was less than 20,000. This increase in structural data has been very useful forscientists, but analyzing that amount of data is a challenge. Structural trends and organizingprinciples undoubtedly exist in the PDB, but it takes time and a keen eye to identify them.Programs like PyMOL are useful for structural analysis, not only because you can measureatomic geometries, but also because you can spot more qualitative trends in the structuresthemselves.As an example, recall our discussion of alpha helices. Each carbonyl oxygen in an alpha helix atresidue i makes a hydrogen bond to the amino proton at residue i 4. But this leaves severalresidues on each end of the helix without hydrogen bond partners. George Rose and LeonardPresta first observed that side chains will occasionally snake around so that they can satisfy thesehydrogen bonds, a phenomenon called “helix capping.”In staphylococcal nuclease, many of the helices are solvent exposed, and water can satisfy thehydrogen bonds. Thus, no side chains are involved in helix capping. However, the N-terminusof helix 2 (residues 99-106) is buried in the core of the protein, and for this helix the cappingproblem is solved in an i
Warren implemented PyMOL in the Python programming language, which made it easy for end users to extend its functionality with plugins and scripts. He also released PyMOL as a completely open-source project, which encouraged other users to download the source code (fo