Transcription
Research Articlewww.acsami.orgThermal Conductivity of Ultrahigh Molecular Weight PolyethyleneCrystal: Defect Effect Uncovered by 0 K Limit Phonon DiffusionJing Liu,† Zaoli Xu,† Zhe Cheng,† Shen Xu,† and Xinwei Wang*,‡,††Department of Mechanical Engineering, Iowa State University, 2010 Black Engineering Building, Ames, Iowa 50011, United StatesSchool of Environmental and Municipal Engineering, Qingdao Technological University, Qingdao, Shandong 266033, People’sRepublic of China‡ABSTRACT: Crystalline ultrahigh molecular weight polyethylene (UHMWPE) has the highest reported thermalconductivity at room temperature: 104 W/(m·K), whiletheoretical predictions proposed an even higher value of 300W/(m·K). Defects and amorphous fraction in practicalUHMWPE fibers significantly reduces the thermal conductivity from the ideal value. Although the amorphous effect can bereadily analyzed based on the effective medium theory, thedefect effects are poorly understood. This work reports on thetemperature-dependent behavior (down to 22 K) of thermaldiffusivity and conductivity of UHMWPE fibers in anticipationof observing the reduction in phonon density and scattering rate against temperature and of freezing out high-momentumphonons to clearly observe the defect effects. By studying the temperature-dependent behavior of thermal reffusivity (Θ, inverseof thermal diffusivity) of UHMWPE fibers, we are able to quantify the defect effects on thermal conductivity. After taking out theamorphous region’s effect, the residual thermal reffusivities (Θ0) for the studied two samples at the 0 K limit are determined as3.45 104 and 2.95 104 s/m2, respectively. For rare-/no-defects crystalline materials, Θ0 should be close to zero at the 0 Klimit. The defect-induced low-momentum phonon mean free paths are determined as 8.06 and 9.42 nm for the two samples.They are smaller than the crystallite size in the (002) direction (19.7 nm) determined by X-ray diffraction. This stronglydemonstrates the diffuse phonon scattering at the grain boundaries. The grain boundary thermal conductance (G) can beevaluated as G βρcpv with sound accuracy. At room temperature, G is around 3.73 GW/(m2·K) for S2, comparable to that ofinterfaces with tight atomic bonding.KEYWORDS: polyethylene, thermal reffusivity, phonon scattering, heat capacity, interface thermal conductancetemperature increases from 0.5 to 3.5 W/(m·K) when SWNTloading is increased from 0 to 20 wt %.15Until now, a lot of effort has been devoted to studying thefactors which affect the k of PE and how to improve its k. The kof PE is dependent on many factors: temperature, thecrystallinity of the PE fibers, the crystallite orientation, andthe chain length.1,16 21 Overall, at lower temperatures, the k ofsemicrystalline PE fibers increases as temperature increases.When temperature is relatively high, k increases with increasingtemperature at a slower rate. Some experiments find that kdecreases after it reaches a maximum value at a certaintemperature. This phenomenon that k of PE has a peak value astemperature changes from 0 K to room temperature dependson the crystallinity of the PE fibers.1 Scott et al. measured the kof PE within the temperature range of 0.15 4 K. The k ofsemicrystalline PE shows a T3 dependence between 1 and 4 Kwhile it shows a lower power temperature dependence whentemperature is below 1 K.19 Dyneema fiber, one kind of PE1. INTRODUCTIONTypical polymers are well-documented to have a low thermalconductivity (k) in the order of 0.1 W/(m·K).1 Polymers with ahigh k have been promising candidates for industrialapplications combining with their other characteristics such asmechanical flexibility, high corrosion resistance, lighter weight,and chemical stability.2 4 Examples of applications include solarhot-water collectors, heat exchangers, electronic packaging,5membranes, microelectronic devices and nanocomposites,6 8gas sensors, field-effect transistors, and other fields.9 Eventhough bulk polymers have a low k, the polymers can bemanipulated and improved via structure engineering andtailoring to achieve relatively high k. Significant improvementis achieved in enhancing k by introducing particles with a higherthermal conductivity such as ceramics,10 metals,11 graphene,12,13 or carbon nanotube (CNT)14 into the polymermatrix. Vasileiou et al. evaluated the k of linear low-densitypolyethylene/thermally reduced graphene oxide (LLDPE/TRGO) composites. The k of the composites is reported tobe twice as large as that of pure LLDPE.13 k of single-walledCNT (SWNT)/high-density PE (HDPE) composites at room 2015 American Chemical SocietyReceived: September 13, 2015Accepted: November 21, 2015Published: November 21, 201527279DOI: 10.1021/acsami.5b08578ACS Appl. Mater. Interfaces 2015, 7, 27279 27288
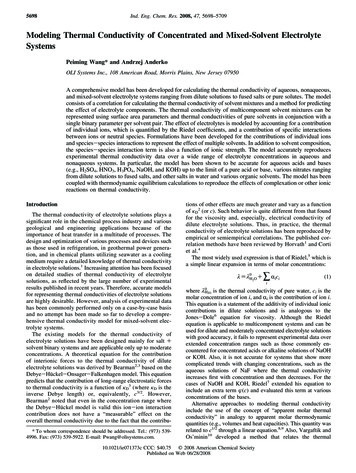
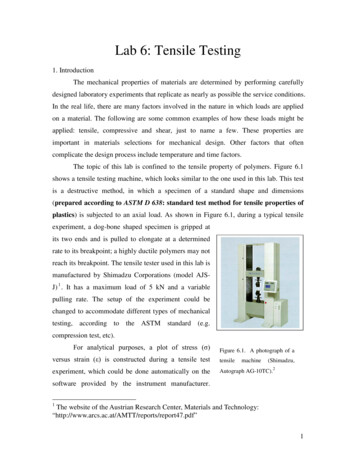
Research ArticleACS Applied Materials & InterfacesFigure 1. (a) Schematic molecular arrangement in crystalline PE fibers. The chains are carbon chains. The carbon chains shown in different colorsare located on different lamellae. c-direction is always along the carbon chain direction. a 7.41 Å, b 4.94 Å, and c 2.55 Å. (b) Experimentallyreported crystal structure of PE. (c) Scanning electron microscope (SEM) image of the sample before it is split into several fine fibers. (d) Samplethat is broken into fine fibers mechanically to illustrate its internal stranded structure. The diameter of the sample used in this experiment is 50 μm.The finest split fiber could be 1 μm thick. This concludes that the large fiber is composed of fine fibers aligned along the axial direction.shows that the c-direction is highly aligned along the fiber axisdirection along which the k was measured. More details aboutthe crystallite orientation will be given when the molecularstructure of the samples is discussed.In this work, first we measure the thermal diffusivity (α) andk of semicrystalline ultrahigh molecular weight polyethylene(UHMWPE) fibers from room temperature down to 22 Kusing the transient electrothermal (TET) technique.25 Aftersubtracting the effect of the amorphous region, the inverse ofthermal diffusivity of PE fibers, termed as thermal reffusivity inthis work (Θ), is studied for its variation from around roomtemperature down to 22 K. This allows us to identify the effectof defect phonon scattering and assess the mean free path dueto defect-induced phonon scattering in crystalline regions (l0).And then we evaluate the volumetric heat capacity (ρcp) andthe interface thermal conductance (G) of fully crystalline macroPE fibers with a new method that includes both experimentaland theoretical studies.fiber with sound crystalline structure, low defect density, andhigh crystal alignment, has a k of about 30 W/(m·K) at roomtemperature.18 The order of k of amorphous PE chain increasesfrom 0.001 to 0.1 W/(m·K) as the chain length increases.20k of stretched PE fibers is found to increase from 0.55 to 14 W/(m·K) due to stretching. This is mainly due to the fact that thealignment of crystallite in PE fiber is enhanced bystretching.17,22 For single PE chains, the length of the chainplays an important role in determining the thermalconductivity; molecular dynamics (MD) simulations showsthat k of a single PE chain can be 300 W/(m·K) when thechain is longer than 40 nm.23 Shen et al. found that the k ofultradrawn nano PE fiber with a length and diameter of 290 μmand 130 nm could be as high as 104 W/(m·K). The authorsattribute the high k to extended chains and crystalliteorientation after the fiber had been drawn.5Figure 1a shows a schematic molecular arrangement incrystalline regions in semicrystalline PE fibers. Figure 1b showsthe experimentally reported crystal structure of PE.24 It can beseen that each PE chain has an extended planar zigzagconformation. The PE chains with different colors shown inFigure 1a are on different lamellae. Since the interchain van derWaals force is much weaker than the intrachain covalent force,k of PE along the chain direction (c-direction in Figure 1a,b) ismuch larger than those along the other two directions.17Further investigation of the molecular structure of our samples2. SAMPLE STRUCTURE CHARACTERIZATIONCommercial UHMWPE fibers with high strength and extended chainsfrom Minifibers Company are used in this experiment. Their modulusis around 850 g/den (den denier), and the density is 0.96 g/cm3.The molecular mass is usually between 2 and 6 million Da forUHMWPE. The molecular structure of the fiber is characterized usinga confocal Raman system (Voyage, B&W Tek, Inc. and OlympusBX51). A 532 nm Raman laser of 16 mW is focused on the fiber with a27280DOI: 10.1021/acsami.5b08578ACS Appl. Mater. Interfaces 2015, 7, 27279 27288
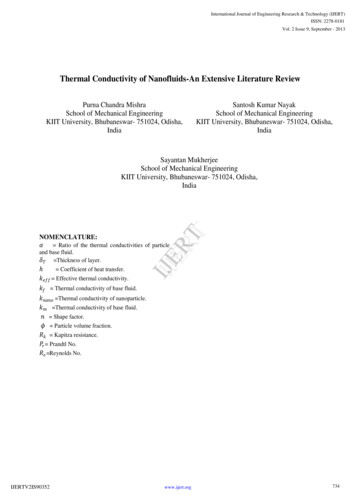
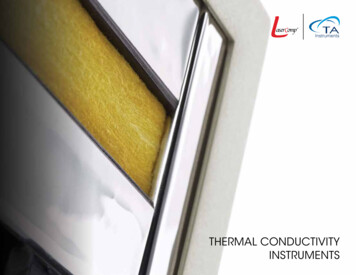
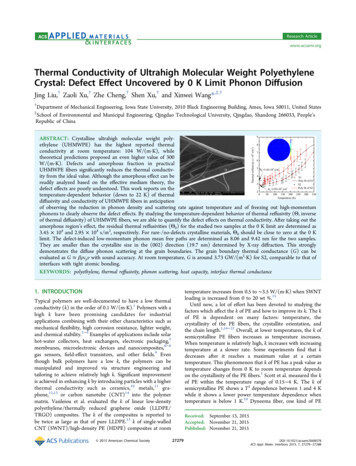
Research ArticleACS Applied Materials & InterfacesFigure 2. (a) Raman spectrum of our studied UHMWPE. (b) X-ray diffraction patterns for the UHMWPE fibers. The inset in panel b shows theschematic experimental setup for determining the crystallite size in the (002) direction. The normal lines of the X-ray beam are out of the plane ofPE fibers and in the plane of PE fibers, respectively.Figure 3. (a) Schematic of the XRD experiment with β 0 . (b) Pole figure for (002) plane. (c) Pole figure for (200) plane. (d) Intensity variationalong a varying β with a fixed α corresponding to a twisting motion. (002) plane: α 0 . (200) plane: α 90 .that the large fiber is composed of fine fibers aligned along the axialdirection.Figure 2b gives the X-ray diffraction (XRD, Rigaku Smartlabdiffractometer) patterns for the UHMWPE fibers. It can be seen thatthe sample is highly crystalline and the crystallinity is determined to be91.9%. The crystallite size in the (002) direction is determined to bearound 19.7 nm. For the out-of-plane directions, the crystallite size is12 1.6 nm. The inset in Figure 2b shows the schematic experimentsetup for determining the crystallite size in the (002) direction. Thenormal lines of the X-ray beam are perpendicular and parallel to theplane of PE fibers, respectively. Detailed crystalline structureorientation is analyzed based on the XRD pole figures. Figure 3ashows the schematic of the XRD experiment with β 0 . The polefigures for the (002) plane and the (200) plane are shown in Figure3b,c. Figure 3d shows the intensity variation along a varying β with afixed α corresponding to a twisting motion: for (002) plane, α 0 ;50 lens. A 20 s integration time is used to obtain a representativespectrum of the fibers as shown in Figure 2a. Sharp peaks are observedat 1060 and 1130 cm 1 for C C stretching mode and peaks at 1167and 1296 cm 1 for CH2 twisting mode for all-trans -(CH2)n- in thecrystalline structures. The existence of amorphous structures isillustrated by the amorphous peaks at 1440 and 1460 cm 1. The2842 and 2878 cm 1 peaks indicate CH2 stretching modes in the fiberwhich are not related to the crystalline structures.26,27 When we place aPE fiber on a glass slide, and use another glass slide to press the fiber,we find the PE fiber can be mechanically split into finer ones. Figure 1cshows the scanning electron microscope (SEM) image of the samplebefore it is split into several finer fibers. It can be seen that the crosssection of the fiber is not exactly round. Figure 1d shows that a sampleis split into several fine fibers mechanically, which illustrates its internalstranded structure. The diameter of the sample used in this experimentis 50 μm. The finest split fiber could be 1 μm thick. This concludes27281DOI: 10.1021/acsami.5b08578ACS Appl. Mater. Interfaces 2015, 7, 27279 27288
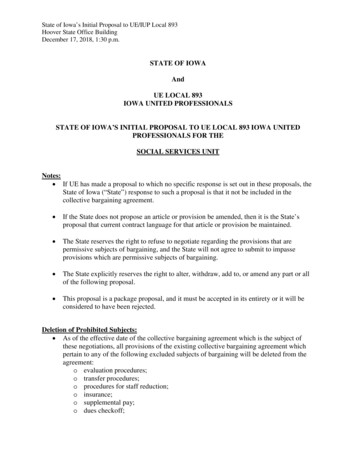
Research ArticleACS Applied Materials & Interfacesfor (200) plane, α 90 . Combining b d, we could conclude that thecrystallite orientation (the c-direction in Figure 1b) is highly along theaxial direction of the fiber. For the (002) plane, the orientationdistribution shown in Figure 3d has a very small angle distributionalong the fiber axis: 8.28 for full width at half-maximum. Figure 3band the intensity distribution in Figure 3d show the (200) plane ismore spread out (all along α of 0 90 ) than the (002) plane. Theexcellent orientation of the PE crystal in the fiber also explains whythey have a high c-direction thermal conductivity ( 25 W/(m·K) atroom temperature), which is larger than that of many unprocessed PEfibers.electrically conductive. This is needed to make it applicable forTET measurement. The sputtering machine is Quorum Q150TS.As shown in Figure 4a, the to-be-measured sample issuspended between two aluminum electrodes and placed in avacuum chamber of a cryogenic system (CCS-450, JANIS).The fiber electrode contact is secured with silver paste toensure excellent electrical and thermal contact. The vacuumlevel remains under 0.5 mTorr by a liquid nitrogen coldtrapped mechanical vacuum pump to eliminate the effect ofheat convection in the measurement. During the thermalcharacterization, a square current offered by a current source(Keithley 6221) is fed through the fiber to induce Joule heating.The temperature rise caused by the Joule heating will lead to arise of the sample resistance and thus the voltage over the fiber.An oscilloscope (Tektronix DPO3052) is used to monitor thevoltage evolution over the fiber. The normalized temperatureevolution is derived from the voltage evolution. Once thenormalized temperature evolution is obtained, the thermaldiffusivity of the sample can be obtained by fitting thenormalized temperature change curve against time. The TETtechnique has been evaluated rigorously and used successfullyin our laboratory to measure various conductive and nonconductive micro-/nanoscale fibers. The measurement accuracyhas been fully evaluated by measuring reference materials andcomparing the results with reference values. More details couldbe found in the references.25,29,30Figure 4a shows the schematic setup and experimentalprinciple of the TET technique. Since the aluminum electrodesused in this experiment are much larger than the sampledimension, the temperature of the electrodes can be assumedunchanged even though a small current is through it. Theboundary conditions can be described as ΔT(x 0) 0, whereΔT T T0 (T0, room temperature). The heat conductionalong the sample can be treated as one-dimensional due to thesample’s very high aspect ratio (length to diameter). Thegoverning equation is3. THERMAL CONDUCTIVITY OF UHMWPE3.1. Thermal Characterization Principle. Since there aredifferences among UHMWPE fibers even though they areproduced at the same time, two UHMWPE fibers are used todo the experiment (S1 and S2). Geometric parameters andsurface morphology of S2 obtained under SEM are shown inFigure 4a. Since we could not make multiple samples with theexactly same diameter and length, the samples’ length anddiameter are 1.32 mm and 49.08 μm for S1 and 1.17 mm and45.17 μm for S2. The thermal diffusivity and conductivity of thetwo UHMWPE fibers are measured from 290 K down to 10 Kby using the TET technique.25,28 First, the UHMWPE fiber iscoated with 15 nm thickness iridium in order to make it (ρcpT ) t k 2T q̇ x 2(1)where ρ, cp, and k are the density, specific heat, and thermalconductivity of the sample, respectively, q̇ is the electricalheating power per unit volume. It has the form of I2Rs/AL,where A and L are the cross-sectional area and length of thesample, respectively. The normalized temperature rise, which isdefined as T*(t) [T(t) T0]/[T(t ) T0], is solved as25T* 96π4 m 11 exp[ (2m 1)2 π 2αeff t /L2](2m 1)4(2)where αeff is the sample’s effective thermal diffusivity thatincludes the effect of radiation and iridium coating. After thevoltage evolution is obtained, the experimental normalizedtemperature increase can be calculated as (V V0)/(V1 V0),where V0 and V1 are the initial and final voltages over thesample.The theoretical normalized temperature rise is calculatedaccording to eq 2 by using different trial values of αeff and iscompared with the experimental results. The trial value whichgives the best fit of the experiment data is taken as the sample’seffective thermal diffusivity (αeff). The real thermal diffusivity(αreal) of the sample is obtained after subtracting the effect ofradiation and iridium as31,32Figure 4. (a) SEM image of an UHMWPE fiber connected betweentwo electrodes during TET measurement. (b) Normalized temperature variation and TET fitting result when a 2.2 mA square currentwith a 5 Hz modulation frequency is applied to S2 at 10 K (where, forexample, 1E-5 represents 1 10 5). The accuracy of the fitting isdemonstrated by comparing two theoretical curves with 10% variationof the best fitted thermal diffusivity. The effective thermal diffusivity(αeff) that includes the effect of radiation and iridium is determined as3.02 10 5 m2/s.27282DOI: 10.1021/acsami.5b08578ACS Appl. Mater. Interfaces 2015, 7, 27279 27288
Research ArticleACS Applied Materials & Interfacesαreal αeff LTL16εσT 3L2 LorenzRAρcpπ 2Dρcp(3)ε and σ are emissivity and the Stefan Boltzmann constant,respectively. LLorenz is the Lorenz number (2.45 10 8 WΩ/K2) for iridium. Figure 4b shows the experimental data of the V t curve and fitting result when the experiment is conducted at10 K ambient temperature with a square current of 2.2 mA fedto S2. The corresponding normalized voltage increase is 1.05%.The modulation frequency of the square-wave current is 5 Hz,and the corresponding period is much longer than the timetaken for the sample to reach the steady state. The rise time ofthe current source is 2 μs, much shorter than the time for thesample to reach the steady state. Excellent fitting is obtained inthe results. The accuracy of the fitting is demonstrated bycomparing two fitting curves with 10% variation of the effectivethermal diffusivity which is shown in Figure 4b. We find thatthe fitting curve is sensitive to the selected effective thermaldiffusivity, which indicates that the obtained effective thermaldiffusivity has a high accuracy. The effective thermal diffusivityis determined to be 3.02 10 5 m2/s for S2 at 10 K.3.2. Thermal Diffusivity and Thermal ConductivityVariation against Temperature. The effective thermaldiffusivity of S1 and S2 is characterized with the TET techniquefrom room temperature down to 10 K. Based on the sample’scrystallinity of 91.9% (obtained previously using XRD), thevolumetric heat capacity of this sample is evaluated using theheat capacity of extrapolated crystalline and amorphous PE as afunction of temperature given in Chang’s work.33 The densitiesof crystalline PE and amorphous PE are determined to be 1000and 851.5 kg/m3 according to previous work.16 The volumetricheat capacity of the sample is derived from the literatureaccording to the following equation: (ρcp)sample (ρcp)cχ (ρcp)a(1 χ), in which χ is crystallinity and it is determined byXRD analysis. The subscripts “c” and “a” are for crystal andamorphous structure. Figure 5a shows the determined ρcpvariation against temperature for the sample. This result isused in eq 3 to subtract the effect of radiation and iridiumcoating. Here we use an emissivity of 0.2 to subtract the effectof radiation on thermal diffusivity. The emissivities of PE andiridium are 0.1 and 0.3, respectively. The upper half-surface ofthe PE fiber is coated with iridium while the lower is not, so weuse 0.2 as the effective emissivity.Figure 5b shows the temperature dependence of αreal for S1and S2. The uncertainties of the real thermal diffusivitymeasurements are presented by error bars. The temperature ofthe sample increases a little bit due to Joule heating, socorrections are made to represent the real temperature of thesample for the measured thermal diffusivity. The R Trelationship of the sample is first obtained, and then theaverage of the initial and the steady-state resistances in the TETmeasurement is used to calculate the characteristic temperatureof the sample for reporting its thermal properties. This is whythe lowest temperature is a little bit higher than 10 K in Figure5b. During the TET test, the temperature rise is commonly lessthan 10 K when the voltage is increased by 3% or less. FromFigure
†Department of Mechanical Engineering, Iowa State University, 2010 Black Engineering Building, Ames, Iowa 50011, United States ‡School of Environmental and Municipal Engineering, Qingdao Technological University, Qingdao, Shandong 266033, People’s Republic of Chi