Transcription
Pros and Consof CFD and Physical Flow ModelingA White Paper by:Kevin W. Linfield, Ph.D., P.E.Robert G. Mudry, P.E.August, 2008 2008 Airflow Sciences CorporationAll Rights Reserved
When it comes to flow modeling to optimizeperformance or to develop solutions for flow-relatedproblems, a frequent question that industry engineersask is “Which is better – a CFD or physical (scale)flow model?”. The short answer is “It Depends”.BackgroundNASAComputational Fluid Dynamics (CFD) is a method of simulating fluid flowbehavior using high speed computers. There are well-known mathematical equationsthat define how air and gases behave (Conservation of Mass, Momentum, and Energy).These equations are extremelycomplex (differential equations),and thus can not be solved byhand calculations except for verysimple geometries such as flowaround a cylinder. As computerpower increased in the 1970s,the aerospace industry led theway in developing software toapproximate solutions to these Figure 1 – CFD was first developed for the aerospace industryequationsforcomplicatedflows around air and space craft. Over the past few decades, these software toolshave advanced to a point where accurate solutions can be obtained for complex flows,including heat transfer, particle tracking, and chemical reactions.Figure 2 - CFD mesh for an electrostatic precipitatorIn a CFD model, the three-dimensional domain isbuilt in the computer via a CAD model. A computationalmesh is then inserted into the domain – this meshdivides the region where flow travels into many controlvolumes, or cells. It is not uncommon for a CFD modelto contain millions of these cells. The software thensolves the equations of fluid motion (Conservation ofMass, Momentum, and Energy) in every one of thesecells. The results are plotted as color contours to depictthe flow parameters at any location within the domain.Thus, it is possible to analyze millions of velocities,pressures, temperatures, species concentrations,and other values. Computer-generated animationscan also be created that provide flow visualization toobserve the “real-time” motion of the flows.
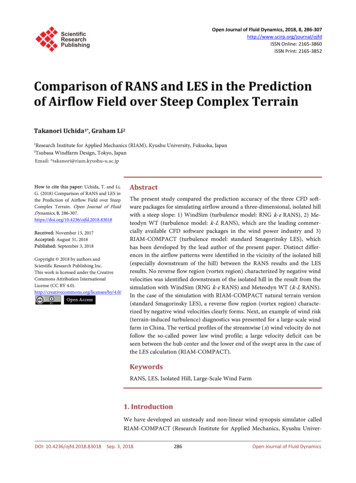
www.wright-brothers.orgIt is difficult to determine how long physicalflow modeling has been used in engineeringapplications. Obviously, full-scale versions of landand sea vessels were tested via trial-and-error forcenturies to optimize designs. In the early 1900s,the Wright Brothers tested a scaled version of anairfoil in a small wind tunnel that led to the age offlight. Since the 1960s, scale models have beenused to assess flow patterns in power plant ductsystems, pollution control equipment, and boilers.Today, many of these models are built to a scale of Figure 3. Wright Brother’s wind tunnel1:8 to 1:16, with 1:12 being a common scale factor.Figure 4. Physical flow modelof a power plant dry scrubberand baghouse systemOnce the physical model is constructed, largefans are used to draw air through the model at a flowrate that provides similar fluid dynamic behavior to thefull scale system. Flow characteristics are measuredover a grid of traverse points with an inserted probe.Values for velocity and pressure at select locationsare thus obtained. Dust can be injected into a modelto simulate the behavior of particulate in a system (toFigure 5. Smoke flow through anassess ash deposition, for example). Of course, theSCR physical modelmodel is constructed with clear walls or windows so thatflow patterns can be observed via smoke flow, strings, or bubbles. Model results can bepresented as color contours, histograms, or other plotting methods similar to field testing.With either type of model, the flow patterns through the system are quantified andthe model geometry is iteratively altered in order to optimize the flow. The location andshape of control devices such as turning vanes, mixers, baffles, and dampers are thusdetermined such that the design objectives are attained.AccuracyWith the proliferation of high speed computers, the resolution and cell size ofCFD models has improved dramatically over the past few decades. Airflow SciencesCorporation, which has used both modeling methods since 1975, has made numerouscomparisons between CFD modeling, physical modeling, and field testing. Resultsindicate that both types of models share the same accuracy when it comes to velocitiesand pressures. For more on this please visit ASC’s web site (www.airflowsciences.com) for Conference Proceedings which make this comparison with respect to ESP andscrubber modeling.
Figure 6. Comparison of CFD and physical model results for an FGD duct systemwhere flow from 3 units (1,750 MW total) combine to feed 3 new booster fans (CFDpressure drop 1.19 IWC; Physical pressure drop 1.27 IWC)There are certain areas where CFD and physical model results differ and it isnot clear which provides the best real-world results. For instance, in SCR modeling,CFD models tend to predict slightly worse ammonia uniformity at the catalyst comparedto physical models. Industry comfort is with the physical model in this case, and it ispossible that the underlying mesh is not fine enough to resolve all the details of theinjection and mixing. That said, there is not a lot of specific data published that showshow well either model matches real-world test data.Similarly, for wet FGD absorbers and stacks, physical models are often usedwith liquid water injected into the models. Though the droplet size is not scaled properly,and evaporation is not represented accurately, some industry designers find value in theresults and utilize their experience to interpret the results of the wet modeling. This isa very complex flow phenomenon, where two-phase flow momentum effects the dropletagglomeration exist. This is equally difficult to simulate with a CFD model, even withevaporation and thermal effects simulated. So both model types have drawbacks andindustry experience in applying the results to the real world become important.ScheduleCFD modeling is almost always faster than physical modeling. In many cases,design results from a CFD model are available several weeks before similar results froma scale model. And the more complicated or repetitive the model geometry is, the moreadvantage the CFD model has. This has to do with three factors: 1) the CFD mesh canusually be built faster than a scale model can be fabricated, 2) for repetitive or symmetricduct systems, portions of a CFD model can be copied and pasted while all pieces of thephysical model need to be built separately, and 3) once a CFD model is built, it can berun simultaneously on separate computers. Thus, several designs can be evaluated atthe same time, while only one physical model exists to evaluate designs.Modeling CostCFD model studies are generally 20-40% less than a comparable physicalmodel effort. This is tied quite strongly to the labor difference in model construction thatinfluences the schedule. Also, many CFD tasks can be automated with the computer,including the design optimization process, whereas these tasks are primarily manualwith the physical model.
ScaleMost physical models are built to scale, typically 1:12 or 1:16 for power plantmodels. CFD models are almost always built full size (1:1 scale). Care must be takenin computer models to ensure that the correct number, size, and shape of computationalcells are used, and the level of detail to include must be considered in a scaled model toensure geometric and dynamic similarity is maintained. In a CFD model, the ReynoldsNumber is often matched exactly, while in a physical model industry generally tries tomatch the Reynolds Number regime (i.e., laminar or turbulent). Both are fine as longas the boundary layer is negligible. This is generally the case for large power plant ductsystems. Note, however, that one must closely match the exact value of the ReynoldsNumber if the objective is to determine lift or drag characteristics, or any system wherethe boundary layer along a surface is important.Figure 7. Comparison of CFD and physical model of a windboxParticulateIn general, solid particle drop-out or re-entrainment is more accurate in a physicalmodel. These tests help assess whether particulate (such as flyash) will fall out of the gasstream at lower unit flow rates. It is important to run thephysical model at comparable velocities to the actualsystem, taking into account particulate aerodynamiccharacteristics which can be determined via wind tunneltests. CFD results can be used to assess potentialareas for particulate drop-out by examining low velocityregions near duct floors and other surfaces, but CFDcannot yet predict re-entrainment of particles as thesystem flow rate ramps up. This is because particulatebuild-up and re-entrainment are time-dependent Figure 8. Physical model dusttesting (dust accumulation simulatedphenomena. A physical model can be used to observewith fine white powder)the particle behavior over time, but a CFD model isgenerally run as a steady-state simulation.
Particulate tracking is often desired to assess itemssuch as Large Particle Ash pluggage, activated carbon/sorbentinjection, or flyash erosion issues. Particles “in flight” are bettersimulated in a CFD model. This is because the CFD model is runfull scale and can thus match all the important factors for particlebehavior simultaneously (gravity, particle drag, gas velocity, gasviscosity, particle Reynolds number, particle mass and size).Some qualitative assessments of particle behavior “in flight” canbe performed with physical models, but because all the scalefactors and fluid dynamic properties are challenging to matchsimultaneously, quantifiable results are more difficult to obtain.Figure 9. CFD tracking of ash particlesin flight to assess LPA screen captureHeat TransferFor complex temperature problems (especially those involving conduction, convection,or radiation), CFD is really the only option. Physical models are often called “cold-flow models”since room-temperature air is drawn through the domain. Methods have been devised tosimulate thermal mixing in a physical model (such as the merging of gas streams of differingtemperature) via an injected tracer gas. Unless they are run at temperature, however, physicalmodels cannot simulate heat transfer, addition of heat, or similar phenomena. CFD modelsare run at the correct temperature, and take into account changes in density, viscosity, thermalconductivity, and the heat transfer coefficient. CFD models of boiler combustion processes,heat exchangers, and evaporative processes are thus possible.586.0602.8619.6636.4Temperature (f)653.2670.0Figure 10. CFD modeling of thermal mixing (SCRinlet duct with economizer bypass flow)Figure 11. Physical model testing of ammonia injection in an SCR via tracer gas simulationChemicalReactionSimulation of a chemical reaction (such as combustion or change-of-state) canrealistically only be done with a computational model or a laboratory test that includes thereactions. The latter would not really be referred to by industry as a “physical flow model” asmuch as a lab test (such as a combustion test chamber). Short of such a lab test, computerflow modeling can be used to simulate complex processes, incorporating individual speciesand compounds via reaction equations. Furnace combustion models are done via CFDto assess items such as burner/OFA systems, NOx creation, gas temperature uniformity,SNCR performance, slagging, and corrosion. Also, evaporative processes can only be fullysimulated in a CFD model due to the changes in temperature and the moisture transfer fromone state to another.
VisualizationBoth types of models rely on color contour plotsand flow statistics (uniformity, min/max values, etc.) toquantify results. Smoke injections and string tufts arealso used to visualize the flow field inside a scale model.These are videotaped and photographed to document theflow patterns. Dust testing results are also videotaped soobservations of particulate drop-out and re-entrainmentcan be documented. Flow animations from CFD resultscan provide similar views on the motion of the flow as aphysical model smoke test. CFD animations can also Figure 12. Smoke flow details in apresent characteristics that are difficult to quantify in a physical modelphysical model (i.e., a visual tracking of injected gas molecules, such as SO3 or NH3, througha duct).Figure 13. CFD injection of activatedcarbon upstream of an electrostaticprecipitator(Left – full ESP; Right – close up atlance location)Touch & FeelSeeing and touching a laboratory model can be more satisfying than looking at colorcontour plots and animations of a virtual model. Many clients appreciate walking around a3-D scale model and examining flow details around the vanes, through perforated plates, andnear internal structure. What’s best depends on personal preference.StorageCFD models are usually stored on tape, CD-ROMS or DVDs which typically have amuch longer storage life and negligible space requirements. Physical models can take upconsiderable space in a warehouse. A benefit of the physical model after the design effort isthat it can be used for other purposes, including as a training tool for plant staff or as a displayitem for a plant lobby.ConclusionAs noted above, there are certain flow characteristics that are best simulated witha particular type of model. Since there are advantages and disadvantages of both models,a number of new systems, particularly the more expensive pollution control devices suchas SCR and FGD, utilize both modeling methods to get the optimal design. For ductworksystems, ESPs, or fabric filters, both methods have shown they offer similar results and acceptable designs; in these cases, the selection of the method often comes down to personalpreference of the OEM or the end user.
Corporate Office12190 Hubbard StreetLivonia, MI 48150-1737 USATel. (734) 525-0300Fax (734) 525-0303www.airflowsciences.comWestern Region OfficePO Box 22637Carmel, CA 93922-0637 USATel. (831) 624-8700Southern Region Office3709 Foster Hill Drive NorthSt. Petersburg, FL 33704-1140 USATel. (727) 526-9805Southeast Asia AgentHANA Evertech Co. Ltd.Jeff Jangjjang@airflowsciences.com 82-31-777-3780www.airflowsciences.comCopyright 2008 Airflow Sciences CorporationAll rights reserved. No part of this publication may bereproduced, stored in a retrieval system, or transmitted,in any form of by any means, electronic, mechanical,photocopying, recording, or otherwise, without the priorpermission of the copyright owners.Any comments relating to the material contained in thisdocument may be submitted to asc@airflowsciences.com.
Figure 7. Comparison of CFD and physical model of a windbox CFD modeling is almost always faster than physical modeling. In many cases, design results from a CFD model are available several weeks before similar results from a scale model. And the more complicated or repetitive the model geometry i