Transcription
Measuring Customer Satisfaction andPerceptionsEighth Annual PSM Users’ Group ConferenceKeystone, Colorado26-30 July 2004smiSoftware Metrics, Inc.
Customs and Border Protection (CBP)Office of Information Technology (OIT)CBP (the former Customs Service, former Inspectors and formerBorder Patrol) is part of the Department of Homeland SecurityOIT develops and maintains software and infrastructure thatsupports controlling the borders of the United States Enforcement software and tariff collection software for itemsand people entering the US Enforcement software for items leaving the USNation-wide telephone, radio and data networksMaintains a national data centerPage 2smiSoftware Metrics, Inc.
OIT Measurement InitiativeOIT has an enterprise-wide process improvement programGoal is to work towards CMMI Level 4Measurement one of 16 initiatives in the process improvement effortMeasurement Initiative1.Implement a Common Measurement Process Based on PSM2.Expand measures implemented during FY20033.Automate Data Collection, Analysis and Reporting Using Insight4.Measure Progress and Impact of CMMI-based Process Improvement5.Strategic MeasuresPage 3smiSoftware Metrics, Inc.
Five Guiding PrinciplesThe OIT Enterprise Measurement Initiative will follow five guidingprinciples during FY2004. These are: Broaden and strengthen a culture of measurement throughoutOIT Collect, analyze, and report measures based on explicitinformation requirements Involve all management and working levels in the developmentof a common measurement process Rollout measurement in small steps to facilitate assimilationand expertise in measurement at all management levels: fromthe working level to the Assistant Commissioner. Enter data once, use it in multiple placesPage 4smiSoftware Metrics, Inc.
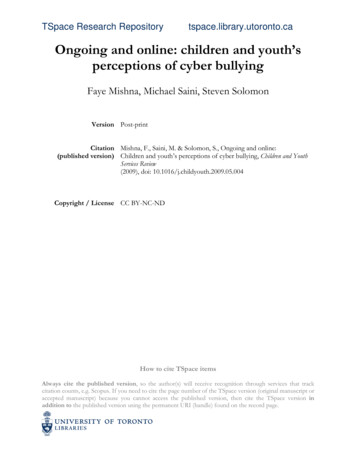
Performance Baseline MeasurementNeed expressed by senior-level management to Baseline the currentorganizational PerformanceOMB’s Performance Reference Model is used as a way to establisha “line of sight” from Inputs to OutcomesStart with measuring Customer Satisfaction to provide insight into: What are the OIT products and services for people on the frontline? What are their Pain Points with these products or services? What is the Impact when they do not have access to an OITproduct or service?The results will provide the foundation for an OIT PerformanceBaselinePage 5smiSoftware Metrics, Inc.
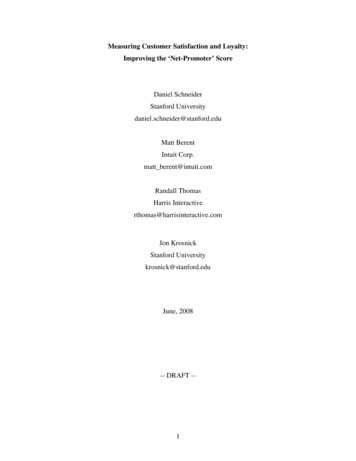
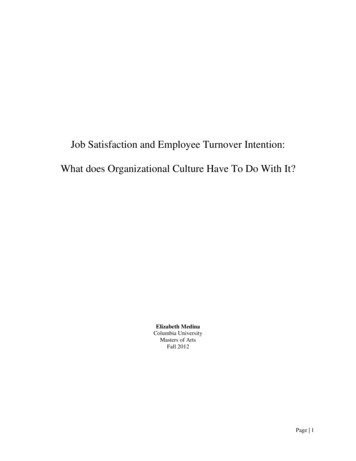
OMB’s Federal Enterprise Architecture:Performance Reference Model v1.0Strategic OutcomesMissionMission andand BusinessBusiness ResultsResultsCustomerCustomer ResultsResults-- ServicesServices forfor CitizensCitizens-- SupportDeliverySupport Delivery ofof ServicesServices-- ManagementofGovernmentManagement of Government ResourcesResources-- Customer-- ServiceCustomer BenefitBenefitService QualityQuality-- ServiceCoverageServiceService Coverage- Service AccessibilityAccessibility-- TimelinessTimeliness andand s andand ActivitiesActivities-- FinancialFinancial-- ProductivityProductivity andand EfficiencyEfficiency-- CycleCycle TimeTime andand TimelinessTimeliness-- QualityQuality-- SecuritySecurity andand PrivacyPrivacy-- ManagementManagement andand InnovationInnovationToTo establishestablish anan OITOITPerformancePerformance Baseline,Baseline,wewe areare workingworking backwardsbackwardsfromfrom CustomerCustomer ogyTechnology-- FinancialFinancial-- QualityQuality-- EfficiencyEfficiency-- InformationInformation andand DataData-- ReliabilityandReliability and AvailabilityAvailability-- tsAssetsInputsSource: Federal Enterprise Architecture Program Management Office,Page 6 Model,” v 1.0,“Performance ReferenceSoftware Metrics, Inc.http://www.feapmo.gov/feaprm2.aspsmi
PSM Information CategoryInformationCategory ble Concept Technology SuitabilityTechnology VolatilityCustomer FeedbackCustomer SupportPage 7Prospective measures Requirements ChangeBaseline ChangesSatisfaction RatingsAward FeeRequests for SupportSupport TimesmiSoftware Metrics, Inc.
Considerations for a CustomerSatisfaction Survey -1Most literature on customer satisfaction surveys addresses the commercialcustomer Someone who buys your product or service and has the decisionauthority on what to buy and how much to spend. The intent is to understand how to retain and increase the number ofcustomers.Government End-User Agency has decision authority on where it receives its services. The intent is to understand how to better support the customers incarrying out their mission.Survey must have a purpose- Process improvement impact- Investigating a perceived need- Training effectiveness- Evaluating a product or servicePage 8smiSoftware Metrics, Inc.
Considerations for a CustomerSatisfaction Survey -2Make the survey as easy and clear as possible for the respondentKeep the respondent’s interest level and attention at a maximum Hot topics at the beginning of the survey Keep the questions short, simple and focused on one conceptat a time Demographics at the end Limit and target questions so survey takes only 10 to 15minutes Make the survey repeatable for annual updatesPage 9smiSoftware Metrics, Inc.
Customer Satisfaction SurveyQuestionsProductsProductsUseProductProduct AttributeAttributeCandidatesCandidates AvailabilityAvailability ResponseResponse timetime AccuracyAccuracy (missing(missing oror badbaddata)data) EaseEase ofof UseUse AbilityAbility toto submitsubmitrecommendationsrecommendations forforimprovementsimprovements FrequencyFrequency ofof productproduct useuse FeaturesFeatures DesignDesign // aestheticsaesthetics ProblemsProblems withwith thethe r)ExperienceAskAsk questionsquestions aboutabout LevelLevel ofof satisfactionsatisfaction PerceptionPerception ofof changechange AttributeAttribute expectationexpectation LevelLevel ofof attributeattributeimportanceimportance KnowledgeKnowledge ofof productproduct ororserviceservice ImpactImpact onon missionmissionofof thethe productproduct oror serviceserviceattributeattributePage 10UseServicesServicesServiceService AttributeAttributeCandidatesCandidates AvailabilityAvailability ofof thethe serviceservice TurnaroundtimeTurnaround time AbilityAbility toto ecommendations KnowledgeKnowledge levellevel ofofserviceresponderservice responder FrequencyFrequency ofof problemsproblems AccuracyAccuracy ofof thethe serviceservice DeliveryDelivery OverallOverall serviceservice qualityquality ComplaintResolutionComplaint Resolution ComplaintComplaint HandlingHandlingsmiSoftware Metrics, Inc.
Types of Satisfaction Questions -1Level of satisfaction with an attribute Scale can go from Highly Dissatisfied to Highly SatisfiedPerception of change in an attribute Scale can go from Much Worse to Much BetterAttribute expectation Ask for a specific expectation: “How long”, “How much”,“Acceptable amount” Provides basis for setting target valuesPage 11smiSoftware Metrics, Inc.
Types of Satisfaction Questions -2Level of attribute importance Scale can go from “Not Important” to “Very Important”Knowledge of product or service Ask how long they have been using the product or serviceImpact on mission Ask what happens when they cannot get the product or service If a system is down for an hour, does that mean 5,000 peoplecross the border unchecked?Page 12smiSoftware Metrics, Inc.
Demographics are Important!Examples of demographics- Location- Gender- Experience level- Job Position- Years employed- Job DescriptionProvide means for viewing data from different groups within thesampleHelps to understand “Non-Response” error Compare demographic with known population distributionPage 13smiSoftware Metrics, Inc.
Role of DemographicsFor a population of 10,000 CBP users, we need about 450 to 575responses for statistically meaningful analysis and conclusionsSurvey will be sent to all Customs and Border Protection front-lineusersWe will use demographic information to verify that responses wererepresentative of larger population alternative would be random sampling with mandatoryrequirement to fill out survey this is difficult to enforcePage 14smiSoftware Metrics, Inc.
Steps in Creating an OIT Survey1. Identify the Customers2. Identify the Products and Services3. Identify Customer-Related Issues with the products andservices Visited two field locations (airport and seaport) Investigated internal sources (help desk calls, discussionswithin each OIT division)4. Create questions5. Review questions within the business organization Five divisions covered (hardware infrastructure, softwareapplications, laboratory testing, radios, field equipment)Page 15smiSoftware Metrics, Inc.
Measurement Scales Nominal: categorizing points on the scale, no ordering implied Examples: demographic data (gender, location), Yes/No responses Ordinal: points on the scale are ordered Example: quality of service is “worse”, “no change”, “better” Interval: equal space or intervals between points on the scale Examples: responses indicating a numerical quantity - “How longcan you wait for system to repond?” Likert scale where end points are labeled and intervals are implied Allen & Tanniru* argued that people cognitively create an interval scale Ratio: equal intervals plus a meaningful zero point Example: number of problem reportsSource: “Analysis of Customer Satisfaction Data” by Derek Allen and Tanniru R. Rao,American Society for Quality (ASQ) Press, 2000Page 16smiSoftware Metrics, Inc.
Measurement ScalesType of analysis is determined by measurement scales Nominal and ordinal Frequency tabulations (bar charts) Interval and ratio Frequency tabulations Correlation, linear regressionSource: “Analysis of Customer Satisfaction Data” by Derek Allen and Tanniru R. Rao,American Society for Quality (ASQ) Press, 2000Page 17smiSoftware Metrics, Inc.
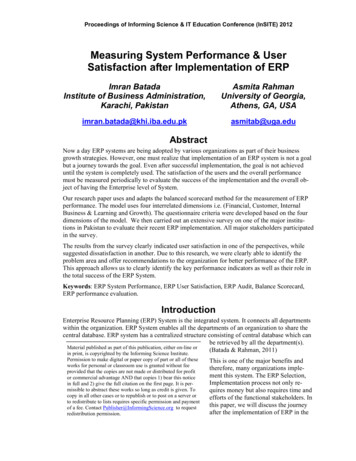
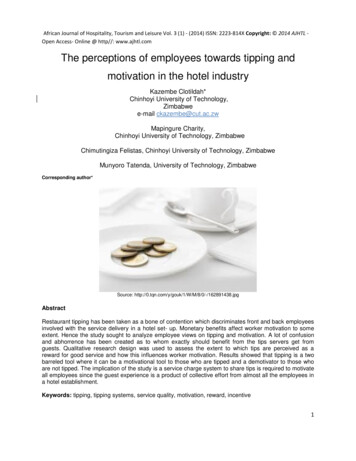
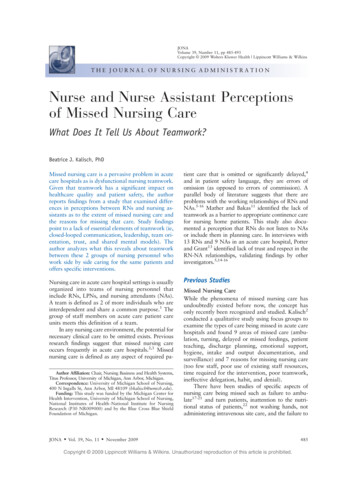
Example Survey Question 1a – Ordinal ScaleSatisfiedVeSa r ytisfiedVD eryissatisfiedDissatisfiedNeutralWe would like to ask you about your satisfaction with the AutomatedTargeting System application. Please tell us how satisfied you are by usingthe scale shown below. How satisfied are you with the application in termsof Availability1 2 3 4 5 Response Time1 2 3 4 5 Data Accuracy1 2 3 4 5 Ease of Use1 2 3 4 5 Ability to submitimprovements1 2 3 4 5 Page 18smiSoftware Metrics, Inc.
Example Survey Question 1b – Interval ScaleWe would like to ask you about your satisfaction with the AutomatedTargeting System application. Please tell us how satisfied you are by usinga seven-point scale where 1 means you are completely and totallydissatisfied and 7 means you are completely and totally satisfied.Using the seven points on this scale, how satisfied are you with theapplication in terms of ity1 2 3 4 5 6 7 Response Time1 2 3 4 5 6 7 Data Accuracy1 2 3 4 5 6 7 Ease of Use1 2 3 4 5 6 7 Ability to submitimprovements1 2 3 4 5 6 7 Page 19smiSoftware Metrics, Inc.
Example Survey Question -2When you don’t have the use of this application, what impact does thishave on your mission?1. Can still get what I need 2. Wait until application is available 3. Work-around available using other applications 4. Work has to be transferred to another location 5. Use manual methods to get work done If the mission is compromised, please describe this impact (e.g., cargo isnot screened as quickly or as throughly)Page 20smiSoftware Metrics, Inc.
Example Survey Question -3Overall, considering all of these characteristics, how satisfied are you withthe Advance Targeting System application. Again, please use the sevenpoint scale where 1 means you are totally and completely dissatisfiedand and 7 means you are totally and completely d1 2 3 4 5 6 7 Please provide us additional comments on this application:Page 21smiSoftware Metrics, Inc.
Example Survey Analysis -1Suppose we administered a product satisfaction survey and we get 9responses back. What can we learn from the responses?SurveyResponse 766Accuracy776771757Ease of on664715773For a population of 10,000 CBP users, we need about 450 to 575responses for statistically meaningful analysis and conclusionsPage 22smiSoftware Metrics, Inc.
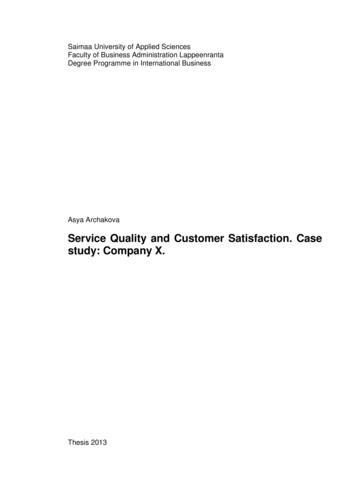
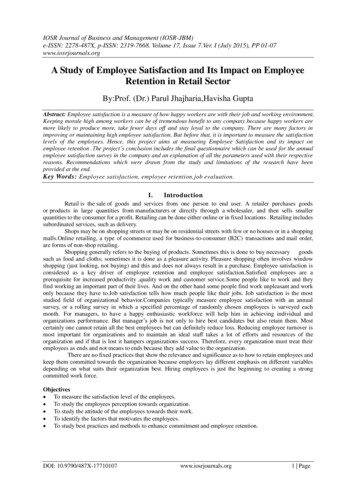
Analysis Example -2AvailabilityResponse Time12 3 4 5 6Response Scale65432107123 4 56Response Scale17723 4 5 6Response Scale7Overall ponse ScaleImprovementsFrequencyFrequencyEase of ncyFrequency analysis: treating the responses as an ordinal scale123 4 5 6Response ScalePage 237123 4 5 6Response Scalesmi7Software Metrics, Inc.
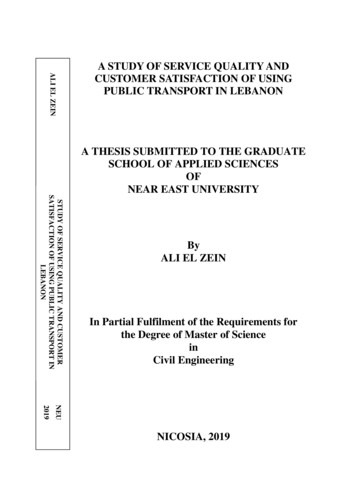
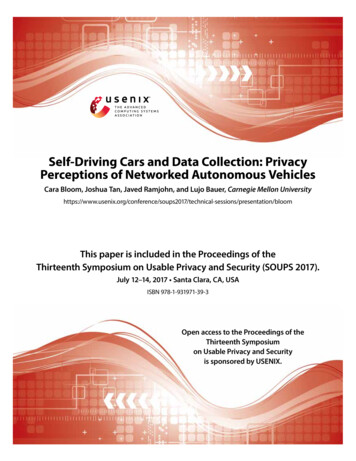
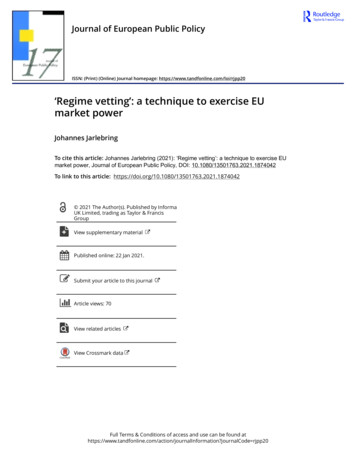
Analysis Example -3Vulnerability analysis: treating the responses as an ordinalscale, you can look for risks to accomplishing the mission.7Overall Satisfaction6“Happy” QuadrantLower PriorityQuadrant543Lower PriorityQuadrant2Risk Quadrant100123456Impact on Ability to Perform MissionPage 24smiSoftware Metrics, Inc.
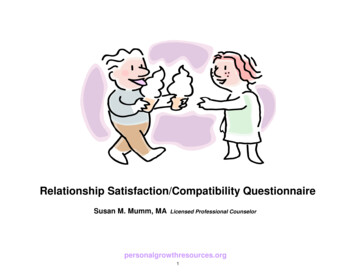
Analysis Example -4Correlation analysis: treating the responses as an interval scaleProduct AttirbutesAvailabilityResponse TimeAccuracyEase of UseImprovementsOverall ponseTime10.720.550.900.51AccuracyEase 10.550.2910.311Analysis Questions For this product, how can availability be increased? What internal data exists to collaborate the availabilityproduct attribute (from a call center, problem reports,etc.)? Are there other products or infrastructure services thatimpact this product's availability (e.g. other databases,network availability, etc.)?Page 25smiSoftware Metrics, Inc.
Analysis Example ConclusionType of measurement scale determines the possible analysisDecide which analysis techniques will be used on the dataConstruct questions using appropriate scales to support theanalysisThe analysis must correlate attributes against the overall results tohelp define follow-up actionsPage 26smiSoftware Metrics, Inc.
ConclusionsCustomer satisfaction surveys can be an important measurementinstrumentWe are using surveys to identify relevant organizationalperformance measures based on survey results What product and service characteristics are important inaccomplishing CBP mission (availability, data accuracy,response time )? Understanding the impact resulting from problems with aproduct or service will focus OIT on the appropriate prioritiesAsk questions that point to specific improvement actions (not just a“feel good” survey)Page 27smiSoftware Metrics, Inc.
Further Reading“Listening to the Voice of the Customer” by Jon Anton and DebraPerkins, Alexander Communication Group, 1997“Customer Satisfaction Tools, Techniques, and Formulas forSuccess” by Craig Cochran, Paton Press, 2003“Analysis of Customer Satisfaction Data” by Derek Allen andTanniru R. Rao, American Society for Quality (ASQ) Press, 2000Page 28smiSoftware Metrics, Inc.
Craig Beyers, SETACraig.Beyers@associates.dhs.gov(703) 286-4009Betsy Clark, SMIBetsy@software-metrics.comBrad Clark, SMIBrad@software-metrics.com(703) 754-0115Page 29smiSoftware Metrics, Inc.
Page 21 smi Software Metrics, Inc. Example Survey Question -3 Overall, considering all of these characteristics, how satisfiedare you with the Advance Targeting System application. Again, please use the seven-point scale where 1means you are totally and completely dissatisfied and and 7me