Transcription
Empowering the Masses with AnalyticsTHE GAP FORBUSINESS USERSFor a discussion of bridging thegap from the perspective of abusiness user, read Three Waysto Use Data Science.Ask the average business user what they know about Business Intelligence (BI)and data analytics, and most will claim to understand the concepts. Few, however,will profess to know how analytics works or to have the skills needed to put itinto practice. Despite being knowledgeable about their industry and experiencedin running their organizations, the majority of business users lack expertise inanalytics and visualization techniques—but that doesn’t stop them from wantingto have a go.This situation has led to ease of use and accessibility becoming the main focusfor recent updates from all the leading BI vendors—but making tools easier andmore widely accessible is only part of the answer.A better approach is to work both sides of the gap. To make tools that canempower business users to discover and unlock value in their data—and thatextend capabilities for experts, so they can share the analytics workload, improveefficiency, and focus on higher level work.Unfortunately, the products available from most data analytics vendors tend tofall short of this two-sided goal, concentrating purely on running analytic modelsand visualizing results. TIBCO Spotfire , by contrast, bridges the data scienceskills gap and enables organizations of any size to take full advantage of all theiranalytic resources. Here’s how.RECOMMENDATIONSRecommendations, a built-in analytics intelligence wizard enables anyone—withor without real expertise—to create best practice visualizations, or even entiredashboards, in just a few clicks.We don’t claim that Spotfire Recommendations can do everything. You stillhave to connect Spotfire applications to the data to be analyzed. It cannot buildcomplex predictive models; However, by leveraging best practices about whatcharts to use for different types of data, when to use aggregations, how to usetime series correctly, and so on, Recommendations helps even a novice userchoose how best to visualize the results of a data analysis.
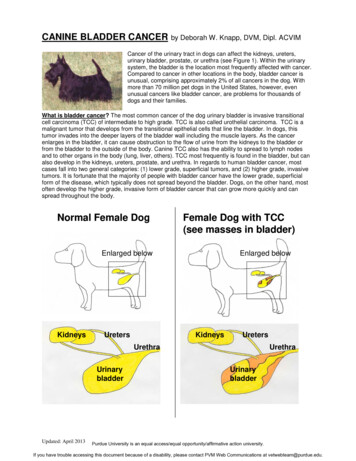
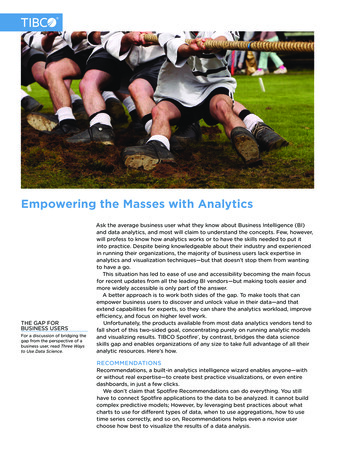
WHITEPAPER 2Figure 1 Recommendations 1: After loading US Department of Housing and UrbanDevelopment data on the homeless population, clicking on the Recommendedvisualizations icon, and selecting “homeless” and “state” in the data panel (left side),Spotfire returns the visualizations above, any of which can be saved to a canvas.Selecting other options in the data panel provides additional visualizations.The Recommendations engine will automatically and continually profile the dataand metadata held in analysis files. The distinct count of values in each column,data types, range of values, potentially hierarchical relationships among columns,along with numerous other characteristics are continuously surveyed and logged.Then, when a user clicks the associated Recommendations icon, that data profile,together with their chosen selections, is used to present a gallery of potentiallyuseful visualizations that can be selected by the user.Although there are no guarantees of game-changing insights in the first plot orin any of the suggested visualizations, business users will see a gallery of bestpractice charts, among which is likely to be something they find of value.
WHITEPAPER 3Because the visualizations fully render the actual data, users will be browsing forinsights instead of clicking or dragging to configure plots before seeing what theyproduce. As the user chooses from the suggestions, Spotfire builds a completedashboard of linked, configurable graphics with supporting filters and controls todiscover and explore the data source in more detail.These capabilities can have significant and far-reaching implications. Fornovice business users, Spotfire Recommendations reduces the need to study themechanical aspects of building a visualization. Instead it empowers them to takeownership of at least part of the data analytics workflow, which in turn frees upanalytics specialists to concentrate on more complex tasks.Of course, Recommendations can also be used by analysts and data scientiststo fill gaps in their knowledge and expertise, while dramatically accelerating thecreation of more fully featured data dashboards and applications for users lackingthe time or inclination to do it themselves.PREDICTIVE MODELINGAnother key strength and advantage over less capable BI products is the abilityto use Spotfire to extrapolate from an insight and develop new strategies usingpredictive modeling. These techniques can improve decision-making using theorganization’s collective experience. For example: Identifying what customers are most likely to buy based on previouspurchasing history Customizing train timetables to better suit passenger needs based on journeylength, carriage capacity, time of dayPredictive analytics can help business users: Increase confidence and effectiveness in decision-making through discovery ofmeaningful patterns and important data Anticipate and react to emerging trends Reduce or manage risk through scenario planning, forecasts, and fraud detection Forecast behavior and pre-emptively act upon it to, for example, increaseupsell rates or decrease churn
WHITEPAPER 4Spotfire predictive analytics tools are implemented in three ways:1 TIBCO Enterprise Runtime for R (TERR), a production-class environment forrunning R scripts and packages, combining the agility of open source R withthe speed and reliability of an enterprise platform2 TIBCO Spotfire Statistics Services, a predictive analytics ecosystem for theseamless integration of legacy analytic investments with Spotfire applications3 Visual modeling tools, functionality that delivers deep predictive insightswithout the need for statistical programming1 THE R CONNECTIONWhile R is used extensively to prototype and test analytical models, forproduction, developers will typically re-implement the models in anotherlanguage or commercial analytics platform. This rework is necessary primarilybecause, with limitations in performance and scalability, R was never really builtfor business-critical environments.There are no tools to help with R coding in Spotfire, but it includes TERR, arobust and commercially-supported, enterprise-class environment for runninganalytic models written in R, enabling those models to move from prototyping toproduction without the need to rewrite or port code.TERR lets you: Exploit existing expertise in R Leverage existing R scripts and applications without the need for re-coding Eliminate time and resources spent re-implementing R code for production,or time spent prototyping on an unwieldy platform Rapidly cycle from prototyping to production to deliver faster time to insightand faster time to market Execute R scripts and applications and enable the results to surface in thevisually rich Spotfire environment Apply consistent models across multiple applications and uses, eliminatinguncertainty when analytic models on different platforms disagree Continually refine models and provide their consistent application soeveryone is always using the best analyticsTechnical benefits include: Delivery of higher performing memory management, enabling linear scalabilityas larger data sets are analyzed A provision for licensing, embedding, and redistributing A platform suitable for ongoing investment to ensure analytic needs can bemet both now and into the futureTERR is widely integrated across TIBCO technologies, and it is the engine forSpotfire predictive modeling tools. It can be embedded in Spotfire applicationsand called upon locally or accessed remotely through TIBCO Spotfire StatisticsServices, described next.
WHITEPAPER 52 STATISTICS AS A SERVICETIBCO Spotfire Statistics Services can create a repository of reusable predictiveanalytic functions that users can apply without the need for in-depth expertisein statistics. The process starts with data scientists skilled in this area developinganalytics using industry standard languages and platforms, including R, SAS, andMATLAB. They can then upload the code to Spotfire Statistics Services, making itmore generally available to other Spotfire application developers and analysts.Then, without the need for any coding or deep understanding of the details ofthe functions involved, developers across the organization can quickly integratethe analytic into a Spotfire application and share it across a wide community ofusers. They can more easily visualize the results of their models and analyses anddeploy those models from the managed centralized Spotfire Statistics Services.Sample out-of-the-box predictive analytics are also included to help you getstarted, along with templates to suit a variety of applications.Spotfire Statistics Services also enables users to make use of Teradata Aster torun in-database predictive analytics on big data from Spotfire applications orTERR scripts.
WHITEPAPER 63 VISUAL MODELING TOOLSWith data scientists in short supply, there are plenty of companies who would like tobenefit from predictive analytics, but are unable to do so. To address this need andbridge the skills gap, Spotfire offers visual predictive modeling tools that providepredictive analytics without the need for in-depth statistical or coding skills.Far from a second-class option, these tools make use of the native SpotfireTERR engine to execute predictive models within a production environment.The tools also support a full workflow for real predictive modeling, enablingusers to create, evaluate, and iterate predictive models using powerful Spotfirevisualization technologies. Equally important, users can test models onexisting data, apply predictions to new data, and embed predictive models inapplications—all without any R coding or other analytics products.Spotfire predictive modeling tools—linear and logistic regression, classification,and regression trees—are standard in Spotfire. Using point-and-click, these toolsare designed for use by business users and enable workflows that improve theirproductivity without the involvement of data scientists.TAKING ACTIONOne final consideration is the ability to capitalize on insights generated using dataanalytics—to not just predict important trends and outcomes, but to socializefindings, collaborate, make decisions, and execute on them.As part of a portfolio of TIBCO Analytics products, Spotfire not only bridgesthe skills gap, it empowers organizations of any size to take action in real time.Learn more about Spotfire and the TIBCO Fast Data platform at www.tibco.com.Global Headquarters3307 Hillview AvenuePalo Alto, CA 94304 1 650-846-1000 TEL 1 800-420-8450 1 650-846-1005 FAXwww.tibco.comTIBCO Software empowers executives, developers, and business users with Fast Data solutions that make theright data available in real time for faster answers, better decisions, and smarter action. Over the past 15 years,thousands of businesses across the globe have relied on TIBCO technology to integrate their applications andecosystems, analyze their data, and create real-time solutions. Learn how TIBCO turns data—big or small—intodifferentiation at www.tibco.com. 2016, TIBCO Software Inc. All rights reserved. TIBCO and the TIBCO logo, and Spotfire are trademarks or registered trademarks of TIBCO Software Inc. or itssubsidiaries in the United States and/or other countries. All other product and company names and marks in this document are the property of their respectiveowners and mentioned for identification purposes only.01/25/16
Spotfire predictive analytics tools are implemented in three ways: 1 TIBCO Enterprise Runtime for R (TERR), a production-class environment for running R scripts and packages, combining the agility of open source R with the speed and reliability of an enterprise platform 2 TIBCO Spotfire Statistics Services,