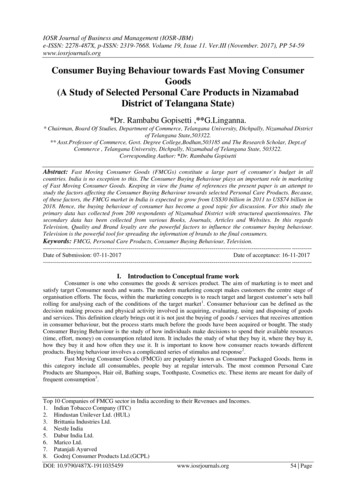
Transcription
CECL Impact Analysis for Consumer Lending PortfoliosDeniz Tudor, PhD, Director, Consumer Credit AnalyticsTim Daigle, Economist, Consumer Credit AnalyticsTimothy Daly, Senior Director, ModeratorMAY 2018
Moody’s Analytics CECL Solution Suite
PresentersDeniz TudorDirector, Consumer Credit AnalyticsDeniz Tudor is a Director with Moody’s Analytics. Deniz specializes in U.S. consumer credit trendsand leads the development of custom and industry-based econometric credit loss models for clients.Tim DaigleEconomist, Consumer Credit AnalyticsTim Daigle is an Economist specializing in the development of consumer creditmodels for stress-testing and CECL.ModeratorTimothy DalySenior Director, Business DevelopmentTim Daly is a Senior Director who manages the sales team for the Economics & Consumer Credit Analytics group atMoody’s Analytics. Tim is focused on helping institutions meet their regulatory, accounting and risk management needs.CECL Impact Analysis for Consumer Lending Portfolios3
Agenda1. CECL Introduction2. Solutions for CECL Challenges for Consumer Portfolios3. Case Studies: Industry Impact Analysis for Mortgage & Auto4. Bank/Credit Union Specific AnalysisCECL Impact Analysis for Consumer Lending Portfolios4
1CECL Introduction
CECL in aWhat’s it all about?» The CECL standard will change how firms estimate their allowance for loan and lease losses.» Replaces the current “incurred loss” standards–commonly known as FAS-5 and FAS-114.» Addresses “too little too late” loss provisioning that occurred during the financial crisis.» Applies to any entity issuing credit (banks, credit unions and holding companies).» CECL in effect starting December 15, 2019, for public business entities that are U.S. SEC filers.CECL Impact Analysis for Consumer Lending Portfolios6
Biggest Change: Forecasting Losses» CECL is a lifetime loss estimate.- Forecast losses over a reasonable and supportable horizon- Extrapolate beyond this horizon using historical averages over the remaining life» CECL standards are principles-based.- Not prescriptive in how institutions address specific modeling challenges- Flexibility to account for firms of different size and complexity» Require increased transparency in assumptions and more disclosures to support theallowance estimate.» Selection of forecasts and assumptions will need quantitative support.» Under CECL standard, we need to estimate and account for the potential losses from all loans.CECL Impact Analysis for Consumer Lending Portfolios7
How Will CECL Impact a Bank’s Loss Allowance?» Depends on a number of factors including- Portfolio composition (longer-dated loans impacted more)- Credit quality- Geography- Scenario assumptions- Stage of economic cycle» As an exercise, consider using industry performance forecasts- Use residential mortgage and auto vintage performance to calculate lifetime lossperformance for CECL- Caution: Lender-specific results will vary!CECL Impact Analysis for Consumer Lending Portfolios8
Provision Expenses Front-Load With CECLProvision for loan and lease losses at commercial banks, bil250Would provisionshave changedbehavior?200150100ActualCECL estimate500050607080910CECL Impact Analysis for Consumer Lending Portfolios119
2Solutions for Solving CECLChallenges
Solutions for Consumer Credit PortfoliosCreditForecast.comIndustry performance forecasts based on Equifax Consumer Credit data» Leverages extensive historical data covering most recent business cycle and all segments of consumercredit asset classes (First Mortgage, Home Equity, Auto, Student, etc.)» Aggregated cohort data on 220 million consumer records each month Segmentations include Risk Score, Origination Date, Geography, Loan term cohortsExpected Consumer Credit Losses (ECCL) ServiceECCL provides industry forecasts of Expected Credit Loss (ECL) under reasonable and supportablemacroeconomic scenarios» Computes lifetime ECL values for user inputted portfolio footprint» Easy to use interface for sensitivity analysis (for both CECL and DFAST)CECL Impact Analysis for Consumer Lending Portfolios11
Solution: CreditForecast.comExclusive forecasts of household finances based on data from Equifax» Joint product offering from Equifax and Moody’s Analytics combining credit and economic data» Monthly updated historical/quarterly updated forecast consumer credit data» Detailed analysis/research covering each product line published quarterly VolumeActive StatusesFinal Dispositions(# and )(# and )(# and )Total outstanding volumeNew OriginationsHigh credit/Utilization rateScheduled monthly paymentsTrades with 0 balance (forrevolving accounts)Mutually exclusive non-terminalstatus buckets: Current 30-59 DPD 60-89 DPD 90-119 DPD 120 DPD Foreclosure StartedMutually exclusive terminalstatuses: Default Bankruptcy Closed positive (Prepayment)CECL Impact Analysis for Consumer Lending Portfolios12
CreditForecast.comProbability of Default (PD) Model Methodology» Cohort/Vintage Pooled time seriesBankcard Default Rate, % of Outstanding Balance» Fractional logit models of default rates1.0» Primary Model Drivers– Life Cycle/Maturation Component– Vintage Quality VariablesHistoryBaselineAdverseSeverely Adverse0.80.6– Time-Varying Macro Conditions– Seasonality Dummies– Delinquency Roll Rates/Daisy Chain– Segment Macro factor interactions0.40.20608101214161820CECL Impact Analysis for Consumer Lending Portfolios13
CreditForecast.com Models Consider Future ConditionsInclude both national and regional forecast economic factors:Unemployment rate, %» Economic PerformanceGDP Growth, Disposable Income Growth10» Labor MarketsUnemployment, Job/Wage/Salary GrowthBaselineS1S3S5S78» DemographicsPopulation, Number of Households, Migrations etc.6» Real Estate MarketsHome Prices, Home Sales, Housing Starts, Permits4ConsensusS2S4S6S8» Financial MarketsFederal Reserve Interest Rates, Equity Mark Indexes206101418222630343842CECL Impact Analysis for Consumer Lending Portfolios4614
CECL Loss Forecasting MethodsMoody’s Analytics supports all acceptable CECL methodologiesPrimary Methodologies» Loss rate method (Pool/cohort/vintage, loan level analysis)» Probability of default method (PD & LGD) (Pool/cohort/vintage, loan level analysis)» Discounted cash flow analysis (loan level analysis)» Roll rate method (Migration analysis/Transition Matrices) (loan level analysis)CECL Impact Analysis for Consumer Lending Portfolios15
Solution: Expected Consumer Credit Losses (ECCL)Industry forecasts of Expected Credit Loss under reasonable and supportable scenariosInput Requirements» Product Category» Exposure Footprint– Geography Origination Date Origination Risk Score Cohorts» Key Inputs– Expected Lifetime– Loss Given Default– Scenario/Probability Weighted Scenarios– Discount RateCECL Impact Analysis for Consumer Lending Portfolios16
Solution: Expected Consumer Credit Losses (ECCL)Industry forecasts of Expected Credit Loss under reasonable and supportable scenariosOutputSummary of ECL projections at the most granular level as well as aggregated segments based oninput assumptions and client footprintECL Rate: Orig. Risk Score graphyCACACACACACACACACACACACACARisk age Assumed Lifetime Assumed End Date LGDExposureECLECL Rate2017q348 2021m70.201,559,84965,7374.2142017q448 2021m100.202,409,886101,6924.2202017q348 2021m70.206,915,574209,0113.0222017q448 2021m100.208,245,182261,3043.1692017q348 2021m70.2015,128,379306,7102.0272017q448 2021m100.2020,417,682452,6702.2172017q348 2021m70.2035,368,369484,2391.3692017q448 2021m100.2042,802,164 1,000,6962.3382017q348 2021m70.2053,904,068400,0000.7422017q448 2021m100.2066,136,162446,5490.6752017q348 2021m70.2029,104,995114,8480.3952017q448 2021m100.2036,248,520154,3930.4262017q348 2021m70.2036,503,509141,3630.387CECL Impact Analysis for Consumer Lending Portfolios17
3An Industry Impact Analysisfor First Mortgages and Autos
What We Hear From StakeholdersKey concerns from the marketWhat will be the impact of CECL?» Quantification of forward looking economic risks may be difficult for both institutions and regulators» What if CECL goes into effect during a recession?» What if CECL had been in effect during the last recession?Our results show that reserves might have to increase significantly!CECL Impact Analysis for Consumer Lending Portfolios19
Estimating the Impact of CECL: MortgagesOur Research» We use Moody’s Analytics Expected Consumer Credit Loss service to estimateExpected Credit Loss rates under forward-looking economic scenarios Based on consumer credit report data from CreditForecast.com Covers performance data from across lenders 8.4 trillion in First Mortgage loans as of August 2017» We use Moody’s Analytics consensus, stress and probability-weighted scenarios» We assume a 40% loss given default rate Based on RMBS securities data, Fannie Mae/Freddie Mac data and bank call reports» We assume the life of First Mortgages do not exceed 15 years 99% of loans are terminated within 180 months» We assume 4.3% per annum discount rate Based on 30-year mortgage rate, from MBA, Weekly Mortgage Applications Survey: 50%/75%CECL Impact Analysis for Consumer Lending Portfolios20
Reserve Estimates for First MortgagesResults» Based on incurred loss method, we calculate ALL reserves to be about 41 billion Reported Fannie/Freddie portion of this is 28.8 billion on 4.8 trillion loans» Based on CECL methodology, we calculate required reserves to be about 80 billionwith an ECL rate of 0.97% under a consensus scenario This makes up to a 100% increase in reserves due to CECL (just for First Mortgages) Impact of switching scenarios: Reserves under stress scenario estimated at 155 billion with 1.87% ECL rate Reserves under probability weighted scenario estimated at 92 billion with 1.11% ECL rate» Segment analysis shows highest ECL rates in Less than 660 score bands. Largest ECL in 620-699 band MD, VA, IL, NJ, FL with biggest ECL in CA, FL, TXCECL Impact Analysis for Consumer Lending Portfolios21
Impact of Inputs on ResultsResults should be taken with caution at institution levelEach financial institution will have its own expected lifetime and loss given default rate as wellas loan quality» Results can also change based on Where in the business cycle the line of business is Discount rates: If no discount, impact would be larger, 95 billion Current incurred loss method: (look-back period): If incurred loss higher, impact would be smaller Current conditions at time of CECL Loss given default under different scenariosCECL Impact Analysis for Consumer Lending Portfolios22
Sensitivity of Results to iscount rate81215LifetimeCECL Impact Analysis for Consumer Lending Portfolios23
CECL Numbers in the Past and FutureWhat if we calculated the numbers during last recession or as of date CECL will go into effect?CECL as of Different Dates50040030020010002007m122017m72020m1CECL Impact Analysis for Consumer Lending Portfolios24
Estimating the Impact of CECL: AutosOur Research» We use Moody’s Analytics Expected Consumer Credit Loss product to estimate Expected Credit Lossrates under forward-looking economic scenarios Based on consumer credit report data from CreditForecast.com Covers performance data from across lenders 495 billion in Auto finance loans as of Jan 2018 601 billion in Auto bank loans as of Jan 2018» We use Moody’s Analytics consensus, stress and probability-weighted scenarios» We assume a 46% loss given default rate based on Auto Portfolio Analyzer data» We assume the life of Autos does not exceed 5 years» We assume 4.81% per annum discount rate for auto bank loans and 4.64% for auto finance loans FRB Bank New Car Loans Rate and FRB Finance Co. New Car Loans RateCECL Impact Analysis for Consumer Lending Portfolios25
Reserve Estimates for AutosResultsBased on CECL methodology, we calculate required reserves to be about 7.5 billionwith an ECL rate of 1.25% under a consensus scenario for Auto Bank Loans» Impact of switching scenarios: Reserves under stress scenario estimated at 13 billion with 2.17% ECL rate Reserves under probability weighted scenario estimated at 8.4 billion with 1.40% ECL rateBased on CECL methodology, we calculate required reserves to be about 17.5 billionwith an ECL rate of 3.53% under a consensus scenario for Auto Finance Loans» Impact of switching scenarios: Reserves under stress scenario estimated at 23.7 billion with 4.8% ECL rate Reserves under probability weighted scenario estimated at 18.5 billion with 3.73% ECL rateCECL Impact Analysis for Consumer Lending Portfolios26
Reserve Estimates for AutosAuto Bank ECL Rates ResultsAuto Finance ECL Rates ResultsSegment analysis shows, for Auto BankLoans, highest ECL rates in Segment analysis shows, for Auto FinanceLoans, highest ECL rates in » 300-529 score bands. Largest ECL in740-779, 660-699 band» 300-529 score bands. Largest ECL in 620699 band» GA with biggest ECL in TX and CA» GA with biggest ECL in TX and 2.0%1.5%0.4%1.0%0.2%0.5%0.0%0.0%CAFLGAILNCNYOH Other PATXWACAFLGAILNCNYOHOtherPATXCECL Impact Analysis for Consumer Lending PortfoliosVA27
Summary: ECCL Provides Easy Look Up Tables for CECLECCL Data Dimensions – Client’s FootprintGeographyOrigination VintageRisk ScoreClientinputMoody’sAnalytics inputLoan TermECL RateLGD RateDerivedExposureECLCA2016Q3Orig. Score: 740-779360 0.0500.048 60,532,444 30,420CA2016Q4Orig. Score: 740-779360 0.0550.048 56,251,104 30,934CA2017Q1Orig. Score: 740-779360 0.0610.048 35,829,712 21,910CA2017Q2Orig. Score: 740-779360 0.0560.048 49,811,888 27,997CA2017Q3Orig. Score: 740-779360 0.0630.048 41,669,548 26,381CA2009Q4Orig. Score: 780-809 1800.0080.048 4,727 0CA2010Q4Orig. Score: 780-809 1800.0050.048 6,377 0CA2016Q1Orig. Score: 780-809 1800.0090.048 334,918 30CA2016Q3Orig. Score: 780-809 1800.0120.048 293,081 35CA2016Q4Orig. Score: 780-809 1800.0130.04898 0CA2007Q4Orig. Score: 780-809180-3590.0690.048 214,632 148CA2008Q2Orig. Score: 780-809180-3590.0390.048 864,379 337CA2008Q3Orig. Score: 780-809180-3590.0330.048 15,083 5 CECL Impact Analysis for Consumer Lending Portfolios28
4Bank and Credit UnionSpecific Loss Estimates
Calculating Bank and Credit Union Specific Losses» Small institutions: Loss rate approach: Use forecasts at portfolio level– Use Moody’s Analytics Call Report or Credit Union Forecasts– Simple, forward-looking, allows for comparison with peers– Needs assumptions such as homogeneous portfolio and remaining lifetime» Medium size institutions: PD & LGD approach with anchoring– Calibrate more granular ECCL data to institution specific data from Call Report or Credit Union Forecasts– Useful when there’s no data archived by institution– ECCL provides vintage component; Call Report or Credit Union Forecasts allow calibration to specificbank/credit union» Medium to large size institutions: PD & LGD approach with model access– Use Moody’s Credit Cycle (Standard) to run client’s data– Allows custom calibration if institution has data with more dimensions, e.g. score bands, etc.– Access to models through online platform with audit trail, etc.CECL Impact Analysis for Consumer Lending Portfolios30
Loss Forecasting Based on Industry and Institutional TrendsConditional loss rate, % of balance, annualized9HistoryForecast876Industry543Forecast for Credit Union/Bank AIndustry Forecast from ECCLECCL Forecast Calibrated for Credit Union/Bank APortfolio21415161718Source: Moody’s AnalyticsCECL Impact Analysis for Consumer Lending Portfolios31
Moody’s Analytics Consumer Credit SolutionsMortgage/Auto Portfolio Analyzeror Moody’s CreditCycle CustomMoody’s Credit Cycle» Custom modeling solution» Off-the-shelf modeling solution» Client data» Based on CF.com models(and data)» Portfolio, vintage/cohort, loan levelmodels» Flexible segmentation and driveroptions» Integration to other MA solutions» Online or desktop platforms» Best when client data covers at leastone business cycle and is good quality» Predeterminedsegments/cohortsExpected Credit LossService (ECCL)CreditForecast.com» Data augmentation (PD &LGD)» Data augmentation» Based on CF.com data andmodels» (more than just PD)» Based on Equifax data» Cohort level data: Vintage, geo, scoreband, term» Calibration option» Predeterminedsegments/cohorts» Term structure» Client footprint adjusted results» Quarterly updated forecasts with up to9 scenarios» Integration to other MAsolutions» Integration to other MAsolutions» Different views/cuts of credit bureau econ data» Online platform» Online interface» Multiple delivery options including DB» Best when client data is shortor multiple M&As or asbenchmark» Best when client has nodata/model or small portfolio oras benchmark» Integration to other MA solutionsCECL Impact Analysis for Consumer Lending Portfolios32
Q&AAdditional questions?Send an email to help@economy.com or contact:Timothy DalySenior g Events» July 17, 2018 Webinar: CECL Custom Modelling Applications» Aug 15, 2018 Webinar: U.S. Consumer Credit Outlook» Oct 16, 2018 Webinar: CECL Off the Shelf Modelling ApplicationsCECL Impact Analysis for Consumer Lending Portfolios33
5Appendix
CreditForecast.com covers all consumer credit eEquityRetailStudentLoanOther Bank Loans Leases Finance Loans LeasesConsumerFinance Installment RevolvingHomeEquity Installment RevolvingStudentLoans In deferment Not in deferment35
CreditForecast.com Vintage SegmentationLoans grouped into origination date cohorts to track performanceover maturation cyclePre-1990 and 1990-1995 aggregate vintagesAnnual vintages:Loans grouped together by year of origination (1996 to 2004)Quarterly vintages:Loans grouped together by quarter of origination (2005Q1 and onward)36
CreditForecast.com Credit Score Segmentation11 Score Bands based on Vantage Score 19720-739740-779780-809810-85037
CreditForecast.com Term SegmentationInstallment Product Category Loan Term Cohort SegmentationProduct CategoryDescriptionProduct Category 24 monthsAuto Lease25-39 monthsStudent Loan 180 monthsFirst Mortgage180-359 months40 months360 months 24 months 120 months25-39 monthsAuto LoanDescription40-63 monthsHome Equity Loan120-179 months180-359 months64-75 months360 months76 months 6 months 120 months7-12 months120 monthsConsumer Finance Installment13-24 monthsRevolvingAll Loans25-59 monthsTotalAll Loans60 monthsCECL Impact Analysis for Consumer Lending Portfolios38
Moody’s Analytics ScenariosReasonable and supportable forecasts from Moody’s AnalyticsKey Features» Baseline forecast eight alternative scenarios with probability weights» Available for the U.S., all state and metro areas, as well as 60 countries» Coverage of more than 1,800 economic, financial and demographic variables» Forecasts updated monthly, history updated in real-time, 30-year horizon» Fully documented model methodology; scenario assumptions published monthly» Back-testing, tracking and model validation reports availableCECL Impact Analysis for Consumer Lending Portfolios39
Consensus ScenarioThis scenario is designed to incorporate the central tendency of a range of baselineforecasts produced by various institutions and professional economists.» The probability that the economy will perform better than this consensus is equal to theprobability that it will perform worse.» The consensus scenario is based on a review of publicly available baseline forecasts ofthe U.S. economy. These sources include:– Congressional Budget O
May 16, 2018 · and leads the development of custom and industry-based econometric credit loss models for clients. . Tim Daly is a Senior Director who manages the sales team for the Economics & Consumer Credit Analytics group at Moody’s Analytics. Tim is focused on helping institutions mee