Transcription
W. P. Carey Inc.Investor Presentation1Q21Investing for the long run
Investing for the long run Table of Contents1. Overview2. Real Estate Portfolio3. Balance Sheet4. Investment Management5. COVID-19 UpdateUnless otherwise noted, all data in this presentation is as of March 31, 2021. Amounts may not sum to totals due to rounding.
1. Overview
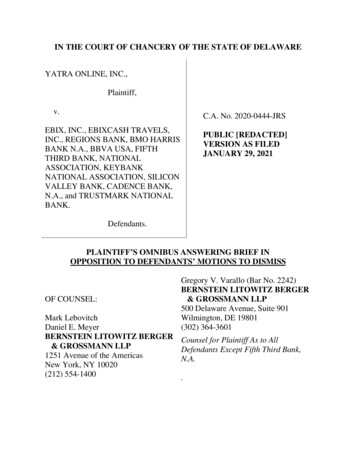
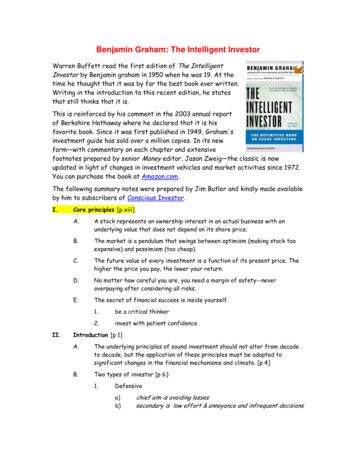
Company HighlightsW. P. Carey (NYSE: WPC) is a REIT that specializes in investing in net lease commercial real estate,primarily in the U.S. and Northern and Western EuropeOne of the largest owners of net lease assetsand among the top 25 REITs in the MSCI US REIT IndexHighly diversified portfolio by geography, tenant, property typeand tenant industrySuccessful track record of investing and operating throughmultiple economic cycles since 1973 led by an experiencedmanagement teamOrgill Warehouse Inwood, WVU.S. and Europe-based asset management teamsInvestment grade balance sheet with access to multipleforms of capitalExecuted on our strategy to become a pure-play net lease REIT,advanced through our 2018 merger with CPA:17 and 2020internalization of the CWI REITs, with earnings currently generatedalmost entirely from higher-quality real estate revenuesInvesting for the Long Run 4Turkey Hill Industrial Conestoga, PA
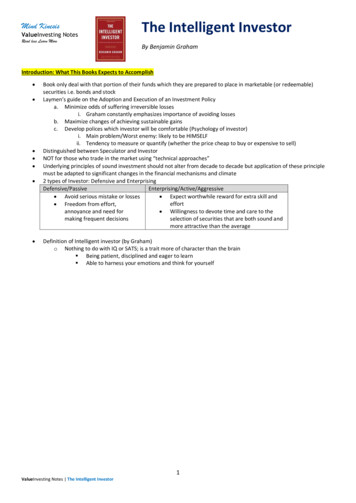
Business Model and Structure (1)W. P. Carey is the largest diversified net lease REITPublic REIT (NYSE: WPC) 19 billion of Enterprise Value (2)Real Estate Portfolio (3)1,261 net lease properties / 146 million sq. ft. / 10.6 year WALT / 1.2 billionof ABR Primarily industrial, warehouse, office, retail and self-storage(net lease)Advisor to 2.9 billion of AUMCorporate Property Associates 18 –Global (CPA:18) – Diversified / Net lease 351 tenants; top 10 tenants represent 21.5% of ABR Properties located primarily in U.S. and Europe 98.3% occupancy 99% of leases have contractual rent increases, including 61%linked to CPI(1)(2)(3)Carey European Student Housing Fund(CESH) Student HousingData as of or for the quarter ended March 31, 2021 unless otherwise noted.Enterprise value represents equity market capitalization based on a stock price of 70.76 as of March 31, 2021, plus pro rata debt outstanding, less consolidated cash and cash equivalents.Portfolio information reflects pro rata ownership of real estate assets, excluding operating properties. “WALT” represents we ighted average lease term and “ABR” represents pro rata contractualminimum annualized base rent (see definitions in Disclosures).Investing for the Long Run 5
Investment Strategy Generate attractive risk-adjusted returns byidentifying and investing in net-lease commercialreal estate, primarily in the U.S. and Northern &Western Europe Protect downside by combining credit and realestate underwriting with sophisticated structuringand direct originationTransactions Evaluated on Four Key Factors Industry drivers and trendsCreditworthinessof Tenant Company history Financial wherewithal Key distribution facility or profitablemanufacturing plant Acquire “mission-critical” assets essential to atenant’s operations Create upside through lease escalations, creditimprovements and real estate appreciation Competitor analysisCriticality of Asset Critical R&D or data-center Top performing retail stores Corporate headquarters Capitalize on existing tenant relationshipsthrough accretive expansions, renovations andfollow-on deals Hallmarks of our approach:– Diversification by tenant, industry, property typeand geography Local market analysisFundamental Valueof the UnderlyingReal Estate– Disciplined– Opportunistic– Proactive asset management– Conservative capital structureInvesting for the Long Run 6TransactionStructureand Pricing Property condition 3rd party valuation /replacement cost Downside analysis / costto re-lease Lease terms – rent growth andmaturity Financial covenants Security deposits / lettersof credit
Proactive Asset ManagementDomestic and international asset management capabilities to address lease expirations, changingtenant credit profiles and asset repositioning or dispositions Asset management offices in New York and Amsterdam W. P. Carey has proven experience repositioning assets through re-leasing, restructuring and strategic disposition Generates value creation opportunities within our existing portfolio Five-point internal rating scale used to assess and monitor tenant credit and the quality, location and criticality of each assetAsset Management ExpertiseTransactionOperational Leasing Lease compliance Dispositions InsuranceAsset Management Risk AnalysisTenantBankruptcyWatch ListObsoleteResidual RiskStableImplied IGCreditInvestmentGradeAsset Lease modifications Property inspections Credit and real estaterisk analysis Non-triple net leaseadministration Building expansionsand redevelopment Real estatetax Tenant distress andrestructuring Projections andportfolio valuationInvesting for the Long Run 7QualityAssetLocationAssetCriticalityNo TenantDemandNot CriticalLimited TenantDemand antDemandPossibleRenewalClass BGoodLocation /ActiveMarketCriticalRenewalLikelyClass APrime Location/ High TenantDemandHighlyCritical
2. Real Estate Portfolio
Large Diversified Portfolio (1)Number of PropertiesNumber of Tenants1,261351Square Footage146 millionABR 1.2 billionUS / Europe / Other (% of ABR)62% / 36% / 2%Contractual Rent Escalation: CPI-linked / Fixed / Other61% / 35% / 4%WALT10.6 yearsOccupancy98.3%Investment Grade Tenants (% of ABR)29.7%Top 10 Tenant Concentration (% of ABR)21.5%(1)Portfolio information reflects pro rata ownership of real estate assets (excluding operating properties) as of March 31, 2021 .Investing for the Long Run 9
Property and Industry Diversification(1)By Property Type (% of ABR)47%Industrial / Warehouse8%5%By Tenant Industry (% of fice22%Self-storage (Net tail7%4%18%5%8%5%5%Retail Stores (2)Consumer ServicesAutomotiveGroceryCargo TransportationBeverage and FoodHealthcare and PharmaceuticalsBusiness ServicesConstruction and BuildingCapital EquipmentSovereign and Public FinanceHotel and LeisureContainers, Packaging, and GlassDurable Consumer GoodsHigh Tech IndustriesOther (4)22%8%7%6%5%5%5%5%4%4%4%3%3%3%3%13%Portfolio information reflects pro rata ownership of real estate assets (excluding operating properties) as of March 31, 2021 .Includes automotive dealerships.Includes education facilities, hotel (net lease), laboratory, fitness facility, theater, student housing (net lease), restaurant and land.Includes tenants in the following industries: insurance, banking, telecommunications, aerospace and defense, chemicals, plastics and rubber, media: advertising, printing and publishing, media:broadcasting and subscription, wholesale, non-durable consumer goods, oil and gas, metals and mining, environmental industries, electricity, consumer transportation, forest products andpaper, real estate and finance.Investing for the Long Run 10
Top Ten Tenants (1)One of the lowest Top 10 concentrations among net lease peer groupTenantNumber ofPropertiesABR( millions)WALT(years)% ofTotal78 393.13.3%423515.92.9%Government office properties in Spain703113.72.6%Business-to-business wholesale stores in Italy & Germany20286.02.4%Automotive dealerships in the United Kingdom69249.22.0%Net lease self-storage properties in the U.S.272123.11.7%Distribution facilities in the U.S.302011.81.7%Net lease hotel properties in the U.S.18202.61.7%K-12 private schools in the U.S.31922.51.6%Industrial properties in the U.S. and Canada271922.21.6%384 25512.1 yrs21.5%DescriptionNet lease self-storage properties in the U.S.Do-it-yourself retail properties in Germany(2)State of AndaluciaTop 10(1)(2)Portfolio information reflects pro rata ownership of real estate assets (excluding operating properties) as of March 31, 2021 .In April 2021, we sold seven properties leased to this tenant with total ABR of 5.6 million as of March 31, 2021.Investing for the Long Run 11
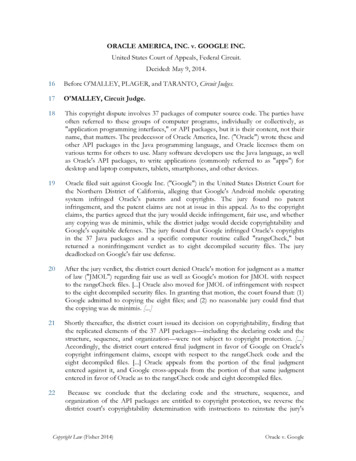
Geographic Diversification (1)W. P. Carey has been investing internationally for 22 years, primarily in Northern and Western EuropeOther (2), 2%, 24MMEurope, 36%, 422 MMUnited States,62%, 739 MM(1)(2)Portfolio information reflects pro rata ownership of real estate assets (excluding operating properties) as of March 31, 2021 .Includes Canada (1.1%), Mexico (0.7%) and Japan (0.2%).Investing for the Long Run 12
Internal Growth from Contractual Rent Increases(1)Over 99% of leases have contractual rent increases, including 61% linked to CPINone, 0.5%(2)Other, 4%UncappedCPI, 38%Fixed, 35%61% CPI-linkedCPI-based,23%(1)(2)Portfolio information reflects pro rata ownership of real estate assets (excluding operating properties) as of March 31, 2021 .Represents leases with percentage rent (i.e., participation in the gross revenues of the tenant above a stated level) and other increases.Investing for the Long Run 13
Same-Store ABR GrowthContractual same store growth of 1.6%Contractual Same Store Q21Contractual same store portfolio includes leases that were continuously in place during the period from March 31, 2020 to March 31, 2021. Excludes leases for properties that were acquired, soldor vacated, or were subject to lease renewals, extensions or modifications at any time that affected ABR during that period. For purposes of comparability, ABR is presented on a constant currencybasis using exchange rates as of March 31, 2021.Investing for the Long Run 14
Lease Expirations and Average Lease Term (1)Weighted average lease term of 10.6 yearsLease Expirations (% ABR) 1(1)(2)202220232024Portfolio information reflects pro rata ownership of real estate assets (excluding operating properties) as of March 31, 2021 .Assumes tenants do not exercise any renewal or purchase options.Investing for the Long Run 15Thereafter
Historical Occupancy(1)Stable occupancy maintained during the aftermath of the global financial crisis and the COVID-19 pandemicOccupancy (% Square Feet) es W. P. Carey and the following CPA REITs: Corporate Property Associates 12 Incorporated, Corporate Property Associate s 14 Incorporated, Corporate Property Associates 15 Incorporated,Corporate Property Associates 16 – Global Incorporated, Corporate Property Associates 17 – Global Incorporated (CPA:17) and CPA:18, as applicable. Portfolio information excludes operatingproperties.Represents occupancy for each completed year at December 31, otherwise occupancy shown is for the most recent quarter.Investing for the Long Run 16
Recent Acquisitions – Case StudiesCompleted investments totaling 3.0 billion since the beginning of 2018 Comprised of acquisitions totaling 2.5 billion and 550 million of completed capital investmentsRecent AcquisitionsPrima WawonaFebruary 2021Nexeo PlasticsFebruary 2021Casino Guichard-Perrachon S.A.April 2021Purchase Price: 75 millionPurchase Price: 19 millionPurchase Price: 119 millionFacility Type: Warehouse / LandFacility Type: WarehouseFacility Type: RetailLocation: Central Valley, CALocation: Ohio / South CarolinaLocation: Southern and Central FranceSize: 1,031,600 square feetSize: 269,286 square feetSize: 424,797 square feetLease Term: 25-year leaseLease Term: 20-year leaseLease Term: 20-year leaseRent Escalation: FixedRent Escalation: FixedRent Escalation: French CPIInvesting for the Long Run 17
Capital Investments – Case StudiesCapital investments have become a more meaningful part of our investment activity Completed capital investment projects totaling 311 million since the start of 2020 Approximately 180 million of projects are in process as of March 31, 2021, with 130 million scheduled to complete in 2021Recent Development ActivitySonaeCompleted September 2020American Axle & ManufacturingCompleted February 2021OrgillExpected Completion December2022Investment: 28 million expansionInvestment: 52 million build-to-suitInvestment: 20 million expansionFacility Type: WarehouseFacility Type: IndustrialFacility Type: WarehouseLocation: PortugalLocation: GermanyLocation: U.S.Size: 294,389 square feetSize: 162,373 square feetSize: 427,518 square feetLease Term: 20-year leaseLease Term: 20-year leaseLease Term: 20-year leaseRent Escalation: CPIRent Escalation: German CPIRent Escalation: FixedInvesting for the Long Run 18
3. Balance Sheet
Balance Sheet OverviewCapitalization (%)Capitalization ( MM)2%Total Equity (1)5%Equity (1)65%Senior Unsecured Notes28%Mortgage Debt (pro rata)5%Unsecured Revolving CreditFacility / Term Loans2%3/31/21 12,561Pro Rata Net Debt28%65%Senior Unsecured Notes USD2,550Senior Unsecured Notes EUR2,961Mortgage Debt, pro rata USD551Mortgage Debt, pro rata (EUR 330 / Other 48)378–Unsecured Revolving Credit Facility USDUnsecured Revolving Credit Facility (EUR — / Other 22)Capital Markets and Balance Sheet YTD 2021: Raised 171MM in net proceeds through ATM offering Feb 2021: Issued 425MM of 2.25% Senior Unsecured USD Notes due2033 to prepay secure debt Feb 2021: Issued 525MM of 0.95% Senior Unsecured EUR notes due2030 and used the proceeds to redeem the outstanding 2.00% SeniorUnsecured EUR notes due 2023 Oct 2020: Issued 500MM of 2.4% Senior Unsecured Notes due 2031 Jun 2020: Issued 382MM of equity through a forward offering,settling approximately 200MM to date Feb 2020: Amended and restated 2.1B credit facility, consisting of 1.8B revolving line of credit, 150MM term loan, and a 96.5MMdelayed draw term loan(4)320Unsecured Term Loans (EUR 113 / GBP 206) 6,781Total Pro Rata Debt(229)Less: Cash and Cash Equivalents 6,552Total Pro Rata Net DebtEnterprise Value 19,114Total Capitalization 19,343Leverage MetricsPro Rata Net Debt / Adjusted EBITDA(1)(2)(3)22Pro Rata Net Debt / Enterprise Value(2)(4)5.9x(1)(2)34.3%(3)41.2%Weighted Average Interest Rate (pro rata)2.7%Weighted Average Debt Maturity (pro rata)5.9 yearsTotal Consolidated Debt / Gross AssetsBased on a closing stock price of 70.76 on March 31, 2021 and 177,520,962 common shares outstanding as of March 31, 2021.Pro rata net debt to enterprise value and pro rata net debt to Adjusted EBITDA are based on pro rata debt less consolidated c ash and cash equivalents.Gross assets represent consolidated total assets before accumulated depreciation on real estate. Gross assets are net of accumulated amortization on in-place lease and above-marketrent intangible assets.Adjusted EBITDA represents 1Q21 annualized Adjusted EBITDA, as reported in the Form 8-K filed with the SEC on April 30, 2021.Investing for the Long Run 20
Debt Maturity SchedulePrincipal at Maturity (1)MortgageDebt1,400(2)UnsecuredBonds (EUR)UnsecuredBonds (USD)UnsecuredTerm LoanUnsecuredRevolver1,2001,000 est Rate(1)(2)(3)500425325232111880% of Total %3.9%1.0%2.4%–2.3%Reflects amount due at maturity, excluding unamortized discount and unamortized deferred financing costs.Reflects pro rata balloon payments due at maturity. W. P. Carey has two additional fully amortizing mortgages due in 2028 ( 9 MM) and 2031 ( 3MM).Reflects the weighted average percentage of debt outstanding and the weighted average interest rate for each year based on the total outstanding balance.Investing for the Long Run 21
Unsecured Bond Covenants(1)Investment grade balance sheet with Baa2/stable rating from Moody’s and BBB/stable ratingfrom S&PSenior Unsecured Notes (2)MetricCovenantMarch 31, 2021Total Debt /Total Assets 60%41.6%Secured Debt LeverageSecured Debt /Total Assets 40%4.6%Fixed Charge CoverageConsolidated EBITDA /Annual Debt Service Charge 1.5x5.7xUnencumbered Assets /Total Unsecured Debt 150%232.0%Total LeverageMaintenance of UnencumberedAsset Value(1)(2)This is a summary of the key financial covenants for our Senior Unsecured Notes, along with estimated calculations of our compliance with those covenants at the end of the period presented.These ratios are not measures of our liquidity or performance and serve only to demonstrate our ability to incur additional debt, as permitted by the covenants governing the Senior Unsecured Notes.As of March 31, 2021, our Senior Unsecured Notes consisted of the following note issuances: (i) 500 million 4.60% senior uns ecured notes due 2024, (ii) 500 million 2.25% senior unsecured notesdue 2024, (iii) 450 million 4.00% senior unsecured notes due 2025, (iv) 350 million 4.25% senior unsecured notes due 2026, (v) 500 million 2.25% senior unsecured notes due 2026, (vi) 500million 2.125% senior unsecured notes due 2027, (vii) 500 million 1.35% senior unsecured notes due 2028, (viii) 325 million 3.85% senior unsecured notes due 2029, (ix) 525 million 0.95% seniorunsecured notes due 2030, (x) 500 million 2.40% senior unsecured notes due 2031, and (xi) 425 million 2.25% senior unsecure d notes due 2033.Investing for the Long Run 22
History of Consistent Dividend GrowthW. P. Carey has increased its dividend every year since going public in 1998 Current annualized dividend of 4.19 with a yield of 5.9% (1) Conservative and stable payout ratio since conversion to a REIT in September 2012Dividends per Share (2) 5.00 3.69 3.83 3.93 4.01 4.09 4.14 4.17 4.19 4.00 3.39 1.65 1.67 1.69 1.70 1.72 1.73 1.76 1.79 1.82 1.88 1.96 2.00 2.03 2.19 2.00 1.00 092010201120122013Note: Past performance does not guarantee future results.(1) Based on a stock price of 70.76 as of March 31, 2021, and a cash dividend of 1.048 per share declared during 1Q21.(2) Full year dividends declared per share, excluding special dividends. 2021 represents 1Q21 annualized.Investing for the Long Run 2320142015201620172018201920202021Dividends per Share 3.00 2.44
4. Investment Management
Summary of Non-Traded Investment ProgramsTotal AUM of 2.9 billion, including 1.6 billion of net lease AUM CWI 1 and CWI 2 merged and internalized management in April 2020 Closed merger with CPA:17 in October 2018 Exited non-traded retail fundraising in June 2017CPA:18CESHDiversified / Net LeaseStudentHousingFundraising StatusClosedClosedAUM 2.6B 345MMNet leaseassets 1.5B 90MMBeginning after the 7th anniversary of the closing of the initialpublic offering in 2015Beginning 5 years after raising the minimum offeringamount in 2016Investment focusGeneral liquidationguideline (1)(1) Based on general liquidation guidelines set forth in the respective offering documents; ultimately the liquidation of CPA:18 is approved by its independent directors and the liquidation of CESH isdetermined by its general partner.Investing for the Long Run 25
5. COVID-19 Update
1Q21 Rent Payment StatusWPC collected 98% of rent due in the first quarterTotal Rent Due 1Q21Property Type2%%of total ABR% of 1Q21 rentdue and paid il18%97%Fitness, Theater and Restaurants1%76%Self Storage (net lease)5%100%6%100%100%98%%of total ABR% of 1Q21 rentdue and paid l98%Geography% of ABR from1Q21 rent due (1)Rent Paid98%Rent Deferred—OtherRent Not Paid2%Total(3)Note: ABR presented as of December 31, 2020. Percentages may not add to totals due to rounding.(1) Reflects payments from tenants with rental payments d
Do-it-yourself retail properties in Germany (2) 42 35 15.9 2.9% Government office properties in Spain 70 31 13.7 2.6% Business-to-business wholesale stores in Italy & Germany 20 28 6.0 2.4% Automotive dealerships in the United