Transcription
Making the GradeHow Investments in America’s InfrastructureBenefit Our Economy and EnvironmentThis report is also available at www.bluegreenalliance.org.
The BlueGreen Alliance unites 15 of our country’s largest unions andenvironmental organizations. Acting together, through nearly 16 millionmembers and supporters, we are a powerful voice for building a cleaner,fairer and more competitive American economy.B L U E G R E E N A L L I A N C E PA R T N E R O R G A N I Z AT I O N S
TABLE OF CONTENTSExecutive Summary.21. Introduction.32. Why Accelerate Infrastructure Investment?.5Economic Stimulus. 5Low Interest Rates. 5Environmental Benefits. 53. Economic Impacts of Accelerated Infrastructure Investment.64. Methodology. 75. Sustainability and Infrastructure Investment.8Power and the Electrical Grid. 8Surface Transportation. 9Rail. 10Water. 11Sustainable Stormwater – An Infrastructure Opportunity.11Airports.13Schools.13Dams, Levees, Waterways, and Marine Ports.14Parks and Recreation. 15Solid and Hazardous Waste. 166. Conclusion. 17Endnotes. 17Authors: Jim Barrett, Ph.D. Rob McCulloch Roxanne JohnsonThank you to BlueGreen Alliance colleagues Kim Glas, Erin Bzymek, Lee Anderson, Kelly Schwinghammer and Eric Steen.Design by Winking Fish.Errors remain the responsibility of the authors.MAKING THE GRADE: How Investments in America’s Infrastructure Benefit Our Economy and Environment1
EXECUTIVE SUMMARYEvery four years, the American Society ofCivil Engineers (ASCE) releases a report carddepicting the condition and performanceof America’s infrastructure across a numberof sectors of the U.S. economy, the latestbeing the 2013 Report Card for America’sInfrastructure.Unfortunately, America consistently getsbarely passing grades and our infrastructuresystems are in dire need of modernization.In 2013, ASCE gave the nation’s infrastructure a grade of “D ,” which is a slightimprovement over previous “D” grades, andestimated that to get to a grade of “B” wouldrequire an investment of 3.6 trillion over thenext seven years. It also showed that the gapbetween planned infrastructure investmentand the amount required to achieve a goodstate of repair is currently an estimated 1.6trillion dollars.This report delves into the economic impactsof closing that gap by accelerating infrastructure investment—using current financingapproaches—to achieve a “B” grade overthe next 10 years. By doing so, there is thepotential to support or create an additional2.7 million jobs across the U.S. economy andincrease Gross Domestic Product (GDP) by 377 billion over 10 years versus a businessas-usual approach.2But that’s not the only benefit. Making theseinvestments now will pay big dividends making our country more efficient and in reducing carbon pollution and other greenhousegas emissions driving climate change. Such anendeavor would accrue significant sustainability benefits across the economy. For eachof the sectors examined in the ASCE ReportCard, accelerated infrastructure investmentcould help achieve the following environmental benefits, including but not limited to: Saving nearly 5.7 billion gallons of fueland averting the carbon dioxide equivalent of 48 million metric tons per yearover the next decade by supporting thecurrent trajectory of transit ridership.Currently, transit ridership levels save theequivalent energy of the gasoline used bymore than 7.2 million cars a year—nearlyas many cars as are registered in Florida,the fourth largest state; Reducing climate change pollution by anequivalent of 225,000 metric tons of carbon dioxide for each 5 percent reductionin leaks from drinking water systems; Helping to reduce power plant emissionsby 30 percent below 2005 levels over thenext three decades by investing in moreefficient power plants and the electricalgrid; anddioxode—equivalent to the carbonpollution emissions of six million U.S.households—for each 5 percent reductionin the amount of solid waste Americansgenerate.In addition to saving energy and mitigatingclimate change impacts, infrastructure investment would significantly improve quality oflife and public health, while strengtheningthe economy by decreasing traffic congestion,reducing airport delays, expediting freightmovement, protecting our lakes and rivers,preserving our open spaces, and ensuringour children learn and play in safe, modernschools. There’s also a financial incentive. Ifthese investments were accomplished underthe present form of government expenditure, financing the additional 1.6 trillionnecessary to achieve an overall “B” grade attoday’s interest rates of 3.1 percent—versusthe pre-recession rate of 4.5 percent—suchinvestments would save taxpayers nearly halfa trillion dollars over 30 years.Stimulating the economy, creating jobs,fighting climate change, and improving ourcommunities—now and for generationsto come—are all good reasons to prioritizeinfrastructure investment. Reducing greenhouse gas emissions byapproximately 10 million tons of carbonMAKING THE GRADE: How Investments in America’s Infrastructure Benefit Our Economy and Environment
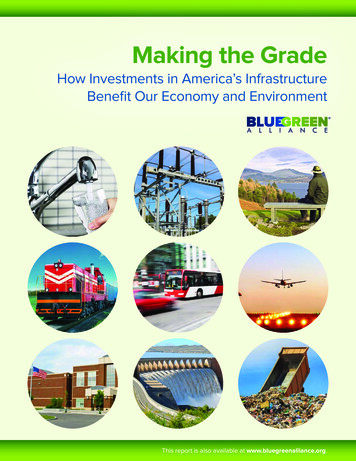
1.INTRODUCTIONMuch of the physical infrastructure of theUnited States is in a state of disrepair. Asdocumented by the American Society ofCivil Engineers (ASCE) in their 2013 ReportCard for America’s Infrastructure, our roads,transit systems, dams, and airports needbillions of dollars of investment to returnthem to adequacy. Our water, air, and landare threatened by aging systems designed toprovide safe drinking water, handle hazardous waste, treat wastewater, and manage oursolid waste. Half of our schools were built toeducate the generation that is now retiring,and our electric grid is widely recognized asbeing incapable of meeting the needs of ourchanging energy system.1While the problem has reached critical levels,it is not new. ASCE gave the infrastructurean overall grade of “D ” in 2013. However,in the five Report Cards issued since 1998,the only other overall grade ASCE has givenit has been a “D.” While last year’s “D ”grade represents the unfortunate apex of ourinfrastructure’s status, the amount of fundingneeded to bring the infrastructure up to agrade of “B” is also at its peak, requiring 3.6trillion in spending over the next seven yearsto reach that goal. (Figure 1)At the same time that the need for infrastructure investment has been growing, however,public investment in infrastructure has fallenprecipitously. As a share of Gross DomesticProduct (GDP), infrastructure spending is byfar at its lowest point in 20 years. (Figure 2)FIGURE 1. ASCE Grades, Annual Investment, and InvestmentNeeded, Billions600Planned Investment500Investment Needed400300200D DD DD200520091000199820012013Source: American Society of Civil EngineersAll of this is taking place in the context of aneconomy still recovering from the recessionof 2008-2009 with employment in construction at its lowest level in 16 years.2 Ironically,as our infrastructure continues to deteriorateand unemployment continues to plague thevery workers needed to bring it back to a reasonable state of repair, public investment ininfrastructure is flagging. As a share of GDP,public expenditures on infrastructure spikedtoward the end of the recession, due both toshrinking GDP and investment funded bythe American Recovery and ReinvestmentAct of 2009 (the Recovery Act). Since then,however, infrastructure investment has fallento its lowest levels since peaking in the late1970’s.3As a result, our overall infrastructure gradeimproved slightly to a “D ,” but the gapbetween planned infrastructure expendituresand the amount of funding needed to bring itto an overall “B” grade has risen to more than 1.6 trillion dollars.This study examines the economic impacts—and the potential sustainability benefits—offilling that gap by accelerating infrastructureinvestment sufficiently to achieve a grade of“B” within the next 10 years.MAKING THE GRADE: How Investments in America’s Infrastructure Benefit Our Economy and Environment3
FIGURE 2. Infrastructure Spending: Amount as a Percent of Real GDP17,0002.3016,0002.2015,0002.102.00Billions of USD1.9013,0001.8012,0001.7011,0001.60Spending As Compared toa Percentage of Real GDPGDP10,0009,0008,0001993Percentage of 0092011201320092011Source: U.S. Bureau of Economic Analysis and Census BureauFIGURE 3. Construction Employment, 99319951997199920012003200520072013Source: U.S. Bureau of Labor Statistics4MAKING THE GRADE: How Investments in America’s Infrastructure Benefit Our Economy and Environment
2.WHY ACCELERATE INFRASTRUCTUREINVESTMENT?ENVIRONMENTALBENEFITSIn addition to the economic costs of a failinginfrastructure that could be avoided—andthe economic benefits of investing in sectors struggling to recover from the recession—investing in infrastructure can yieldpotentially significant environmental benefitsas well. For example, a failing infrastructureis a drag on overall productivity in terms ofincreased congestion in multiple transportation modes, inadequate transit infrastructureand other inefficiencies that may be individually small but are significant in the aggregate.This represents waste of scarce resources andemissions of local and global pollutants thatwould be avoided if the infrastructure were ina sufficient condition.As the world’s climate continues to change,accelerated by carbon pollution and othergreenhouse gases, the deteriorating state ofour infrastructure becomes a vicious circle.As our systems crumble and become moreinefficient, excess pollution that resultsexacerbates climate change. As our climatechanges, more extreme weather—floods,stronger storms, droughts, and otherimpacts—test our already stressed infrastructure systems, endangering the healthand safety of our communities.FIGURE 4. Historical U.S. Employment, Thousands of 000126,000Total Non-Farm 020As measured by GDP, the economy overall iswell into recovery from the recession of 20082009. As measured by employment, however,the economy has a ways to go to returnto pre-recession levels. While the officialunemployment rate has fallen from a peak of9.7 percent in 2010 to just under 6 percent(September 2014), labor force participationrates have also fallen since 2010, from justover 65 percent at the end of the recession tojust under 63 percent. Overall employment isjust now returning to its pre-recession levels,leaving almost six years worth of population growth that has not found its way intogainful employment. As shown in Figure 3,employment in the construction sector washit particularly hard during the recessionand remains at pre-2000 levels. The jobssupported or created directly by acceleratedinfrastructure investment would be focusedlargely in the construction sector, where theyare badly needed—especially compared to theoverall employment. (Figure 4)20ECONOMIC STIMULUSBecause many federally funded expenditureson infrastructure are financed through borrowing, the overall cost of investment dependssignificantly on the interest rate on long-termTreasury bonds. In its efforts to stimulatethe private sector, the Federal Reserve hasmaintained loose monetary policy, keepingsustained downward pressure on interestrates. As a result, the interest rate on 30-yearTreasury bonds is just above 3 percent, nearits lowest point in history. Comparing theinterest costs of financing the additional 1.6trillion necessary to achieve an overall grade of“B” at today’s rates of 3.1 percent, versus thepre-recession rate of 4.5 percent, financing theexpenditure today would save taxpayers nearlyhalf a trillion dollars over 30 years.2004Aside from the overall drag our failing infrastructure creates on the economy, there area number of other reasons to accelerate thepace of investment:LOW INTEREST RATES03The most straightforward answer to thequestion of why we should accelerate ourinvestment in public infrastructure is thatif we do not, it will continue to fall intodisrepair. Investing at the currently plannedrates through 2020 will leave an investmentgap of almost 45 percent. ASCE estimatesthe economic cost of allowing the gap toperpetuate to be approximately 1.6 trillionthrough 2020. Failing to invest in creatingand maintaining adequate infrastructure isa classic example of being “penny wise andpound foolish.”Source: U.S. Bureau of Labor StatisticsMAKING THE GRADE: How Investments in America’s Infrastructure Benefit Our Economy and Environment5
3.ECONOMIC IMPACTS OF ACCELERATEDINFRASTRUCTURE INVESTMENTTo estimate the economic impacts of bringing our infrastructure up to a “B” grade, weexamined a scenario in which the additional 1.6 trillion in investment was undertakenover the next 10 years. We modeled expenditure in sectors relevant to each of the 11different infrastructure classes examined bythe ASCE in their 2013 Infrastructure ReportCard. We modeled both the stimulus impactof the expenditures—i.e. the increaseddemand for labor and materials necessary tocomplete the infrastructure upgrades—andthe impact on overall long-term GDP thatwould result from the investments. Figure 5shows the impact on overall GDP.Note that the jobs estimates reported here aremore appropriately called “job-year equivalents.” Each “job” represents an increase indemand for employment sufficient to employone person full time for one year. When labormarkets are tight, it is possible that a significant number of jobs created will be workershired away from other jobs, so not all of thejobs created will be net new employment.In the current economic situation with highunemployment in construction and other keysectors, this problem is largely minimized.In terms of employment, accelerating infrastructure investment would support or createa significant number of new jobs as shownin Table 1. As indicated, the constructionsector would be a major beneficiary of theinvestment, but job growth would acceleratein every sector of the economy. By 2024, theaccelerated investment would support nearly2.7 million additional full-time equivalentjobs throughout the economy in that year.FIGURE 5. GDP Growth from Getting America's Infrastructureto a "B" Grade in Billions4003503002502001501005002015201720182019 2020 2021 2022 2023 2024Source: Modified IMPLAN Model, see Methodology section on Pg. 7Table 1. Employment Growth by Sector in Thousands2019Agriculture20241443Electric Utilities13Natural Gas Utilities-1318741989471182Primary Metals12Fabricated TPUConstructionOther ManufacturingTradeGovernmentTotal Impacts62016MAKING THE GRADE: How Investments in America’s Infrastructure Benefit Our Economy and Environment
4.METHODOLOGYThe estimates developed for this report arebased on relatively straightforward inputoutput analysis. The model is based on coredata from the IMPLAN group, their 2011U.S. national model, with modifications forproductivity trends and other factors. Werelied on data from the ASCE 2013 ReportCard for estimates on the total investmentrequirements needed to bring the overallgrade for U.S. infrastructure up to a gradeof “B.” The investment requirements byinfrastructure category are shown in Table 2(dollars in 2011 billions).We allocated this expenditure across the individual economic sectors identified in Table2 using a combination of the pre-definedIMPLAN industry spending patterns forvarious types of infrastructure investments.We assumed that the expenditure wouldtake place over 10 years, starting slowly andramping up to a peak in the final year of thesimulation.Because the federal government operatesat a net deficit, we assumed that all of thefunding required for the investment wouldbe financed over 20 years using the 20-yearTreasury bond rate as projected by the EnergyInformation Administration (EIA) in its2013 Annual Energy Outlook. We imposed abalanced budget constraint by accounting forthe principal and interest payments requiredto support the bond financing throughoutthe simulation, modeled as increased federaltaxes.Table 2. Investment Gap in Billions (dollars in 2011 billions)Surface Transportation 863Water/Wastewater Infrastructure 86Electricity 109Airports 40Inland Waterways & Marine Ports 16Dams 15Hazardous & Solid Waste 47Levees 73Public Parks & Recreation 106Rail 11Schools 276TOTALS 1,643Following Leduc and Wilson (2013), weaccounted for the increase in overall economic productivity resulting from improvements in the infrastructure using a modifiedmultiplier effect. Leduc and Wilson foundevidence of both a near- and long-termimpact on GDP resulting from infrastructure improvements. Their research, whichfocused on local economies that benefittedfrom federal infrastructure grants, indicatedthat the near-term benefits were likely to betransient, but that the long-term effects weremore sustained. We used their lower boundestimate of the GDP impact of infrastructure expenditures beginning five years afterthe investment, and dissipating after threeyears, for which the lag and persistence theyfound to be statistically significant. As aresult of these assumptions, this productivity impact only appears in the second half ofour 10-year simulation. Because it impactsthe economy only after a five-year lag andbecause the expenditures in our simulationare phased in gradually, only a relatively smallshare of the total economic productivitybenefits is reflected in our simulation results.Additionally, in keeping with the practice ofstatic budget scoring, we did not account forthe increased tax revenues associated with thisaccelerated GDP growth, which would havereduced the need for increased taxes to coverthe bond payments and resulted in greatereconomic benefits.MAKING THE GRADE: How Investments in America’s Infrastructure Benefit Our Economy and Environment7
5.SUSTAINABILITY AND INFRASTRUCTUREINVESTMENTThere are significant sustainability benefitsthat could accrue from improving America’sinfrastructure to a “B” grade over the next10 years. In the following sections, potentialareas of environmental improvement frominfrastructure investment are described interms of avoided carbon emissions, reducedenergy demand, and associated climatechange and other quality of life impacts.POWER AND THEELECTRICAL G
a classic example of being “penny wise and pound foolish.” Aside from the overall drag our failing infra-structure creates on the economy, there are a number of other reasons to accelerate the pace of investment: ECONOMIC STIMULUS. As measured by GDP, the economy overa