Transcription
Measuring the EconomyA Primer on GDP andthe National Income andProduct AccountsConceptsFrameworkMeasuresInteractive AccessDecember 2015
Measuring the EconomyA Primer on GDP and the National Income and Product AccountsU.S. DEPARTMENT OF COMMERCEPenny S. PritzkerSecretaryECONOMICS AND STATISTICS ADMINISTRATIONKen ArnoldActing Under Secretary for Economic AffairsBUREAU OF ECONOMIC ANALYSISBrian C. MoyerDirectorDecember 2015www.bea.gov
AcknowledgmentsStephanie H. McCulla and Shelly Smith of the National Income and Wealth Division, Bureau ofEconomic Analysis (BEA), U.S. Department of Commerce, prepared this Primer.Brent R. Moulton, Associate Director for National Economic Accounts at BEA, and Carol E.Moylan, former Chief of the National Income and Wealth Division at BEA provided overall guidance.PrefaceThis paper introduces new users to the basics of the U.S. national income and product accounts(NIPAs). It discusses the economic concepts that underlie the NIPAs, and it describes the sevenNIPA summary accounts. The Primer also provides a brief overview of the derivation of the NIPAmeasures and a list of references for further information.Comments and questions about the NIPA Primer are invited. Please contact BEA’s NationalIncome and Wealth Division by e-mail at GDPniwd@bea.gov.i
ContentsAcknowledgments and Preface .iMeasuring the Economy: A Primer on GDP and the National Income and Product Accounts.1Conceptual Basis of the Accounts .The circular flow of income and expenditures .Economic concepts in the NIPAs.Output .Exhibit 1 .Income .Box An Imputation for the Services of Owner-Occupied Housing .22223–445NIPA Sectors .6The T-account .Table Income and Outlay Account for an Individual.77The Seven NIPA Summary Accounts .Account 1. Domestic Income and Product Account .Account 2. The Private Enterprise Income Account .Account 3. The Personal Income and Outlay Account .Account 4. The Government Receipts and Expenditures Account .Account 5. Foreign Transactions Current Account .Account 6. Domestic Capital Account .Account 7. Foreign Transactions Capital Account.Table Summary National Income and Product Accounts, 2012.881111121212139–10Derivation of the NIPA Measures .Estimate “vintages” .Current-dollar estimates.Quantity and price estimates.14141414Additional Reading.Concepts, framework, and history.Estimating methods and source data.Quantity, price, and chained-dollar indexes.Reliability of the estimates .1616161616Accessing the NIPA Estimates Interactively.17NIPA table arrangement .17NIPA table numbering system .17Example . 18–21ii
NIPA Primer1Measuring the EconomyA Primer on GDP and the National Income and Product AccountsHow fast is the economy growing? Is it speeding up or slowing down? How does the trade deficit affect economicgrowth? What’s happening to the pattern of spending on goods and services in the economy?To answer these types of questions about the economy, economists and policymakers turn to the national incomeand product accounts (NIPAs) produced by the Bureau of Economic Analysis (BEA). The NIPAs are a set of economicaccounts that provide information on the value and composition of output produced in the United States during agiven period and on the types and uses of the income generated by that production. Featured in the NIPAs is grossdomestic product (GDP), which measures the value of the goods and services produced by the U.S. economy in agiven time period.GDP is one of the most comprehensive and closely watched economic statistics: It is used by the White House andCongress to prepare the Federal budget, by the Federal Reserve to formulate monetary policy, by Wall Street as anindicator of economic activity, and by the business community to prepare forecasts of economic performance thatprovide the basis for production, investment, and employment planning.But to fully understand an economy’s performance, one must ask not only “What is GDP?” (or “What is the valueof the economy’s output?”), but other questions such as: “How much of the increase in GDP is the result of inflationand how much is an increase in real output?” “Who is producing the output of the economy?” “What output are theyproducing?” “What income is generated as a result of that production?” and “How is that income used (to consumemore output, to invest, or to save for future consumption or investment)?”Thus, while GDP is the featured measure of the economy’s output, it is only one summary measure. The answers tothe follow-up questions are found by looking at other measures found in the NIPAs; these include personal income,corporate profits, and government spending. Because the economy is so complex, the NIPAs simplify the informationby organizing it in a way that illustrates the processes taking place.This paper is intended as an introduction to the NIPAs for the new user. It begins by considering the transactionsthat occur in a simple economy in order to introduce the economic concepts that underlie the NIPAs. Next, itdescribes the NIPA sectors for which economic activity is measured and the use of T-accounts to illustrate economicflows. The third section introduces the seven summary accounts of the NIPAs and includes descriptions of the significant aggregates that they contain. The fourth section provides an overview of the derivation of the NIPA measures,including inflation-adjusted, or “real,” estimates. The last section provides references, organized by subject area, forusers interested in moving beyond an introduction to more in-depth or advanced information about economicaccounting and the NIPAs.
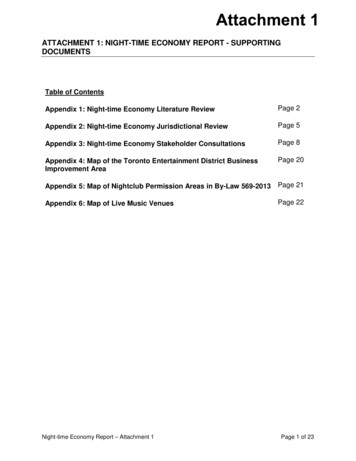
2NIPA PrimerConceptual Basis of the AccountsThe circular flow of income and expendituresTo better understand the economy and the NIPAs, consider a simple economy consisting solely of businessesand individuals, as reflected in the circular flow diagrambelow:and the contributions of these flows to the accumulationof fixed assets.The NIPAs provide a framework for presenting actualmeasures of these economic flows.OutputThe Circular FlowGoods and orIn this simple economy, individuals provide the laborthat enables businesses to produce goods and services.These activities are represented by the green lines in thediagram above.Alternatively, one can think of these transactions interms of the monetary flows that occur. Businesses provide individuals with income (in the form of compensation) in exchange for their labor. That income is, in turn,spent on the goods and services businesses produce.These activities are represented by the blue lines in thediagram above.Economic concepts in the NIPAsThe circular flow diagram illustrates the interdependenceof the “flows,” or activities, that occur in the economy,such as the production of goods and services (or the“output” of the economy) and the income generatedfrom that production. The circular flow also illustratesthe equality between the income earned from productionand the value of goods and services produced.Of course, the total economy is much more complicated than the illustration above. An economy involvesinteractions between not only individuals and businesses,but also Federal, state, and local governments and residents of the rest of the world. Also not shown in this simple illustration of the economy are other aspects ofeconomic activity such as investment in capital (produced—or fixed—assets such as structures, equipment,research and development, and software), flows of financial capital (such as stocks, bonds, and bank deposits),The featured measure of output in the NIPAs is GDP.GDP measures the market value of the goods, services,and structures produced by the nation’s economy in aparticular period. While GDP is used as an indicator ofeconomic activity, it is not a measure of well-being (forexample, it does not account for rates of poverty, crime,or literacy).The following are several points to keep in mind whenconsidering the output of the economy.1. GDP includes market production and some nonmarket production.GDP is composed of goods and services that are produced for sale in the “market”—the generic term referring to the forum for economic transactions—and ofnonmarket goods and services—those that are not sold inthe market, such as the defense services provided by thefederal government, the education services provided bylocal governments, the emergency housing or health careservices provided by nonprofit institutions servinghouseholds (such as the Red Cross), and the housing services provided by and for persons who own and live intheir home (referred to as “owner-occupants”). However,not all productive activity is included in GDP. Someactivities, such as the care of one's own children, unpaidvolunteer work for charities, and illegal activities, are notincluded because data are not available to accuratelymeasure their value.2. Whenever possible, GDP is valued at market prices.The NIPAs value market goods and services usingprices set by the market. This approach provides a common unit of measurement (dollars) that facilitates comparisons of the various goods and services that make upeconomic activity. Using market values also facilitates theanalysis of the impacts on the economy of events such asthe implementation of government programs or theoccurrence of natural disasters.In some cases, market prices do not fully reflect thevalue of a good or service, and may include some types ofservices where an actual exchange has not occurred. Inthese cases, the value of the good or service produced is
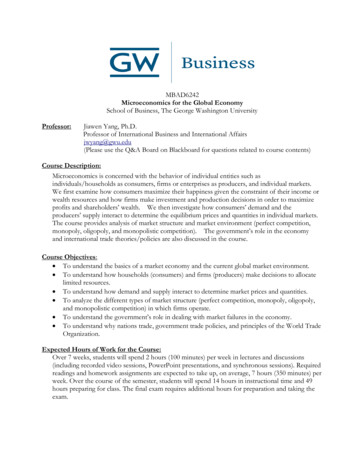
NIPA Primer“imputed” from similar market transactions. Imputations measure the value of goods and services that are notfully reflected in market prices. Examples of imputedmeasures in the NIPAs include the value of compensation-in-kind (such as meals provided by employers) andthe value of owner-occupied housing. For more information on owner-occupied housing, see the box on page 14,“An Imputation for the Services of Owner-OccupiedHousing.”In cases where there are no similar market transactionsavailable to impute a value of the goods or service beingproduced, the output of these services is valued by estimating the costs (such as employee compensation andpurchases of materials and supplies) of producing thegood or service.3. GDP is a measure of current production, not sales.In the NIPAs, the measure of output refers to outputproduced in that period, regardless of when that output issold. For example, an automaker may produce a car inone period and sell it in a later period. In the first period,the production of the car is recorded in GDP as an addition to inventories, a component of private enterpriseinvestment. In the later period, the sale of the car isrecorded twice, both as a consumer expenditure and as awithdrawal from inventories. As no new production tookplace, GDP is not affected.4. GDP is equal to the value of goods and services for“final” users.The measurement of GDP captures the value of products that are consumed and not used in a later stage ofproduction, those that are sold, given away, or otherwisetransferred to foreign residents, those that are used toproduce other goods and that last more than a year, andthose that may be inventoried for future consumption.When considering the production process for the entireeconomy, the value of intermediate products—that is,goods and services that are used as inputs in the production process (and will not contribute to future production)—is excluded, so that the measure of output is anunduplicated total.For example, consider a simple economy with oneproduct, bread, which is produced in three stages:1. Wheat is grown, harvested, and sold for 1 by afarmer (for simplification, it is assumed thewheat is produced using no intermediate products);2. The wheat is used by a miller to produce flour,which is sold for 3; and3. The flour is used by a baker to produce bread,which is sold to a consumer for 7.3This information is summarized in exhibit 1:Exhibit 1IntermediateproductIncomeSales 0 1 1 1 2 3Baker, bread 3 4 7Total 4 7 11Farmer, wheat When the miller purchases 1 worth of wheat from thefarmer to produce flour and then sells the flour to thebaker for 3, the 3 the miller charges for the flourincludes the 1 price of the wheat (an intermediate product) plus the 2 value added by his own resources (in thisexample, his labor). When the baker makes the flour intobread and sells the bread to a consumer for 7, the 7 thebaker charges includes the 3 value of the flour (an intermediate product) and the 4 value added by his ownresources. The value of the ultimate product—thebread—is the price paid by the consumer ( 7); the breadis recognized as the ultimate product because it is eatenby the consumer and not used in another productionprocess. If the total sales of the wheat, the flour, and thebread were all included, the aggregate value ( 1 3 7, or 11) would overstate the value of production bytriple-counting the value of the wheat and double-counting the value of the flour.5. GDP can be measured in three different ways.The nature of economic activity reflected in the circular flow diagram suggests two ways to measure GDP.First, GDP can be measured as the sum of expenditures, or purchases, by final users. This is known as theexpenditures approach (and is illustrated by the formulafamiliar to students of economics: GDP Consumption Investment Government spending eXports– iMports) and is used to identify the final goods andservices purchased by persons, businesses, governments,and foreigners. Second, because the market price of a
4NIPA Primergood or service will reflect all of the incomes earned andcosts incurred in production, GDP can also be measuredas the sum of these charges. This is known as the incomeapproach and is used to examine the purchasing power ofhouseholds and the financial status of business income.In addition, GDP can also be measured either as totalsales less the value of intermediate inputs or as the sum ofthe “value added” at each stage of the production process.The value-added approach to measuring GDP is central tothe U.S. industry accounts and is used to analyze theindustrial composition of U.S. output.These three approaches can be illustrated using theinformation from exhibit 1.Exhibit 1IntermediateproductIncome value addedSales Total output 0 1 1 1 2 3Baker, bread 3 4 7Total 4 7 11Farmer, wheat 6. GDP captures output produced in the United States.GDP is a measure of the goods, services, and structures produced by labor and property located within theUnited States (in the NIPAs, the United States comprisesthe 50 states and the District of Columbia). Thus, GDPincludes the output of U.S. offices or establishments offoreign companies located in the United States, and itexcludes the output of foreign offices or establishments ofU.S. companies located outside the United States. Thistreatment aligns GDP with other key U.S. statistics associated with the domestic economy, such as populationand employment.7. GDP is a “gross” measure.GDP reflects production in a given time period,regardless of whether that production is used for consumption, for investment in new fixed assets or inventories, or for replacing depreciated fixed assets. Economicdepreciation, or the consumption of fixed capital (CFC),is a measure of the amount that would need to be “setaside” to cover the physical deterioration, normal obsolescence, and accidental damage (except that caused by acatastrophic event) of existing fixed assets. SubtractingCFC from GDP leaves “net domestic product,” which is ameasure of current production that excludes the investment that is necessary to replace existing fixed assets asthey wear out or become obsolete. Thus, net domesticproduct is a measure that indicates how much of theNation’s output is available for consumption or for adding to the Nation’s wealth.IncomeOutput (sum of final expenditures) Total income earned from productionValue added Total output – Total intermediate productsAs demonstrated in point 4 above, GDP can bederived as the sum of final expenditures for bread,which is the 7 spent by consumers It can be derived as the sum of the incomes earned inthe production of bread—that is, as the sum of the 1earned by the farmer for his labor, the 2 earned bythe miller for his labor, and the 4 earned by the bakerfor his labor. It can be derived as the value added, o
Concepts Framework Measures Interactive Access December 2015. Measuring the Economy A Primer on GDP and the National Income and Product Accounts . by Wall Street as an indicator of economic activity, and by the business community to prepare forecasts of economic performance that provide