Transcription
Kingman AreaExecutive SummaryTransportation Study UpdateeturoFEBRUARY 2011Prepared for: ArizonaDepartment of Transportation66
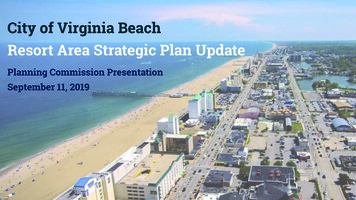
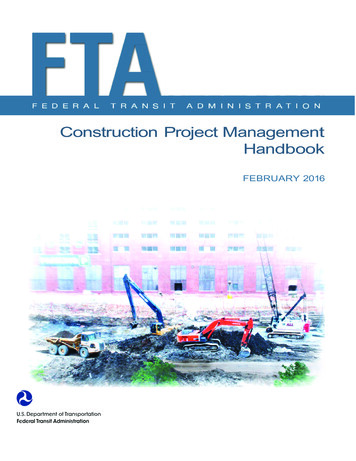
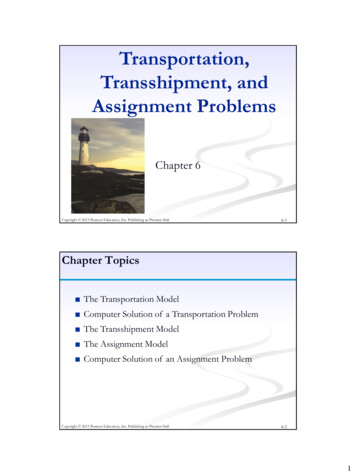
1 INTRODUCTIONThe Arizona Department of Transportation (ADOT), in cooperation with the City of Kingman andMohave County, initiated a study to update the 2005 Kingman Area Transportation Study (KATS)utilizing the Planning Assistance for Rural Areas (PARA) program. The purpose of the PARA program isto assist counties, cities, towns, and tribal communities in addressing a broad range of multimodaltransportation planning issues.The principal purpose of this study is to update the 2005 KATS. The study will result in a plan oftransportation improvements for 5-year (short-range), 10-year (mid-range), and 20-year (long-range)planning horizons. The recommendations are multimodal, considering roadways, non-motorizedtransportation modes (bicycles and pedestrians), and transit components.This document, the Kingman Area Transportation Study Update Executive Summary, is a companion tothe Kingman Area Transportation Study Update Final Report. It provides a brief summary of current andfuture conditions, transportation needs and issues, recommended improvements, and the implementationplan. More detailed information on each topic can be found in the Final Report.The study area encompasses the entire City of Kingman (City) plus portions of unincorporated MohaveCounty (County), as shown in Figure 1. This study area is significantly larger than what was included inthe 2005 KATS, having been expanded from 59 square miles to 165 square miles.2 CURRENT CONDITIONSThis chapter summarizes data obtained on current conditions to help identify current needs anddeficiencies of the existing transportation network.2.1 Land UsesAn understanding of current land uses is important for modeling travel characteristics. Land useinformation is converted to population and employment data for use in the travel demand model.Typically, population produces trips while employment attracts trips in the travel demand model.The study area is currently comprised of various land uses, including commercial, industrial, residential,and public land uses. Major traffic generators in the study area include the Kingman Airport andIndustrial Park, Kingman Regional Medical Center, Hualapai Mountain Medical Center, governmentservices and commercial businesses in the downtown area, and the shopping areas along Stockton HillRoad north of Detroit Avenue.Public lands are also present within the study area. Public land uses/ownership within the study areainclude: City, County, State, and Federal government facilities, the Cerbat Foothills Recreation Area(owned by the Bureau of Land Management and the City), State Trust land (owned by the Arizona StateLand Department, or ASLD), parks, open space, and schools.The 2010 population estimates for the 2005 KATS study area were obtained from the ArizonaDepartment of Commerce. The population within the expanded portion of the study area was developedby estimating the number of housing units factored by the average household size for the City ofKingman from the 2000 census. The resulting study area population estimate for 2010 is 52,049. Acomparison of 2000 population estimates and 2010 population estimates is provided in Table 1.091374035February 20111Kingman Area Transportation Study UpdateExecutive Summary
Figure 1: Study Area091374035February 20112Kingman Area Transportation Study UpdateExecutive Summary
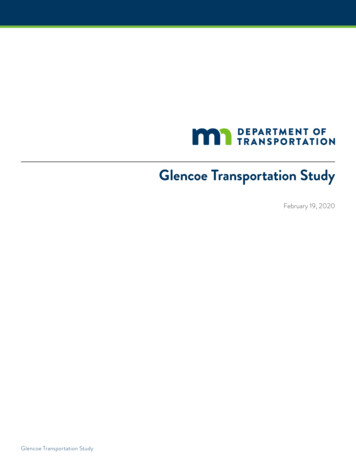
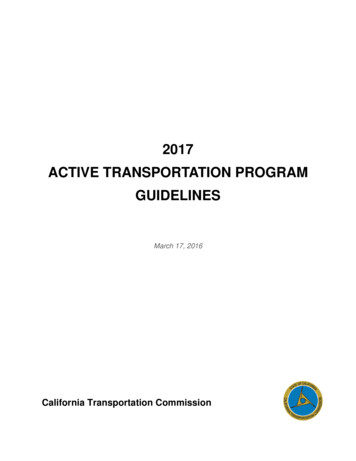
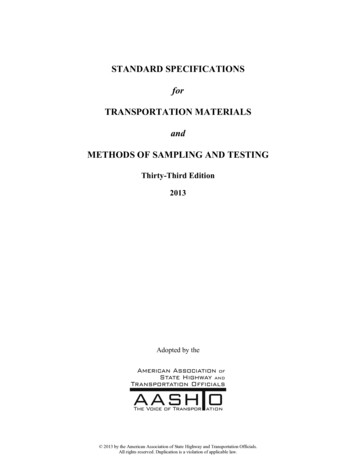
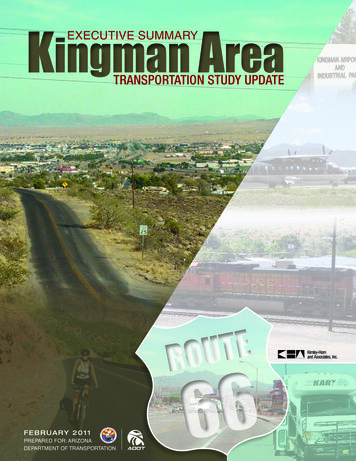
Table 1. 2000 and 2010 Study Area PopulationPortion of Study Area2000 Population2010 Population2000-2010 AnnualGrowth RatePopulation within the City limits20,06931,7224.68%Population within the adjacentunincorporated tion within the expanded portionof the study areaTotalSources: 2000 Census, Arizona Department of CommerceThe employment types in the Kingman area include government, medical, manufacturing, and retail.Employment data for 2010 was estimated using a ratio of employment to population of 0.38. This is thesame ratio that was used in the 2005 KATS. The resulting 2010 employment estimate for the study areais 19,779.2.2 RoadwaysThe existing roadway network in the study area is composed of an interstate highway, a U.S. highway,two state highways, an arterial street system, and collector and local streets. This study focuses on all ofthese categories with the exception of local streets.2.2.1 Traffic VolumesTraffic count data was obtained to document the volume of traffic on study area roadways. Daily trafficvolume data from 2008, 2009, and 2010 on selected roadway segments was provided by the City, County,and ADOT and is displayed in Figure 2. Peak period intersection movement volumes were collected at17 locations.2.2.2 Traffic Levels of ServiceRoadway traffic operations are defined and categorized by the amount of delay experienced by an averagedriver. The operations are categorized by a grading system called level of service (LOS), which has aletter designation ranging from A (no delay) to F (severe congestion). These levels are visually depictedin Figure 3.LOS is generally defined as follows: LOS A represents free flow.LOS B represents reasonably free flow, but the presence of other users in the traffic stream begins tobe noticeable.LOS C represents stable flow. The operation of individual users is somewhat affected by interactionswith others in the traffic stream.LOS D represents high-density but stable flow. The operation of individual users is significantlyaffected by interactions with others in the traffic stream.LOS E represents unstable flow, meaning operating conditions are at or near the capacity level. Theoperation of individual users is heavily affected by interactions with others in the traffic stream.LOS F represents forced or breakdown flow, meaning operating conditions have exceeded thecapacity level. The operation of individual users is severely affected by interactions with others in thetraffic stream.091374035February 20113Kingman Area Transportation Study UpdateExecutive Summary
Figure 2: Current Daily Traffic Volume Counts091374035February 20114Kingman Area Transportation Study UpdateExecutive Summary
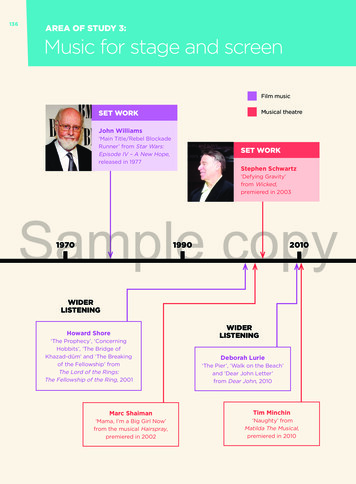
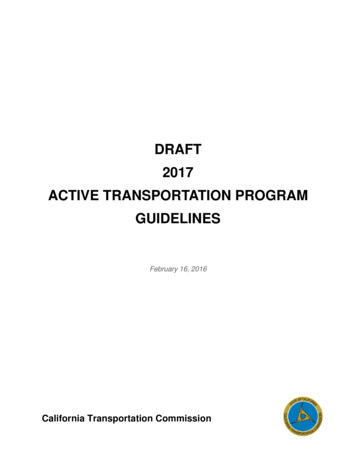
Source: Florida DOT Quality/Level of Service Handbook, 2002Figure 3: Depictions of Traffic Levels of ServiceFor the Kingman area, roadways and intersections operating at LOS A, LOS B, and LOS C are consideredto be acceptable and do not require capacity improvements.A review of the current daily volumes compared to daily volume LOS thresholds indicates that no studyarea roadway segments currently exceed the daily volume threshold for LOS D. The only roadwaysegments that currently exceed the daily volume threshold for LOS C are Stockton Hill Road betweenNorthern Avenue and Motor Avenue, and US 93 between Fort Beale Drive and I-40.Table 2 shows the study area intersections that currently have a critical v/c ratio corresponding to LOS Dor worse based on the results of the peak hour capacity analysis. Four intersections along Stockton HillRoad, plus both ramp intersections at the I-40/US 93 interchange, have a v/c ratio corresponding to LOSE during the midday peak hour. Additional capacity is likely needed at these intersections. The StocktonHill Road and I-40 WB Ramps intersection has a v/c ratio that corresponds to LOS D during the middaypeak hour and more detailed analysis should be conducted to determine if additional capacity is needed.091374035February 20115Kingman Area Transportation Study UpdateExecutive Summary
Table 2. Intersections with Current Need for ImprovementsIntersectionV/C RatioLOS ValueStockton Hill Road and Airway Avenue0.96EI-40 EB Ramps and US 930.92EI-40 WB Ramps and US 930.90EStockton Hill Road and I-40 EB Ramps0.90EStockton Hill Road and Sycamore Avenue0.89EStockton Hill Road and Andy Devine Avenue0.86EStockton Hill Road and I-40 WB Ramps0.83D2.2.3 Crash AnalysisA review of recent crash history was completed and the roadway segments and intersections with thehighest crash rates were identified. In the five-year period from 2004 to 2008, there were a total of 4,218crashes in the study area. The ten study area roadway segments and ten study area intersections with thehighest crash rates are shown in Figure 4.2.2.4 TransitPublic transit services are currently provided in the Kingman area through the Kingman Area RegionalTransit (KART) system. KART operates four fixed routes on an hourly basis. With advancereservations, curb-to-curb service is also provided within ¾-mile of the fixed routes to the general public,seniors, and disabled persons.Specialized transit providers operate in the Kingman and Mohave County area. These include theMohave Mental Health Center, which provides transportation services to support client needs, andWestCare, which contracts with child protective services to provide services to and from appointments,visits, school, and work within Mohave County.2.2.5 RailThe railroad tracks that extend through the City of Kingman provide for both freight and passengerservices. According to the Federal Railroad Administration (FRA) Office of Safety Analysis, up to 81trains pass through Kingman each day. The Burlington Northern Santa Fe Railway Company (BNSF)provides freight services and Amtrak provides passenger services in Kingman. Both service providersuse the BNSF tracks, which run from Los Angeles to Chicago as part of the BNSF Transcontranscontinental main line. The train station in downtown Kingman provides a stop for Amtrak’s“Southwest Chief” route, which has one train in each direction daily. In fiscal year 2010, the annualridership at the Kingman Amtrak station was 10,160 persons according to Amtrak. There are six gradeseparated roadway crossings and three at-grade roadway crossings of the mainline railroad tracks in thestudy area.2.2.6 Bicycles and PedestriansBicycle and pedestrian facilities are an integral part of a multimodal transportation network in that theyprovide options for travel (which is especially critical for travelers who cannot drive). Elements thatmake up the bicycle network include designated bike routes, striped bike lanes, paved shoulders alongroadways, wide curb lanes, multi-use paths, and sidewalks. Pedestrian networks are comprised ofsidewalks, trails, and multi-use paths.091374035February 20116Kingman Area Transportation Study UpdateExecutive Summary
Figure 4: Roadway Segments and Intersections with Highest Crash Rates091374035February 20117Kingman Area Transportation Study UpdateExecutive Summary
2.2.7 Kingman AirportThe Kingman Airport is located five miles north of I-40 along SR 66 adjacent to the main BNSF railroadtracks. The Kingman Airport encompasses nearly 3,000 acres. Airport facilities include two intersectingrunways (6,831 and 6,725 feet long), two helipads, several taxiways, a 2,640 square foot passengerterminal, 21 hangar facilities, and several parking aprons.According to the 2006 Kingman Airport Master Plan, the total number of aircraft based at the KingmanAirport is approximately 305. Commercial air service is provided by Great Lakes Airlines, with serviceto Las Vegas, Nevada and Farmington, New Mexico.The Kingman Airport currently has approximately 55,000 annual aircraft operations. Aircraft operationsconsist of: 60% local general aviation37% transient general aviation2% commercial1% air taxi 1% military3 FUTURE CONDITIONSThis chapter summarizes the anticipated future conditions for the Kingman area transportation network.The horizon year for this study is 2030.3.1 Land UsesFuture commercial land uses are expected to be located in the same areas as existing commercial landuses, namely along Stockton Hill Road, Andy Devine Avenue, Bank Street, Armour Avenue, AirwayAvenue, Northern Avenue, and in the downtown area along Beale Street. The area east of Andy DevineAvenue is expected to see significant increases in commercial land use near the proposed KingmanCrossing Boulevard and Rancho Santa Fe Parkway traffic interchanges on I-40 when the interchanges arebuilt.Future industrial land uses will follow the same pattern as existing industrial land uses, and occur alongBank Street and Armour Avenue and at the Kingman Airport and Industrial Park.Residential developments are anticipated to replace vacant land primarily on the northern and easternedges of the City limits. Residential areas closer to the downtown area are anticipated to see increaseddensities over time as infill development and redevelopment occurs.Most of the public land use/ownership within the study area is anticipated to remain unchanged, exceptthe State Trust lands, which could be sold by ASLD to developers.3.2 Population and EmploymentThe 2030 population for the study area is estimated to be 77,363. This represents a compound annualgrowth rate of 2.0% compared to the 2010 population. The 2030 population estimate is comprised ofthree components: The population within the City limitsThe population within the adjacent unincorporated landThe population within the expanded portion of the study area091374035February 20118Kingman Area Transportation Study UpdateExecutive Summary
Table 3 compares the 2010 and 2030 population estimates for the three components of the study areapopulation.Table 3. 2010 and 2030 Study Area PopulationPortion of Study Area2010 PopulationPopulation within the City limits31,722Population within the adjacentunincorporated land17,875Population within the expanded portionof the study areaTotal2030 Population2010-2030 AnnualGrowth 3632.00%Sources: 2000 Census, Arizona Department of CommerceEmployment data for 2030 was estimated using the same 0.38 ratio of employment to population that wasused to estimate 2010 employment, resulting in an estimated 2030 study area employment total of 29,397.3.3 Traffic Volume ForecastsA travel demand model was developed for the Kingman area to provide a tool for estimating future trafficvolumes. The model utilizes population and employment data, typical vehicle trip generationcharacteristics, and roadway network information such as number of through lanes and speed limits toestimate traffic volumes on the roadway network. The model estimates traffic volumes by determiningthe number of vehicle trips produced and attracted by the various land uses and assigning those trips tothe adjacent roadway network.A 2010 baseline year model was developed using the 2010 population and employment data. The 2010volumes generated by the model were compared to the available historical traffic count data and modelparameters were adjusted until the 2010 model volumes were similar to the historical counts. After the2010 conditions model was calibrated, a 2030 horizon year baseline model was developed using the 2030population and employment data. The 2030 volumes generated by the model were reviewed forreasonableness and minor adjustments were made as needed. Figure 5 shows the projected baseline 2030study area traffic volumes.3.4 Roadway Levels of ServiceFuture roadway needs were identified by comparing the projected baseline 2030 daily traffic volumes todaily volume LOS thresholds to determine which roadways are approaching their maximum capacity.Roadway segments with existing daily volumes below the maximum daily volume threshold for LOS Clikely do not need additional through capacity, while roadway segments with existing daily volumesabove the maximum daily volume threshold for LOS D will probably need additional through capacity.For roadway segments with existing daily volumes between the maximum daily volume thresholds forLOS C and LOS D, more detailed analysis should be conducted to evaluate intersection geometry, signaltiming, and number and spacing of driveways to determine if additional through capacity is needed.3.5 Public TransitFuture public transit services in the study area are anticipated to be provided by KART. There are no“committed” expansion projects for additional KART routes or new public transit facilities such as bus091374035February 20119Kingman Area Transportation Study UpdateExecutive Summary
bays and commuter park-and-ride lots. In fact, if the recent decline in available public transit fundingcontinues, KART has plans to further reduce service hours.3.6 RailRailroad traffic is anticipated to increase in the future as population and employment increase in theUnited States. The City has plans to provide several additional grade-separated roadway crossings of therailroad tracks but funding has not been secured for any of these crossings.The City has had preliminary discussions about establishing railroad “quiet zones” in accordance withFRA requirements at the three downtown Kingman at-grade crossings. When a quiet zone is established,trains are not permitted to blow their horns within the quiet zone except in emergencies.There has been discussion and planning at the national level regarding high-speed passenger rail. Highspeed rail travel is generally economically competitive with highway and air travel between cities that are100 to 600 miles apart. According to the 2010 Arizona Statewide Rail Framework Study, there is greatpotential to connect the cities of Phoenix and Las Vegas with a high-speed rail corridor, and the likelyroute would pass through the Kingman area.3.6.1 Bicycles and PedestriansAt the national level, there is emphasis on complying with the Americans with Disabilities Act (ADA)and providing more bicycle and pedestrian facilities along roadways to create “complete streets”.“Complete streets” are designed to function for all users to safely and effectively move along and across a“complete street” (see www.completestreets.org).Elements of a complete street include sidewalks, bike lanes (or wide paved shoulders), special bus lanes,comfortable and accessible transit stops, frequent crossing opportunities, median islands, accessiblepedestrian signals, curb extensions, and more. A complete street in a rural area may have differentelements, but should achieve the same goal.3.6.2 Kingman AirportThe 2006 Kingman Airport Master Plan recommends constructing a new terminal building, several newtaxiways, and an extension of Runway 3-21. The master plan also recommends reserving the lands southand east of the airport along the edge of airport property for potential industrial uses.091374035February 201110Kingman Area Transportation Study UpdateExecutive Summary
Figure 5: Projected Baseline 2030 Daily Traffic Volumes091374035February 201111Kingman Area Transportation Study UpdateExecutive Summary
4 IDENTIFIED CURRENT AND FUTURE NEEDSThe identified transportation system needs result from a variety of factors, including roadway congestion,high crash areas, physical barriers such as I-40 and the railroad, traffic control devices, land developmentand growth projections, gaps in bicycle and pedestrian facilities, and inadequate transit service. As a firststep in determining alternatives and solutions, issue areas and deficiencies were documented.4.1 Existing and Future Capacity DeficienciesCapacity deficiencies were evaluated for intersections and roadway segments using a LOS C thresholdbased on existing traffic count data and 2030 traffic forecasts. The roadway segments with future LOS Dor worse are shown in Figure 6. In addition to the intersections noted previously in Table 2 with existingLOS D or LOS E, the major intersections within the identified capacity-deficient roadway segments mayneed additional capacity improvements to provide acceptable intersection traffic operations through 2030.Future traffic signals may also be warranted at some of the intersections within the identified capacitydeficient roadway segments.4.2 SafetyThe ten high-crash rate study area roadway segments intersections identified previously in Figure 4 needto be evaluated to determine if crash patterns can be identified that are susceptible to correction
WestCare, which contracts with child protective services to provide services to and from appointments, visits, school, and work within Mohave County. 2.2.5 Rail The railroad tracks that extend through the City of Kingman