Transcription
Hindawi Publishing CorporationInternational Journal of Polymer ScienceVolume 2015, Article ID 714352, 7 pageshttp://dx.doi.org/10.1155/2015/714352Research ArticleRheological Behavior of Renewable Polyethylene (HDPE)Composites and Sponge Gourd (Luffa cylindrica) ResidueViviane Alves Escócio,1 Elen Beatriz Acordi Vasques Pacheco,1Ana Lucia Nazareth da Silva,1 André de Paula Cavalcante,2 and Leila Léa Yuan Visconte11Instituto de Macromoléculas, Universidade Federal do Rio de Janeiro (UFRJ), Avenida Horácio Macedo,2.030 Centro de Tecnologia, Prédio do Bloco J, 21941-598 Rio de Janeiro, RJ, Brazil2Instituto de Quı́mica, Universidade do Estado do Rio de Janeiro (UERJ), Rua São Francisco Xavier, 524 Maracanã,Pavilhão Haroldo Lisboa da Cunha, Sala 310, 3 Andar, 20550-900 Rio de Janeiro, RJ, BrazilCorrespondence should be addressed to Viviane Alves Escócio; vivi75@ima.ufrj.brReceived 26 February 2015; Accepted 27 April 2015Academic Editor: Saiful IslamCopyright 2015 Viviane Alves Escócio et al. This is an open access article distributed under the Creative Commons AttributionLicense, which permits unrestricted use, distribution, and reproduction in any medium, provided the original work is properlycited.The present study reports the results of rheological behavior of renewable composites, based on a matrix of high density polyethylene(HDPE), made from ethanol distilled from sugarcane, and lignocellulose filler from waste generated in the processing of spongegourds for bathing use. The composites were prepared with 10, 20, 30, and 40%wt of filler in a twin-screw extruder. The materialswere analyzed in a parallel plate rheometer and a melt-flow indexer. The composite morphology was determined by scanningelectron microscopy. The composite viscosity increased with filler content, suggesting possible formation of filler agglomerates.This result was confirmed by Cole-Cole diagrams.1. IntroductionKnowledge of the rheological properties of melted polymersis important because it permits selecting the best materialfor a determined application and processing technique [1].Molar mass, size distribution of macromolecules, number ofstructural conformations, and the possible entanglement ofpolymer chains are factors responsible for the large differences in flow between various polymers during processing.The flow properties of viscoelastic fluids also depend ontemperature, deformation rate, and processing time [2].Besides these aspects, during processing, by either extrusion or injection molding, polymers are subjected to varioustypes of deformation due to the complex geometry of thedevices used. Rheological testing provides information on thedeformations and strains of polymers and their compositesunder flow conditions, to enable understanding and predicting their final morphology and thus their properties [3].There are only a few reports in the literature on therheological behavior of HDPE composites of fossil origin(called conventional HDPE here) combined with cellulose.To the best of our knowledge, there are no published studies of composites made of totally renewable polyethylene.González-Sánchez et al. [4] studied the rheological behaviorof composites made of HDPE or polypropylene (PP) with10, 25, 40, and 48% by weight of cellulose fiber before andafter five reprocessing cycles. The fiber used was eucalyptuspulp. The effects of shear rate, fiber content, and type ofmatrix were analyzed in the virgin and reprocessed composites. The rheological data, obtained by capillary rheometry, scanning electron microscopy, and thermogravimetry,showed a decline in viscosity of the HDPE reprocessed atlow shear rates. This decrease was more pronounced in thecomposites containing higher fiber concentrations, due to thethermal degradation of the fibers at low shear rates (lowerthan 100 s 1 ). The authors also observed a greater loss ofpseudoplasticity of the PP composites than those made withHDPE. In another study of HDPE composites, Li and Wolcott[5] also assessed the rheological properties with a capillaryrheometer and used different cellulose filler, from maple andpine logs with different diameters. The authors observed
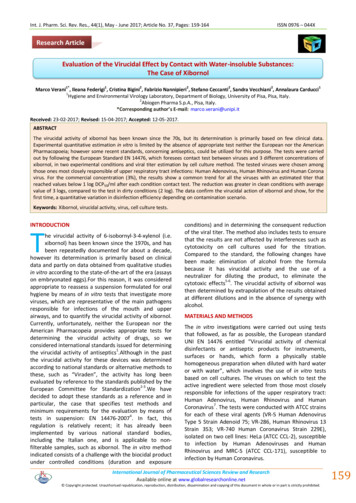
2the wall slip velocity and its dependence on the wood content,type of filler, and shear stress. According to literature [6,7], the wall slip effects are generally observed in the flowof highly viscous two-phase materials in rheometers, pipes,or any channel with smooth walls. Near the smooth, solidboundary, the local microstructure is depleted because thesuspended particles could not penetrate the solid walls. Liand Wolcott [5] also analyzed the extensional flow, findingthat the extensional viscosity is more dependent on the woodcontent than on the species. Mohanty and Nayak [8] studiedthe viscoelastic behavior of composites of HDPE and sisalfiber, also using capillary rheometry. They observed thatthe composites viscosity increased with the incorporationof fiber, a finding also reported by other researchers, andthat treatment of the polyethylene with maleic anhydridecaused an increase in the viscosity due to the better adhesion of the polymer matrix to the fiber, which was confirmed by scanning electron microscopy. Besides this, otherdynamic properties (storage modulus, 𝐺 , loss modulus, 𝐺 ,and tan delta 𝛿) also increased with cellulosic reinforcement.The objective of this study was to investigate the rheological behavior in a parallel plate rheometer of a totallyrenewable composite made of polyethylene derived fromethanol with different concentrations of added filler fromsponge gourd processing residue (10, 20, 30, and 40%wt).2. Experimental2.1. Raw Materials. The high density polyethylene (HDPE)SHC 7260 (Braskem, Brazil) was obtained from sugarcaneethanol. Its density is 0.959 g/cm3 and the melt-flow indexis 7.2 g/10 min (190 C; 2.16 g). The sponge gourd residue(cellulosic filler) was provided by the company BushingsBonfim, state of Minas Gerais, Brazil. This filler has densityof 1.3 g/cm3 , particle size of 0.15 mm, and moisture contentof 10.7% by weight.2.2. Composite Preparation. The HDPE composites with 10,20, 30, and 40%wt of sponge gourd residue were processedin a Tecktril model DCT-2 corotating interpenetrating twinscrew extruder. The cellulosic filler was conditioned beforeprocessing in an oven with air circulation for 24 hours at atemperature of 60 C. Before addition of the material in theextruder, the polymer and the milled filler were manuallypremixed. The extrusion conditions were as follows: rotatingspeed of 300 rpm; feeder rotation of 15 rpm; temperature inprocessing zone 1: 90 C, zones 2 to 5: 140 C, zones 6 to 9:160 C, and head: 180 C. The obtained pellets were heated at60 C to remove moisture.2.3. Composite Characterization2.3.1. Melt-Flow Index (MFI). Before performing this test, thesamples, in the form of pellets, were dried in an oven with aircirculation for 24 hours at 60 C. The melt-flow index (MFI)(ASTM D1238) [9] was measured in a Dynisco KayenessPolymer Test Systems model LMI 4003 melt indexer.International Journal of Polymer Science2.3.2. Melt Rheology. The oscillatory flow measurements,namely, the complex viscosity, 𝜂 , the storage modulus,𝐺 , and the loss modulus, 𝐺 , of the pure HDPE and itscomposites were determined in a TA Instruments rheometer,model AR 2000. A strain sweep test was initially conductedto determine the linear viscoelastic region of the materials.Dynamic frequency sweep test (strain: 0.3%; frequency: 0.1to 600 rad/s; and temperature at 170 C) was subsequently performed to determine the dynamic properties of the materials,using a parallel-plate geometry with 25 mm of diameter anda gap set at 0.5 mm.Stress relaxation experiments are the fundamental way inwhich relaxation modulus, 𝐺(𝑡), can be defined. The relaxingstress data are used to determine 𝐺(𝑡) directly,𝐺 (𝑡) 𝜏 (𝑡).𝛾0(1)The stress relaxation tests were conducted at a constantstrain of 0.3% and at a temperature of 170 C.2.3.3. Surface Morphology and Dispersion Characteristic. Themorphology of the samples was examined by SEM using aJeol model JSM-6510LV microscope. Gold sputtering of thespecimens fractured in the impact test was carried out usinga Denton Desk V vacuum sputter system. The samples werefractured at room temperature.3. Results and Discussion3.1. Melt-Flow Index (MFI). The melt-flow index (MFI) isa physical parameter that is widely used to evaluate theability of a polymer to flow when melted. The MFI value(Figure 1) declined as the sponge gourd residue concentrationincreased, due to the increased viscosity of the HDPE/fillersystem compared to the pure HDPE. With the addition of 10%by weight of cellulose, the MFI decreased by 19%, while for afiller content of 20%wt the decline was 43% and with additionof 40%wt the decrease was 83% in relation to the pure HDPE.By the rule of mixtures criterion [10], the addition of10%wt of cellulose filler should cause a decrease of 10%in the MFI, but this did not occur. Instead, the result ofthe property for this composition was 6.8 g/10 min (20%lower than for the pure polymer). Similar MFI behavior wasobserved by Mohanty and Nayak [11] for conventional HDPEcomposites obtained from petroleum and bamboo fiber.Cellulosic fillers are incompatible with the polymer matrixand have a tendency to form aggregates during processing[12], which might further impede the flow of the polymermatrix.3.2. Melt-State Rheology. Viscosity is one of the most commonly used parameters to investigate the behavior of polymermaterials during processing, since the majority of transformation processes occur in shear flows. The measure of storagemodulus (𝐺 ) and loss modulus (𝐺 ), which are related,respectively, to the energy stored and dissipated during acycle, is also widely used to study the processing of polymermaterials. The storage modulus depends on the rigidity of
International Journal of Polymer Science31010000008.41000006.864.84G , G (Pa)MFI (g/10 r (%wt/wt)60/4010Figure 1: Melt-flow index of composites of renewable HDPE andsponge gourd filler.10000110Frequency (rad/s)1001000HDPE 20% filler G HDPE 30% filler G HDPE 30% filler G HDPE 40% filler G HDPE 40% filler G Figure 3: Variation of the storage modulus, 𝐺 , and loss modulus,𝐺 , as a function of frequency for neat renewable HDPE and itscomposites containing different wt% of sponge gourd filler.1000100100.0110.12HDPE G HDPE G HDPE 10% filler G HDPE 10% filler G HDPE 20% filler G 100000G and G (Pa)100000.11Strain (%)HDPE G HDPE G HDPE 10% filler G HDPE 10% filler G HDPE 20% filler G 10100HDPE 20% filler G HDPE 30% filler G HDPE 30% filler G HDPE 40% filler G HDPE 40% filler G Figure 2: Strain sweep results for neat renewable HDPE and itscomposites containing different wt% of sponge gourd filler.the macromolecules and their entanglement, while the lossmodulus depends on the bonds, which control conformational changes in chain segments and the displacement ofone chain in relation to another [2]. In turn, the rheologyof composites is influenced by the interactions that occurbetween the polymer matrix and the filler, along with thestructure, size, and shape of the particles and the quality oftheir dispersion throughout the melted matrix [13–15].Strain sweep tests were conducted at 170 C in nitrogenatmosphere with a constant frequency of 1 Hz and in thestrain range of 0.01 to 100%. As it can be seen in Figure 2,the response of all samples does not depend on the strain(both 𝐺 and 𝐺 exhibit a constant plateau), and the behavioris well within the linear viscoelastic region. However, theplateau region shortens with higher cellulosic filler contentsin HDPE matrix, 30 and 40 wt%. It can also be seen that 𝐺 is dominating over 𝐺 for all composites analyzed, indicatingthat the overall behavior is dominated by viscous segmentalfrictions. The composite with 10 wt% of filler exhibits quitesimilar trend as neat HDPE. As filler content increases,the gap between 𝐺 and 𝐺 values decreases, showing thatviscous behavior becomes less pronounced with higher fillerloading in HDPE matrix and a tendency to a gradual switchfrom viscoelastic liquid-like to solid-like behavior occurs.From the above experiments, the strain was then set at 0.3%to ensure that the response of all materials would be withinthe linear viscoelastic region.Small amplitude oscillatory shear measurements wereperformed at 170 C and 0.3% strain. The dynamic moduli, 𝐺 and 𝐺 , are showed in Figure 3 for HDPE and HDPE/fillercomposites. The obtained behavior in frequency sweep is inaccordance with the results of strain sweep. In fact, HDPE andHDPE composites exhibit 𝐺 𝐺 in a wide frequency range,indicating that the materials present a pronounced viscousbehavior; however, as filler content increases, the gap between𝐺 and 𝐺 tends to decrease and a characteristic solid-likebehavior tends to occur.According to Jiang et al. [16], a homopolymer with narrow molecular weight distribution presents a characteristicterminal behavior of 𝐺 𝜔2 . In the present study, theneat HDPE did not deviate significantly from the standardterminal behavior, 𝐺 𝜔1.18 . As filler was added in HDPEmatrix, a deviation from 𝐺 𝜔0.96 for 10 wt% filler to𝐺 𝜔0.69 for 40 wt% filler was observed. This behaviorindicates a solid-like viscoelastic behavior as filler content isincreased. In other words, the addition of sponge gourd fillerin the HDPE matrix prevents a complete relaxation due tophysical jamming.The frequency at which 𝐺 and 𝐺 moduli curves crosseach other reflects the transition from viscous to elasticresponse of the viscoelastic melts [17].Table 1 shows the crossover point (𝐺 𝐺 ) and thefrequency values, 𝜔𝑐 , where these cross points occurred.The results show that a decrease of up to 20wt% of fillerin the HDPE matrix in the cross point and in the crossover
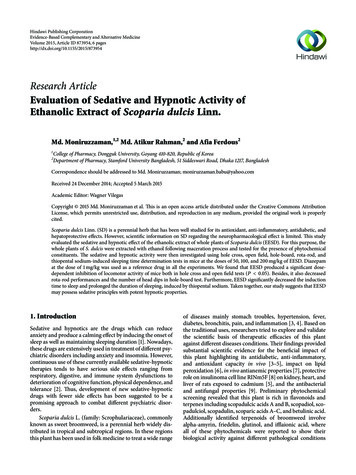
4International Journal of Polymer ScienceTable 1: Modulus and frequency values in the cross point 𝐺 /𝐺 forthe compositions analyzed.HDPEHDPE 10% fillerHDPE 20% fillerHDPE 30% fillerHDPE 40% fillerCross point,𝐺 𝐺 (Pa)𝜔𝑐 Relax modulus, G (Pa)Sample codes1.00E 061.00E 041.00E 031.00E 03100000Complex viscosity, 𝜂 (Pa·s)1.00E 051.00E 02Time (s)HDPEHDPE 10% fillerHDPE 20% filler1000010001.00E 01HDPE 30% fillerHDPE 40% fillerFigure 5: Variation of relaxation modulus with time for neatrenewable HDPE and its composites containing different wt% ofsponge gourd filler. The experiments were performed at a constantstrain of 0.3% in nitrogen atmosphere.10010110Frequency (rad/s)HDPEHDPE 10% fillerHDPE 20% filler1001000HDPE 30% fillerHDPE 40% fillerFigure 4: Variation of the complex shear viscosity as a function offrequency for neat renewable HDPE and its composites containingdifferent wt% of sponge gourd filler.Imaginary viscosity, 𝜂 (Pa·s)140010.112001000800600400200frequency values was observed. It indicates that materialswith more elastic behavior tend to be produced, but at thesame time the composites present a shear thinning behavioras frequency increases. As filler content was further addedto HDPE matrix (30 and 40 wt%) an increasing cross pointvalue was observed, while crossover frequency values stilldecreased. This behavior can be related to a characteristic ofsolid-like behavior more pronounced in these high load composites, as compared with the other compositions. Probablyit occurred due to the tendency to form aggregates duringprocessing when higher filler contents are present, whichmight further hinder the HDPE matrix flow, as mentionedbefore.The variation of the complex viscosity as a function offrequency (Figure 4) is another way to show these latestresults.Figure 4 shows that neat HDPE and 10 wt% filler composition present similar flow behavior in the whole frequencyrange analyzed. Only at low frequency values, the compositepresents a slightly higher viscosity values in relation to neatHDPE. When 20 wt% of filler was added, higher viscosityvalues were obtained, but a frequency-thinning characteristiccan also be observed, reaching similar flow behavior in005001000 1500 2000 2500 3000 3500 4000 4500Dynamic viscosity, 𝜂 (Pa·s)HDPEHDPE 10% fillerHDPE 20% fillerHDPE 30% fillerHDPE 40% fillerFigure 6: Cole-Cole representation of the viscoelastic properties ofneat HDPE and HDPE/filler composites.relation to the neat HDPE and 10 wt% filler composition athigher frequencies. Probably it occurred due to the fact thatup to 20 wt% of filler aggregates can disentangle, allowingpolymer chain to flow. However at higher filler contents,disentanglement processes become more difficult in thefrequency range analyzed and thus higher viscosity valueswere observed.The variation of the relaxation modulus with time isreported in Figure 5. The results show that 𝐺(𝑡) (𝐺(𝑡) 𝜎(𝑡)/𝛾0 ) of HDPE presents a behavior similar to a polymerwith high molecular weight and narrow distribution; thatis, a plateau zone appears in which the modulus is nearly
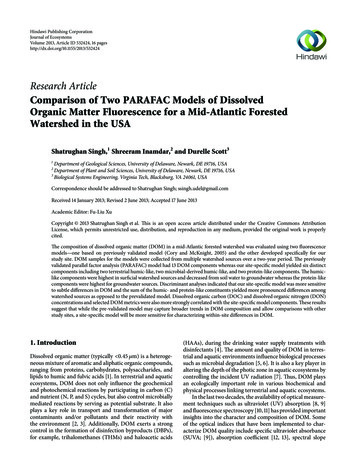
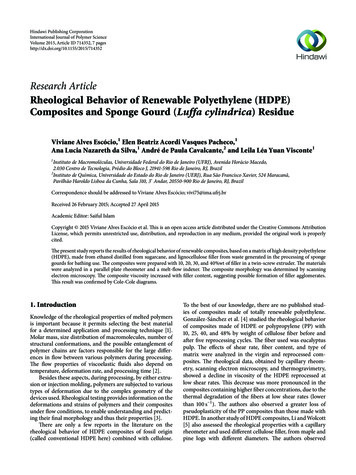
International Journal of Polymer t(e)(f)Figure 7: SEM micrographs of fracture surfaces for the following samples: sponge gourd residue with particle size 0.15 mm (a), renewableHDPE (b), and renewable HDPE/cellulosic filler composites: (c) 90/10%wt/wt, (d) 80/20%wt/wt, (e) 70/30%wt/wt, and (f) 60/40%wt/wt.constant. At longer times, flow occurs and the 𝐺(𝑡) curvemoves towards a “terminal zone,” where the modulus relaxesat sufficiently long times. For HDPE/filler composite with10 wt% filler a similar behavior is observed in relation toneat HDPE for long times. As filler was added in HDPEmatrix, 𝐺(𝑡) extends to long time and the magnitude of 𝐺(𝑡)value increases with the filler concentration. This behavioris another indication for the formation of filler aggregates(such as “temporary network”) when higher filler contents areadded, hindering the occurrence of relaxation processes. Ateven longer periods of time, the “network” disentangles anda decrease of 𝐺(𝑡) values is once again observed.Linear viscoelastic characteristics derived from the resultsof rheological measurements are also shown in a differentrepresentation in Figure 6, using the so-called Cole-Coleplots for HDPE and HDPE/filler composites. In this representation, the 𝜂 parameter (where 𝜂 𝐺 /𝜔), the so-calledimaginary viscosity, is plotted against dynamic viscosity, 𝜂 (where 𝜂 𝐺 /𝜔). The plot should be a perfect arc if higherorder structures are absent and the relaxation behavior ofthe melt can be described by a single relaxation time [17].According to Ábrányi et al. [18], studies on heterogeneoussystems in melts containing network, the elastic componentof viscosity (𝜂 ) increases and the structure has a largerrelation time.Data shown in Figure 6 indicate that the addition of fillerleads to an increase of the elastic behavior of the compositesand larger relaxation times can be observed as increasing fillerloads are added in HDPE matrix, indicating the presence offiller aggregates.
63.3. Morphology Analysis. Figure 7 shows scanning electronmicroscope (SEM) images of the filler alone, with particlesize smaller than 0.15 mm, pure HDPE, and composites.Figure 7(a) shows the irregularities of the sponge gourdfiller, which is characteristic of natural fibers. Figure 7(b)shows the fracture surface of the pure HDPE, with slightroughness, after being submitted to impact resistance test,conducted at room temperature, a factor that can explain thisroughness. Some displacement of fibers can be seen in Figures7(c) and 7(d), which increases on rising filler content, dueto the low adhesion of the polymer/filler interface. Finally,Figures 7(e) and 7(f) show the pull-out of the fillers and alsothe greater surface roughness of the composite w
specimens fractured in the impact test was carried out using a Denton Desk V vacuum sputter system. e samples were fractured at room temperature. 3. Results and Discussion. Melt-Flow Index (MFI). e melt- ow index (MFI) is a physical parameter that is widely used to evaluate the ability of