Transcription
Passwords, Heroin and Timelines: Forensics and Graph TheoryA Teaching Module for a Liberal Arts Math ClassBy:Lila Ghemri, Texas Southern University, ghemri lx@tsu.edu;Carol Gibbons, Salve Regina University, gibbonsc@salve.edu;Carol Overdeep, Saint Martin’s University, coverdeep@stmartin.edu
Note to teachers: Teacher notes appear in dark red in the module, allowing faculty to pull thesenotes off the teacher version to create a student version of the module.Synopsis of the Module:Thanks to the popularity and longevity of such television shows as “CSI” and “NCIS”, forensics and/orforensic science are common household words. The television shows tend to focus on solving crimesinvolving dead and/or missing victims and as a result, forensics tends to be equated with chemical andbiological lab work in the popular culture. Forensics runs a much larger gamut of disciplines, e.g.,accounting and digital security to name but two areas, and one of the purposes of this module is to alertstudents to the depth and breadth of the area. From a very simplified perspective, forensics consists oftwo steps: gathering facts and drawing conclusions.It’s imperative that these two things be viewed as disjoint activities. For the latter, graph theory can beused to help find patterns in the facts which lead to conclusions. The remaining two goals of thismodule are to provide students with the basics of graph theory and the ability to apply it to a variety ofsituations.Target Audience: The primary target audience includes undergraduates in a “Math for Liberal Arts”course. By increasing the complexity of subsequent examples, students in an undergraduate DiscreteMathematics course could also be targeted. Other appropriate audiences include introductoryComputer Science students and introductory Criminal Justice students.Prerequisites: None.Topics: The topics in this module include the introduction of forensics and basic graph theorydefinitions, the various types of graphs, the construction of graphs, and forensic applications.Goals: Our goals are to introduce students to a new structure for representing connections andinteractions between entities as well as enhanced critical thinking skills.Anticipated number of classes: 4 (50 minutes each)Learning Outcomes: Students will understand various types of graphs and the salient differencesbetween them, e.g., the difference between a simple graph and a directed graph; students will be ableto use graphs to model various situations; and students will (hopefully!) appreciate the connectionbetween math and the “real world” application of forensics.2
Notes to the TeacherWelcome to this module that uses graph theory to explore the broad area of forensics whileconcurrently developing new critical thinking skills. The material involves several in-class examples tomotivate both discussion and understanding of the underlying principles.This module will take between 3-5 days depending on the amount of time the instructor chooses tospend on the various topics. Lesson 1 consists of an overview of forensics. The important point to stress during this lesson isthe difference between facts and conclusions/judgments. The opening exercise provides anopportunity for students to make this distinction, but it bears repeating. Lesson 2 covers the some of the basic definitions of graph theory and how to construct graphs.This is neither a thorough nor rigorous treatment of these topics. The goal is to motivate thestudents’ intuition for graph theory and how it can be applied. Lesson 3 covers several applications of graph theory, including analyzing an ecosystem,determining influence within a group, determining where/how heroin was cut, passwordverification, and the “traveling salesman” problem. Lesson 4 introduces precedence graphs and their application to forensics.3
Lesson 1:Forensics OverviewBroadly speaking, forensic science is the analysis of traces of evidence (such as body fluids, glassfragments, footprints, drugs, etc.) left at the scene of a crime by the criminal, victim, or others. Theevidence may be used subsequently to either implicate or exonerate a person suspected of committingthat crime, or just to gain further insight into the incident. [1]Observation is a critical skill in forensics. The investigator must determine what evidence to collect andhow to collect it.Activity: Have students pair up and examine each other’s clothing, shoes, etc. Ask them to take notesabout what they observe, such as are the shoes comfortable? Do the clothes have won spots? Is thereany dirt on the shoes? This activity should take 3-5 minutes of observation followed by discussion. Afterone or two students have shared their observations, ask the class to distinguish between facts that wereobserved and conclusions that were drawn.Broad OverviewAs noted above, forensic science is the analysis of traces of evidence (such as body fluids, glassfragments, footprints, drugs, etc.) left at the scene of a crime by the criminal, victim, or others. Theevidence may be used subsequently to either implicate or exonerate a person suspected of committingthat crime, or just to gain further insight into the incident. [1]But forensic science involves more than just identifying traces of evidence – sometimes it isn’t obviousjust what a piece of evidence really is. Other important questions that need to be answered are:-How did the evidence come to be at the crime scene?From where did the evidence originally come?Who left it there?This suggests a natural role for statistics and mathematics, as these questions can only be answered interms of probabilities. So it is not surprising that the primary task of forensic statisticians and/ormathematicians is to evaluate any evidence found at a crime scene, so that his evidence can beappropriately presented to a jury in court.The word “forensics” is derived from the Latin forēnsis, meaning “of or before the forum.” [2]4
Romans charged with a crime meant presenting the case before a group of publicindividuals in the forum. Each side gave speeches presenting their side of the case.The best argument/delivery determined the outcome of the case. Modern usage isbased on: 1) a form of legal evidence, and 2) a category of public presentation.Brief History----Ancient world: no standardized forensic practices, relied on forced confessions and witnesstestimony.Early Recorded Cases:o Archimedes (287-212 BCE) developed a method for determining the volume of anobject with an irregular shape. Used law of displacement to determine whethersome silver had been substituted for gold by dishonest goldsmith in the making ofKing Hiero II’s crown.o First application of Medicine & Entomology to solve a crime attributed to book of XiYuan Lu (Washing Away of Wrongs) in 1248 (Song Dynasty). In account by Song Ci(1186-1249), murder of a person by a sickle was solved by investigator instructingeveryone to bring their sickles to central location. Investigator determined it was asickle by testing different blades. Flies eventually gathered on a single sickle,resulting in confession by murderer. The book also offers other advice onmethodologies, such as drowning (water in lungs) versus strangulation (brokencartilage).th16 Century:o Ambroise Paré, French army surgeon, systematically studied effects of violentdeath on internal organs.o Italian surgeons, Fortunato Fidelis & Paolo Zacchia, studied changes in occurred inbody structure as the result of disease (foundations of modern pathology).th18 Century:o Writings begin to appear on medical forensic topics.o Criminal investigation becomes more evidence-based, use of torture is curtailedand belief in witchcraft loses influence in court decisions and is gradually replacedwith rational procedure.o Lancaster, England (1784) John Toms was tried and convicted of murdering EdwardCulshaw with a pistol. A wad of paper pulled from Culshaw’s body is examined andmatches perfectly with a torn newspaper in Tom’s pocket.o Methods for detecting arsenic, etc. are developed by examining walls of victim’sstomach.th19 Century:o Poison detection methods continue to improve.o Ballistics is seen in cases for the first time using bullet comparisons by examiningflaws in bullets (Henry Goddard, Scotland Yard).5
ooAlphonse Bertillon created identification system based on physical measurements(forensic anthropology).Fingerprint collection, analysis, and identification is applied for the first time.Despite what is seen on “CSI” and other such television shows, there’s a surprisingly wide variety offields that play a role in forensics:--Biology:o Entomology: Time of Death, detection of drugs/poison, DNAo Botany: leaves, seeds, pollen found on body/sceneo Zoology: analysis of animal and human remainso Anthropology: identification/recovery of remainsPsychology: understanding legal principles/eye witnessChemistry: identifying unknown substances, originsEconomics: calculating pecuniary damages, discriminationAccounting: financial statement analysisStatistics: techniques applied to evidence (DNA , etc.)Computer Science: recovering digital data, cybersecurityPhysics: ballistics, tool marks, accident reconstructionCriminal Justice: instructing police in forensic methodsSociology: human behavior, history of area, negligenceMedicine: autopsy, cause of death/illness, whether torture was involvedMathematics:o Descriptive Statistics: Stride vs. gendero Linear Regression: Bone length vs. body heighto Geometry and Trigonometry: Blood spatter length vs. angleo Algebra: Fly larva cycle vs. time of deatho Genetic Probabilities: Blood typingo Newton’s Law of Cooling: Body temperature vs. time of deatho Algebraic formulas and graphs: Blood alcohol level over timeo Angles and measurement: Crime scene sketcho Data collection: Lyingo Algorithms and graph theory: Fingerprint analysisLet’s consider the time of death calculation. Forensic science presents several methods for estimatingthe time of death for when a person died. Different methods are used depending on how long it hasbeen since death occurred. Generally, the longer it has been since the death occurred, the less accuratethe estimation given by forensic pathologists. Some of the factors considered (depending on when thebody is found compared to when death occurred) include body temperature (Newton’s Law of Cooling);6
presence/absence of rigor mortis (valid for 0-36 hours after death); film over the eyes; skin color; bloodpooling; contents of the digestive system; and entomology.Newton’s Law of Cooling is a first-order, linear differential equation. The equation, givens, and steps tosolving the linear differential equation are contained in Table 1.Givens and Equations𝑑𝑢 𝑘(𝑢(𝑡) 𝑇𝑅 )𝑑𝑡k is a constantSolving the Linear DifferentialEquation𝑑𝑢 𝑘(𝑢(𝑡) 𝑇𝑅 )𝑑𝑡𝑑𝑢 𝑘 𝑑𝑡(𝑢(𝑡) 𝑇𝑅 )𝑑𝑢 𝑘 𝑑𝑡(𝑢(𝑡) 𝑇𝑅 )ln(𝑢(𝑡) 𝑇𝑅 ) kt C(𝑢(𝑡) 𝑇𝑅 ) 𝑒 𝑘𝑡 𝐶u(t) is the body temperature attime t𝑇𝑅 is the room temperatureu(0) is the body temperaturewhen the body is discoveredu(𝑡0 ) is the body temperature at𝑢(𝑡) 𝑇𝑅 𝑒 𝐶 𝑒 𝑘𝑡𝑡0Table 1. Newton’s Law of Cooling for a Dead Body.Solution𝑢(𝑡) 𝑇𝑅 𝐴𝑒 𝑘𝑡Table 2 shows the timeline for rigor mortis:Body TemperatureWarmLess warmColderColdTable 2. Rigor Mortis Timeline.Body StiffnessNot stiffStiffStiffNot stiffTime Since DeathDead not more than 3 hoursDead 3 to 8 hoursDead 8 to 36 hoursDead more than 36 hoursThe eyes of a victim can also hold answers to the time of death. A thin cloudy film develops over the eyewithin 3 hours after death has occurred. The eyeballs become softer as a result of less fluid pressurebehind the eye and the degree to which this has occurred can be used as a measure of the time sincedeath. This is a less common procedure for deaths that evidently occurred out of the limit of severaldays.The general formula for pressure, measured in Newton/m2 (a Pascal), is given byPressure Force/AreaBloodstain pattern analysis is the examination of the shapes, locations, and distribution patterns ofbloodstains, in order to provide an interpretation of the physical events which gave rise to their origin.The determinations made from bloodstain patterns at the scene or from clothing of principals in a casecan be used to:-Confirm or refute assumptions concerning events and their sequence:Position of victim – standing, sitting, lying, 7
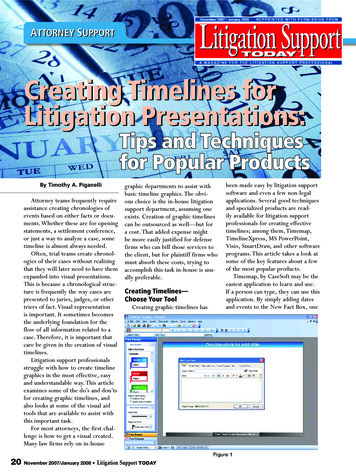
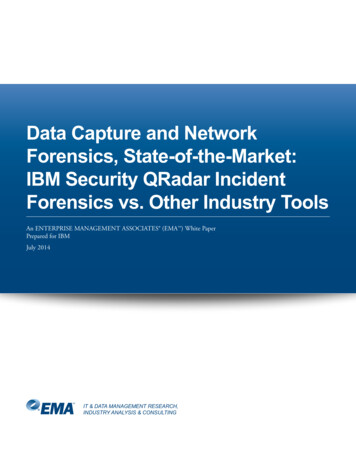
-Evidence of a struggle – blood smears, blood trails, Confirm or refute statements made by principals in the case:Several questions are considered during this phase of an investigation, including re stain patterns on asuspect's clothing consistent with reported actions? Are stain patterns on a victim or at the sceneconsistent with accounts given by witnesses or the suspect?There are three categories of blood spatter: passive, transfer, and projected. The passive categoryconsists of drops created or formed by the force of gravity acting alone. Within this category, there arefour subcategories: drops, drip patterns, pools, and clots.Transfer blood spatter is created when a wet, bloody surface comes in contact with a secondary surface.A recognizable image of all or a portion of the original surface may be observed in the pattern, e.g. handprint or shoe print. Subcategories are contact bleeding, swipe or smear, wipe, and smudge.Projected blood spatter occurs when an exposed blood source is subjected to an action or force, greaterthan the force of gravity. The size, shape, and number of resulting stains will depend primarily on theamount of force utilized to strike the blood source. The subcategories are: arterial spurt/gush –patterns resulting from blood exiting the body under pressure from a breached artery; cast-off stains –blood released or thrown from a blood-bearing object in motion; and, impact spatter – patterns createdwhen a blood source receives a blow or force resulting in the random dispersion of smaller drops ofblood (low, medium, high velocity).The angle of impact, the acute angle formed between the direction of the blood drop and the plane ofthe surface it strikes, provides a great deal of insight. Figures 1 and 2 come l-page-2.Figure 1. Blood droplet angle of impact.8
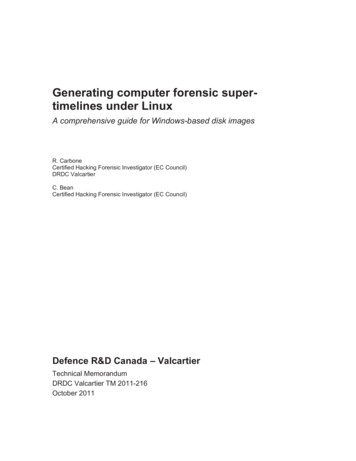
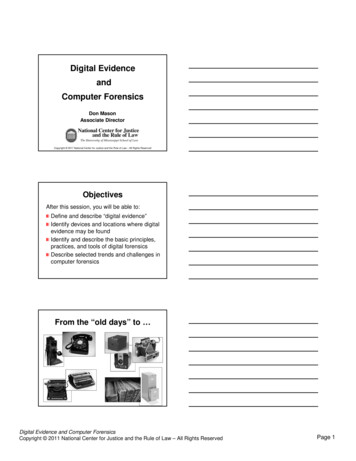
b c opposite (width) sin 1 sin 1 a b hypotenuse (length) Figure 2. Calculating the impact angle of bloodspatter.From http://wardsci.com/images/pdf/color blood spatter images.pdf, examples of various impactangles:Figure 3. Bloodspatter patterns as a function of impact angle.Picture citations or redraw –make surepictures are clear. Add brief homework set 19
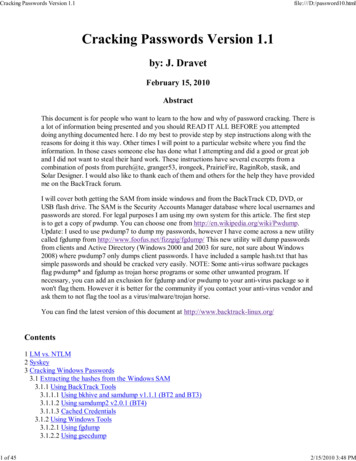
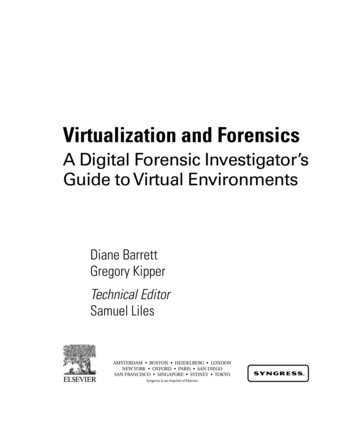
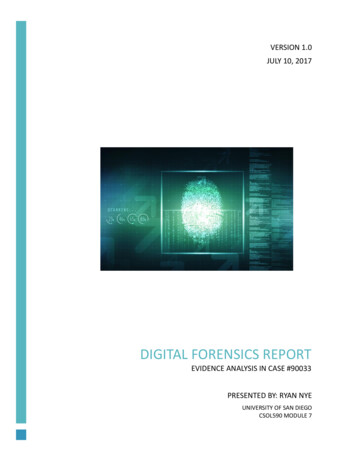
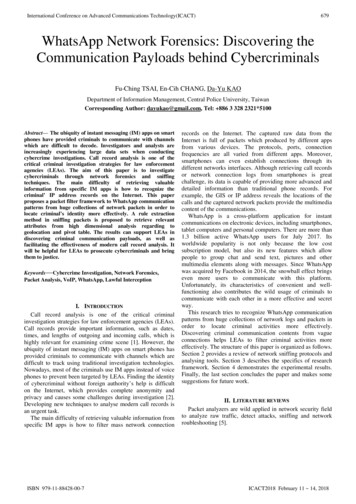
Homework for Lesson 11. Make measurements from the bloodspatter patterns in Figure 3 and verify that the listedangle is the correct angle.2. Table 1 showed the derivation for the time of death calculationusing Newton’s Law of Cooling. Use the internet to find possible value(s) of the parameters inthe equation, A and k.2. Suppose someone is murdered in a room where the thermostat is set to 98.6 F. Describe theimpact, if any, to the time of death calculation.Lesson 2:Graph Theory BasicsGraph theory has its roots in the eastern European city of Konigsberg. The city has four land masses andseven bridges as depicted in Figure 4 from http://photonics.cusat.edu/Article4.html.Figure 4. The City of Konigsberg.Residents wondered if it was possible to walk around the town crossing each bridge exactly once. This isa good exercise for students to try—it stimulates observation and conversation about some of the basicsof graph theory. In 1736, Leonhard Euler wrote a paper on this problem; this paper is considered theseminal paper on graph theory and showed that a route is not possible.A seemingly unrelated problem is the map coloring question: how many different colors are needed sothat no two adjacent regions have the same color? This question can be posed to the class as twospecific questions: first, how many colors are required for the United States; and second, how many fora map of the world. The US map comes from ften-require-long.html and the map of the world comes from http://www.mapsnworld.com/worldmap.html.10
Figure 5. Map of the United States and map of the world.These questions provide the students to engage with the concept. Students may be surprised to learnthat only four colors are required!These two problems are two of the classic problems in Graph Theory. Graphs can be a useful tool foranalyzing situations where there are links between entities:–Electrical networks–Telephone communication systems–Transportation networks–Computer data structures–Evolutionary trees in biology–Who is friends with who on FacebookDefinition: A graph consists of a collection of points, called vertices, connected by lines, called edges.Figure 6. Two different graphs.11
Graph (a) comes from tm and graph (b) fromhttp://commons.wikimedia.org/wiki/File:Graph theory tree.svg.Graphs (a) and (b) in Figure 6, above, are examples of simple graphs:–All of the edges are undirected, i.e., it is possible to go from a to e and e to a; from 2 to4 and from 4 to 2–None of the edges are loops, i.e., there are no edges from a vertex to itself–There is, at most, one edge between any pair of vertices, i.e., there is only one edgebetween a and eThese points can be illustrated in class with the following examples.Examples: For each of the following graphs, list the vertices, the edges, and the degree of each vertex.(a)(b)Figure 7. Example graphs.For Example (a) in Figure 7, which came from http://test2.wikipedia.org/wiki/Graph theory, thevertices are 1, 2, 3, 4, 5, 6; the edges are 64, 43, 45, 32, 25, 51, 21. The degrees of the vertices are 2, 3,2, 3, 3, 1, respectively. For Example (b) in Figure 7, which comes fromhttp://en.wikipedia.org/wiki/Loop %28graph theory%29, the vertices are 1, 2, 3, 4, 5, 6; the edges are11, 12, 15, 23, 25, 54, 34, 46, and the degrees are 3, 3, 2, 3, 3, 1 respectively.********Looks can be deceiving! In most math classes, there is a “right” answer to a question. When drawing agraph, the picture is not necessarily unique. This point can be illustrated by giving students a list ofvertices and edges, then asking each of them to draw a graph comprised of the vertices and edges.After the students have drawn their graphs, have students share their work.Example (a) Vertices: A, B, C, DEdges: AB, BC, BD, CD(b) Vertices: 1, 2, 3, 4, 5Edges: 23, 24, 44, 43, 35, 55, 53To further hone this skill, ask the students to determine whether the following two graphs are the same.Are the following graphs the same?12
Figure 8. Two “different” graphs.The answer is yes, but the pictures look substantially different!Undirected graphs have edges where there is no direction between the two vertices—in some respects,this can be thought of a street map where all of the streets go both directions. Directed graphs, as thename suggests, have a direction associated with the edge, and the edge is called an arc. Using the streetmap analogy, this would be akin to an area that has one-way streets: which way you travel on thatstreet definitely matters! Pictorially, arrows are put on the edges to indicate the direction of travelalong that particular edge.The following two graphs are examples of directed graphs. Figure 9(c) can be found /AppendixB4/GraphBasics.htm and Figure 9(d)originated at http://cse.iitkgp.ac.in/ abhij/course/lab/PDS/Spring04/ass6.html(c) Directed graph with a loop onvertex 4.(d) Directed graph without any loops.Figure 9. Examples of directed graphs.A multigraph has multiple edges between at least one pair of vertices. Multigraphs can be eitherdirected or undirected. Examples include13
Figure 10. Examples of multigraphs.Figure 10(e) came from m-21e-solution
4 Lesson 1: Forensics Overview Broadly speaking, forensic science is the analysis of traces of evidence (such as body fluids, glass fra