Transcription
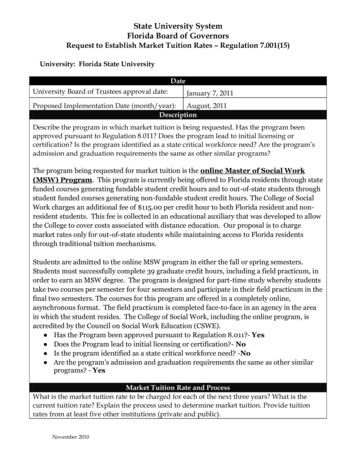
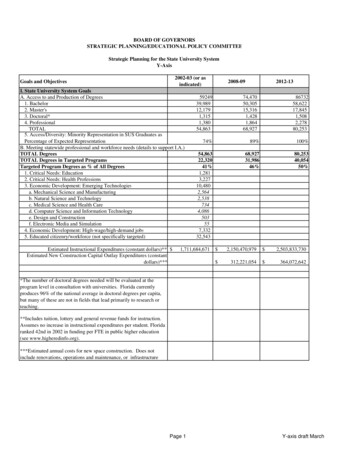
BOARD OF GOVERNORSSTRATEGIC PLANNING/EDUCATIONAL POLICY COMMITTEEStrategic Planning for the State University SystemY-Axis2002-03 (or asindicated)Goals and ObjectivesI. State University System GoalsA. Access to and Production of Degrees1. Bachelor2. Master's3. Doctoral*4. ProfessionalTOTAL5. Access/Diversity: Minority Representation in SUS Graduates asPercentage of Expected RepresentationB. Meeting statewide professional and workforce needs (details to support I.A.)TOTAL DegreesTOTAL Degrees in Targeted ProgramsTargeted Program Degrees as % of All Degrees1. Critical Needs: Education2. Critical Needs: Health Professions3. Economic Development: Emerging Technologiesa. Mechanical Science and Manufacturingb. Natural Science and Technologyc. Medical Science and Health Cared. Computer Science and Information Technologye. Design and Constructionf. Electronic Media and Simulation4. Economic Development: High-wage/high-demand jobs5. Educated citizenry/workforce (not specifically targeted)Estimated Instructional Expenditures (constant dollars)** Estimated New Construction Capital Outlay Expenditures 71 2,150,470,979 2,503,833,730 312,221,054 364,072,642*The number of doctoral degrees needed will be evaluated at theprogram level in consultation with universities. Florida currentlyproduces 96% of the national average in doctoral degrees per capita,but many of these are not in fields that lead primarily to research orteaching.**Includes tuition, lottery and general revenue funds for instruction.Assumes no increase in instructional expenditures per student. Floridaranked 42nd in 2002 in funding per FTE in public higher education(see www.higheredinfo.org).***Estimated annual costs for new space construction. Does notinclude renovations, operations and maintenance, or infrastructurePage 1Y-axis draft March
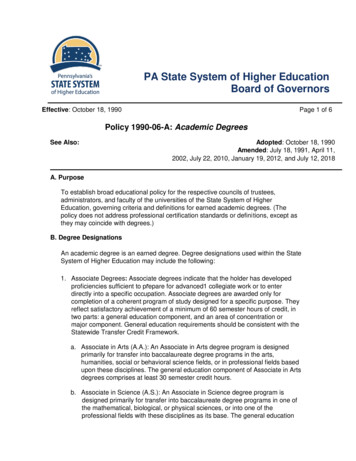
BOARD OF GOVERNORSSTRATEGIC PLANNING/EDUCATIONAL POLICY COMMITTEEStrategic Planning for the State University SystemY-AxisGoals and Objectives2002-03 (or asindicated)2008-092012-13Invitation /Application Startedfor Second2C. Building world-class academic research capacity1. Association of American Universities (AAU) membership (seeI.A.3, I.C.2, I.C.3, and I.C.5)12. Research expenditures - Contracts and Grants (Constant dollars) 1,158,481,0341,637,111,912 2,061,601,2182002-2003 survey ispending. Six out of36 out of 1463. National Research Council rankings (number of ranked programs62 in top 25% in Progress Indicated in programs ranked inin top 25% nationally)1992-93Related Measurestop 25% nationally4. Centers of Excellencea. Biomedical and Marine Biotechnology (FAU)X (2003-04)b. Photonics (UCF)X (2003-04)c. Regenerataive Health Biotechnology (UF)X (2003-04)d.- New Centers of Excellence.5. Other forms of national recognitionTOTAL 6NAS 4 (UF-3, FSU1)NAE 2 (UF-1, FAUa. Faculty Admitted to the National Academies in the last five1)yearsIOM 0811TOTAL 29(FSU-7, FAU-1, FIU1, UCF-3, UF-14,b. Highly Cited ScholarsUSF-3)4152TOTAL 1NOB 0c. Nobel Prizes, Pulitzer Prizes and MacArthur FellowshipsPUL 0awarded to faculty in last five yearsMAC 1 (FIU)12Page 2Y-axis draft March
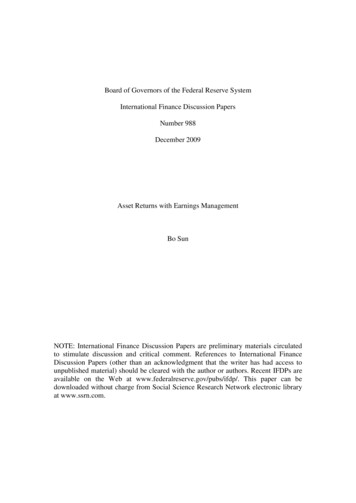
BOARD OF GOVERNORSSTRATEGIC PLANNING/EDUCATIONAL POLICY COMMITTEEStrategic Planning for the State University SystemY-AxisGoals and Objectives2002-03 (or asindicated)2008-092012-13II. Constituent University GoalsA. Access to and Production of Degrees1. Bachelors2. Masters3. Doctoral4. ProfessionalTOTAL5. Access/DiversityB. Meeting statewide professional and workforce needs (details to support II.A.)1. Critical Needs: Education2. Critical Needs: Health Professions3. Economic Development: Emerging Technologiesa. Mechanical Science and Manufacturingb. Natural Science and Technologyc. Medical Science and Health Cared. Computer Science and Information Technologye. Design and Constructionf. Electronic Media and Simulation4. Economic Development: High-wage/high-demand jobs5. Educated Citizenry/WorkforceTOTAL for II-B (should tie to total in II.A.1-4)C. Building world-class academic research capacity1. Association of American Universities (AAU) membership2. Research expenditures3. National Research Council rankings4. Centers of Excellence (specify)5. Other forms of national recognitionD. Meeting community needs and fulfilling unique institutional responsibilitiesPage 3Y-axis draft March
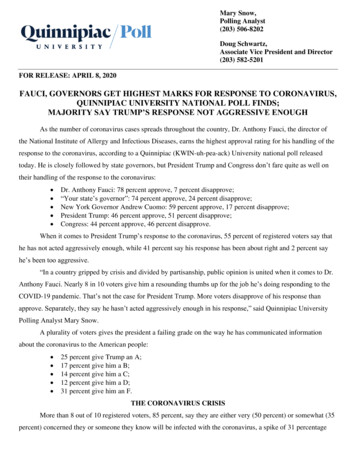
Accountability e of StudentAchievementEvidence of AccessState Board ofEducationApprovedRelatedUniversity SectorMeasuresRelated UniversitySector Measure:Number and percentof FTIC students whomake learning gainsas measured by anexternal assessmentaligned with aprevious assessment,or an exit test (yet tobe determined).Related UniversitySector Measure:Number and percentof students fromunderservedpopulations whoenroll in and whocomplete abaccalaureate degreeprogram.GoalStudent AchievementAccessIndicatorEvidence of StudentAchievementEvidence of AccessBoard ofGovernorsApprovedMeasuresPer the goals andnegotiated targets ofFBOG Strategic Plan,increase access to andproduction ofbachelor’s, master’s,doctoral, andprofessional degrees.Proportion of testtakers who passrequired licensure/certification examsPer the goals andnegotiated targets ofFBOG StrategicPlan, number andpercent of studentsfrom underservedpopulations whoenroll in andcomplete abaccalaureate degreeprogram.Employment andEarningsEvidence ofEvidence ofEmployment andProgression/ReadinessEarningsRelated UniversityRelated UniversitySector Measure:Sector Measure:Graduation rates for all Number and percent ofentering students based former students whoseon a 2-year and 4-yearearnings are withinexpectation; includeranges established asappropriate forprovision for studentswho transfer in and out baccalaureate degree;and for students whocategories and rangespersist.identified by decisionsof WorkforceEstimatingConference.Employment andArticulationEarningsEvidence ofEvidence ofProgression/Employment andReadinessEarnings4 and 6-year cohortPer the goals andbased graduation ratesnegotiated targets offor FTICs, andthe FBOG Strategic2 and 4-year cohortPlan, meet statewidebased graduation ratesprofessional andfor AA transfersworkforce needs in(or to be determined).education, the healthArticulationprofessions, economicdevelopment,emergingtechnologies, highwage/high-demandEfficiencyEvidence of Return onInvestmentRelated UniversitySector Measure:Show university returnon investment as a ratioof the educationaloutcome represented byearning a degreedivided by the moneyused to achieve thelearning outcome.EfficiencyEvidence of Return onInvestmentPer the goals andnegotiated targets of theFBOG Strategic Plan,building world-class,academic researchcapacity and nationallyrecognized programs asdemonstrated byAssociation ofAmerican Universitiesmembership, research,National ResearchCouncil rankings,
Accountability catorEvidence of StudentAchievementEvidence of AccessEvidence ofProgression/Readinesswithin a timeframeappropriate to thediscipline.Employment andEarningsEvidence ofEmployment andEarningsjobs, and an educatedcitizenry.EfficiencyEvidence of Return onInvestmentCenters of Excellence,or other forms ofnational recognition.Research expendituresfrom external sourcesper state-funded rankedfaculty member.“Academic nfor the FloridaBoard ofGovernors
STATE UNIVERSITY SYSTEM OF FLORIDASTRATEGIC PLAN METHODOLOGYY-AXIS GOALS AND INDICATORSBoard of Governors Strategic Planning CommitteeJohn Dasburg, ChairDRAFT FOR CIRCULATIONMARCH 2004
I. State University System GoalsI.A. Access to and Production of DegreesI.A.1. Bachelor DegreesIn December 2002, the Commissioner’s Higher Education Funding Advisory Councilrecommended that Florida seek to reach the national average in number of bachelor degreegraduates per capita. The recommendation reflected concern that Florida’s low ranking (45thamong the states) in per-capita bachelor graduates reflected inadequate access to four-yeareducation. While not everyone should be expected to complete a bachelor degree, the Councilbelieved the national average would be a reasonable, though challenging target to set for longterm planning. For further background on the Council’s recommendations, lt.asp/.I.A.1-4. Bachelor, Master’s, Doctoral, and Professional DegreesThe targets in I.A.1-4 extend this reasoning to graduate degrees as well. The 2012-13 goals areall based on projections of the national average degrees per capita. Key data, assumptions andcalculations used to arrive at the targets include:Projected U.S. Population age 18-44 in 2013: 109,708,000. U.S. Census Middle SeriesProjections. See atproj.html/Projected U.S. Degrees Awarded in 2012-2013:Bachelor:Master’s:First National Center for Education Statistics, Projections of Education Statistics to 2013, MiddleSeries Projection. See: http://nces.ed.gov/programs/projections/Given these projections, degrees per 100,000 population nationally in 2012-13 would be:Bachelor:Master’s:First Professional:Doctoral:1,3755078743Projected Florida population age 18-44 in 2013: 6,307,817. Office of Economic andDemographic Research, Florida Total Population by Age, Race, and Gender: April 1 19702025. See http://www.state.fl.us/edr/population.htm/
At the national average rate per capita, Florida’s share in 2012-13 would therefore be:Bachelor:Master’s:First Professional:Doctoral:86,73231,9815,4882,712This analysis assumes that the State University System’s share of degrees awarded wouldremain constant.State University System degrees granted:BachelorMaster’sFirst ProfessionalDoctorateGrand 63Although the baseline for planning is 2002-2003, the most recent year for which data areavailable on degrees awarded by private institutions is 2001-2002:Private Institution Degrees Granted in Florida, 2001-2002Private NonProfitPrivate ForProfitTotalBachelorFirstMaster’s Professional 51,8821761,015Source: IPEDS (Integrated Postsecondary Education Data Set) Peer Analysis System. Seehttp://nces.ed.gov/ipeds/Applying the system’s share of all degrees granted (public private) in 2001-02 to the 20122013 combined target yields:Bachelor:Master’s:First Professional:Doctoral:67.6% x 86,73255.8% x 31,98141.5% x 5,48855.6% x 2,712 58,62217,8452,2781,508Reaching these targets would require the following annual growth rates in degrees granted from2002-2003:
BachelorMaster'sDoctoralProfessionalAll Degrees4.34%4.34%1.53%5.73%4.32%Cost EstimatesMore detailed estimates of costs will be needed in the final strategic plan but cannot be madeuntil universities have submitted their own projections. The numbers and methodologies for thecurrent system-level estimates are for discussion purposes only.Estimated Instructional CostsThe total full instructional costs from the 2002-2003 SUS Expenditure Analysis was divided bythe total number of degrees produced in 2002-2003 to generate an estimated cost per degree.This cost per degree can be used as a benchmark of total full instructional costs that may beincurred to achieve the targeted degree production in the out years. It is not adjusted forinflation, so as expenses rise, cost-per-degree will also rise.Costs may also change as a result of quality improvement initiatives, changing emphasis indegree programs or changing ratios of upper-division, lower-division, and graduate instruction.Estimated Capital Outlay CostsPreliminary projections of enrollment assume that enrollment will grow in proportion to bachelordegrees at the undergraduate level, and to doctoral, professional, and master’s degrees at thegraduate level. This would yield 241,948 FTE students by 2012-13 with Net Assignable SpaceNeeds, using the current formulas, of 31,420,335 square feet. This is 12,528,235 more squarefeet than currently available. Total project costs to complete the additional square feet neededare estimated at 2,823,878,903 using December 2002 construction costs.This amount has been distributed in proportion to the annual FTE increases projected from 200405 to 2012-13.These figures represent the estimated expenditures needed. Because of the long-term nature ofcapital projects, however, appropriations for these expenditures might need to occur severalyears in advance.In addition to the need for additional assignable square feet, there would also be additionalinfrastructure, renovation and maintenance needs to accommodate the growth.
I.A.5. Access/DiversityThere are many forms of diversity to which individual institutions and the system need to beattentive. The broad measure on the Y-axis is the ratio of the representation of historically underrepresented minorities (Black, Hispanic, and Native American) among SUS graduates (27.3% ofgraduates, excluding non-resident aliens and ethnicity unknown graduates, in 2002-2003) to theirrepresentation in the total18-44 year-old population (36.8% in 2003). In 2002-2003, this ratiowas: 27.3 divided by 36.8 74.3%. If minority graduates were as well represented as they are inthe total population, this figure would be 100%, which is the target for 2012-13.This broad analysis needs to be broken down at various points in the degree pipeline. Thefollowing tables illustrate admissions, enrollment and completion gaps throughout the SUSpipeline. There are differences in how race and ethnicity are categorized in different datasources, but the overall patterns and discrepancies are still evident.2003 Florida Population Age 18-44 (Census Middle Series)Asian NonHispanic2.0%Black an NonHispanic0.3%WhiteNonHispanic63.3%U.S. Census Population Projections. s/natdet-D1A.html/Florida Public High School Graduates (Standard Diploma), 2002-2003Asian/Pacific Black cial0.8%Florida Department of Education Statistical Brief, High School Graduates 2002-2003. ates.pdf/
Summer/Fall 2003 SUS Admitted Students by Race/EthnicityFirst-Time-In-CollegeCommunity CollegeTransferOther TransferFirst ProfessionalGraduate (Incl. PostBaccalaureate)All AdmittedAsianPacificIslander Black4.6%16.7%IndianAlaskanHispanic .7%0.6%0.8%Summer/Fall 2003 SUS Applicants by Race/EthnicityFirst-Time-In-CollegeCommunity CollegeTransferOther TransferFirst ProfessionalGraduate (Incl. PostBaccalaureate)All ApplicantsIndianAsianAlaskanPacificIslander Black Hispanic Native4.1%18.9% 0.9%3.4%3.5%7.8%11.1% 14.3%12.8% 11.0%9.3% 1%2.0%2.6%3.7%7.8% 6.9%13.9% 11.5%0.2%0.3%32.2%10.5%49.6%59.1%0.6%1.0%Fall 2003 SUS Enrollment by Race/EthnicityTotalTotal UndergraduateTotal GraduateFreshmanSophomoreJuniorSeniorBeginning GraduateAdvanced panic 1.6%2.4%
2002-2003 SUS Degrees Granted by Race/EthnicityBachelorMaster’s andEquivalentFirst ProfessionalDoctorateGrand 12.8%IndianAlaskanHispanic %70.4%63.4%63.2%Other Access/Diversity IssuesIn addition to the broad issues of race and ethnic representation, there may be diversity issues atthe program or institution level that differ from the larger patterns statewide. There will also beother diversity problems—in terms of geography, gender, age, disability status, familybackground, etc.—that institutions should identify and plan to address. Each institution’s planshould enumerate its unique diversity goals and issues as well as its contribution to the objectiveof reducing the statewide minority educational attainment gap.I.B. Meeting statewide professional and workforce needsIn addition to serving students, universities also serve the state’s employers by providing aneducated workforce. The State University System and individual universities need to plan bothfor the predictable needs of the state today and for the harder-to-anticipate needs of the future.We know, for example, that we need more teachers and nurses, and we can quantify thosedemands fairly well. We also know, although it is harder to quantify, that the kinds of businesseswe want to bring to or start in Florida will need a range of creative, educated workers who, inaddition to the specific training they may have, can also think critically, communicate well, workcollaboratively, compute accurately, and solve problems in creative ways. Florida can learn fromareas where new industries have thrived, places where education tends to run broad and deep:Boston, Austin, Chicago, Atlanta, North Carolina’s Research Triangle, and California’s BayArea.The specific technologies students will work with ten years from now have probably not yet beeninvented, which is why the targeting process has to be flexible. Some degree programs will beclosely linked to occupations: nursing, law, surveying, etc. Others are difficult to tie to particularjobs but rather have a broad range of possibilities, either directly or by way of feeding intograduate programs: mathematics, business, industrial engineering, psychology, etc.The methodology below is a first attempt to group programs for whose graduates specificemployers and the broader business and education communities believe demand will be highestin coming years. It will need to be revisited regularly, as economic conditions change and newtechnologies develop. It is based on data used for Targeting Baccalaureate Degree Programs forFlorida Workforce Enhancements, a report submitted to, and adopted by, the Workforce
Estimating Conference in 2001, which was updated and expanded to include graduate andprofessional programs.The 2001 report identified baccalaureate degree programs that could be expected to have highdemand for at least one of three reasons. Programs either:met critical state needswere identified by the Advisory Group on Emerging Technologies as being important tocontinued high-tech industry development in the state; and/orhad a record of placing graduates in high-wage positions.The strategic plan’s goal is that half of all degrees be in targeted programs (up from 41% in2002-2003), which will require that those programs grow at a rate 40% faster than the averageannual growth rate for all programs. This rate of growth for targeted programs also allows forgrowth, although at a slower rate, in other degree programs.BachelorMaster'sDoctoralProfessionalAll sGrowt
Photonics (UCF) X (2003-04) c. Regenerataive Health Biotechnology (UF) X (2003-04) d.- New Centers of Excellence. 5. Other forms of national recognition TOTAL 6 NAS 4 (UF-3, FSU 1) . Masters