Transcription
State ofKANSASFY 2000Department of AdministrationDivision of Personnel Services
IntroductionThe Division of Personnel Services is pleased to present the fourthannual State of Kansas Workforce Report.The Fiscal Year 2000 report presents financial facts and statistics,employment and agency trends and characteristics of the Kansas stategovernment workforce. The report provides information from both statewideand agency perspectives. The purpose of the report is to provide usefulfact-based data for human resource planning and decision-making.The size of the state workforce has declined by more than 11% sinceFiscal Year 1995. The reduction, in large part, is the result of the Governor’sinitiative for state agencies to find ways to reduce the size of state governmentand agency program changes. Due to the decline, the State of Kansas, asother employers, must continue to improve services with fewer employees.To meet our goals, our efforts will focus on the necessity to attract andretain a quality workforce through new and revised programs.The Division of Personnel Services has enhanced its ability to conductworkforce analysis due, in large part, to use of the Statewide Human Resourceand Payroll system (SHARP) and the Microsoft Access database software.SHARP is an integrated database which provides information that enablesstate agencies as well as the legislature to make proactive human resourcedecisions based on detailed information. Data regarding retirementprojections, turnover assessments and recruitment analyses are included inthis report.The information presented in this report was gathered from SHARP; annualreports containing KIPPS (Kansas Integrated Personnel and Payroll System)data for Fiscal Year 1995; information published by the Division of Budget,State of Kansas; Kansas Department of Human Resources; and the U.S.Census Bureau.The Division of Personnel Services welcomes your comments or questionsregarding this report. You may contact us at (785) 296-1844 or by e-mail atworkforce.planning@state.ks.us.
STATE OF KANSASFISCAL YEAR 2000STATISTICAL HIGHLIGHTSPROFILE OF CLASSIFIED AND UNCLASSIFIED EMPLOYEESNumber of GES45 yearsAVERAGES45 yearsLength of Service12 years11 yearsAnnual Salary 28,842 50,416Percent Ethnic Minorities12.211.5Source: SHARP 5-31-2000; Excludes legislators, temporary and student employees.GENERAL KANSAS STATISTICS COMPARED TO OTHER U.S. STATESKansas Population2,654,052Rank out of 50 statesPopulation32ndNumber of State Employees Per 10,000 Population25thAverage Annual State Workers’Salary29thComments: The Kansas population estimate is taken from the U.S. Bureau of the Census estimates dated July1, 1999. The rank of state Employees Per 10,000 Population and Average Annual State Workers’Salary rankwere derived from the most recent information from the U.S. Bureau of the Census. The Bureau includes datas finance or payroll office but also those of independentnot only from the Central records of a government’educational institutions, semi-autonomous boards, special authorities, and may include city and countygovernments.
Table of ContentsKansas State Government FunctionsNumber of Positions by Government Function13SECTION 1 - WORKFORCE CHARACTERISTICSState Number of State Government Employees Percentage of Full-Time and Part-Time Classified Positions Classified Employees by County of Work Classified Employees Aging Trends Classified Employees by Age Group Classified Employees by Annual Salary Classified Employees by Years of ServiceAgencies Number of Classified and Unclassified Employees by Agency Average Classified and Unclassified Salaries by Agency Number, Salary, Age and Years of Service of ClassifiedEmployees by Agency Number, Salary, Age and Years of Service of UnclassifiedEmployees by Agency Positions by Agency4SECTION 2 - WORKFORCE TRENDSRecruitment Recruitment Analysis Average Number of Days to Fill a Vacancy by Job Category Job Classes with the Highest Average Number of Applicants Appointment of Classified Employees by Agency Vacancies by Gender and Ethnic GroupTurnover Information Technology Bonus Program Turnover by Classified Job Class and Agency Turnover by ReasonRetirement Retirement Analysis Workforce Trends Job Classes with the Highest Number of Retirements Agencies with the Highest Number of Retirements Projected Retirements by Classified Job Class and Agency Terminations by Years of Service Separation of Classified Employees by 7383940
Table of ContentsContinuedSalaries Average Salaries for Classified Employees vs. Central States Average Classified Salary for Central States Employment and Average Salaries in All State and Local GovernmentsOccupational Categories Most Populous Classified Job Class and Agency Occupational Categories of Classified Employees by Gender,Average Age, Salary, and Years of Service Occupational Category ComparisonEthnic Distribution The Ethnic Distribution Comparision of Classified Employee Workforce andKansas Employed Labor Force Appointments, Promotions, and Separations by Ethnic Group Ethnic Distribution of Classified Employees by AgencyLeave Usage Classified Employees Vacation Leave Use by Agency Unclassified Employees Vacation Leave Use by Agency Classified Employees Sick Leave Use by Agency Unclassified Employees Sick Leave Use by Agency Shared Leave5254565860REFERENCES Glossary Legislative Summary Classified Service Position Reference Table Unclassified Service Position Reference Table62646768424344454647484950
Kansas State Government FunctionsPublic Safety agencies’goals are to preserve thesecurity and safety of Kansas citizens.General Government agencies provide overall policyguidance to state government, perform generaladministrative services to all state agencies, collect anddistribute state revenues and carry out regulatoryfunctions.Agency Number and Name034Adjutant General355Atchison Juvenile Correctional Facility325Beloit Juvenile Correctional Facility521Corrections, Department of195El Dorado Correctional Facility177Ellsworth Correctional Facility206Emergency Medical Services Board234Fire Marshal, State280Highway Patrol313Hutchinson Correctional Facility083Investigation, Kansas Bureau of350Juvenile Justice Authority400Lansing Correctional Facility408Larned Correctional Mental Health Facility412Larned Juvenile Correctional Facility581Norton Correctional Facility147Ombudsman for Corrections523Parole Board, Kansas626Sentencing Commission, Kansas660Topeka Correctional Facility319Topeka Juvenile Correctional Facility712Winfield Correctional FacilityAgency Number and Name028Accountancy, Board of173Administration, Department of082Attorney General094Banking Department100Barbering, Board of102Behavioral Sciences Regulatory Board122Citizens’Utility Ratepayer Board300Commerce and Housing, Department of143Corporation Commission, Kansas149Cosmetology, Board of159Credit Unions, Department of167Dental Board, Kansas247Governmental Ethics Commission252Governor, Office of the105Healing Arts, Board of270Health Care Stabilization Board of Governors058Human Rights Commission, Kansas328Indigents’Defense Services, Board of331Insurance Department349Judicial Council677Judiciary365Kansas Public Employees Retirement System360Kansas, Inc.422Legislative Coordinating Council540Legislative Division of Post Audit425Legislative Research Department428Legislature446Lieutenant Governor, Office of the450Lottery, Kansas204Mortuary Arts, Board of482Nursing, Board of488Optometry Examiners, Board of531Pharmacy, Board of553Racing and Gaming Commission, Kansas543Real Estate Appraisal Board, Kansas549Real Estate Commission, Kansas565Revenue, Department of579Revisor of Statutes622Secretary of State625Securities Commissioner, Office of the670State Treasurer562Tax Appeals, Board of663Technical Professions, Board of371Technology Enterprise Corporation, Kansas700Veterinary Examiners, Board ofEducation includes state support of primary,secondary, higher education, and other educationagencies.Agency Number and Name604Blind, School for the610Deaf, School for the652Education, Department of379Emporia State University246Fort Hays State University288Historical Society359Kansas Arts Commission367Kansas State University683KU Medical Center434Library, State385Pittsburg State University561Regents, Board of682University of Kansas715Wichita State UniversityTransportation is a single agency function that isresponsible for the maintenance and improvement ofthe 10,000-mile state highway system.Agency Number and Name276 Transportation, Kansas Department of1
Kansas State Government FunctionsAgriculture & Natural Resources agenciespromote, protect, and restore natural resources inKansas. This includes agricultural product regulationand inspection; inspection of livestock facilities andmonitoring the status of the environment; maintenanceof state parks, state fishing lakes, and wildlife areas;conservation and management of soil and waterresources; environmental protection; commodityinspections; public health maintenance through controlof infectious disease; and promotion of Kansas wheatproducts.Human Resources agencies provide a wide range ofservices to Kansans, including job training andplacement; payment of unemployment insurancebenefits; veterans’counseling and care; preventivehealth services through aid to local health departments;and social services to elderly and disadvantagedcitizens.Agency Number and Name039Aging, Department on261Guardianship Program, Kansas264* Health and Environment— Health296Human Resources, Department of410Larned State Hospital363Neurological Institute, Kansas494Osawatomie State Hospital507Parsons State Hospital and Training Center555Rainbow Mental Health Facility629Social and Rehabilitation Services694Veterans Affairs, Commission onAgency Number and Name046Agriculture, Department of055Animal Health Department373Fair, Kansas State264* Health and Environment — Environment634State Conservation Commission709Water Office, Kansas391Wheat Commission, Kansas710Wildlife and Parks, Department of*Programs within the Department of Health and Environment are divided between two functions.s Budget Report with Legislative Authorizations.Source: Fiscal Year 2000 Comparison Report, The Governor’2
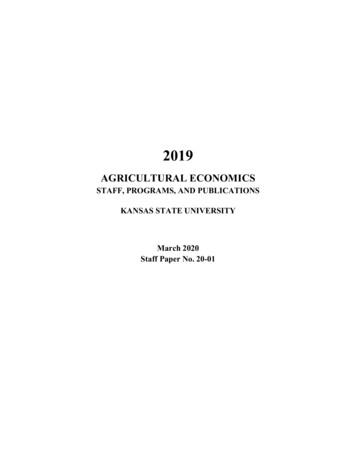
Number of Positions by Government Function(FTE and Unclassified Temporary Postitions)1,460.2Agricultureand 323.59,437.28,909.89,001.84,931.65,020.0FY 95FY 96FY 97FY 98FY 99FY mments: The largest decrease of positions occurred in the Human Resource function with a decrease of14% since 1995. This decrease is largely due to the closure of Winfield and Topeka State Hospitals in 1997.The Public Safety function was the only function with an increase in positions since Fiscal Year 1995.Source: Fiscal Year 2000 Comparison Report, The Governor’s Budget Report with Legislative Authorizations.3
Workforce CharacteristicsSection One of this report illustrates employment data encompassing asix-year period. The data provides information using statewide and agencyperspectives. The following comments are in regards to classified stateemployees only. The number of employees in the 50-59 age category increased 6%since 1995, while the number of employees in the below 30 age categorydecreased 18% during the same time frame.SECTIONONE Similar trends are occurring in the annual salary categories. The numberof employees earning over 40,000 has increased 48% since 1995.Those earning between 10,000 and 19,999 have decreased 49%since 1995. Since 1995, there has been a 29% increase in thenumber ofemployees with 20-29 years of service. Conversely, the number ofemployees with 5-9 years of service has decreased 35% since 1995.The number of employees earning less than 10,000 annually haveremained constant at less than 1% of total employees for the past fiveyears. The number of part-time employees has remained fairly constantfor the last four years declining by only 1%.4
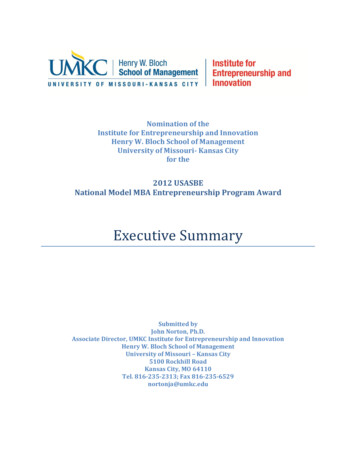
Number of State Government Employees45,00040,00035,00012,44712,89330,000( 4%)13,15512,995( 2%)(-1%)11,96112,139(-8%)( 525,36610,0005,0000FY 95 (41,249)(-5%)(-4%)(-3%)(-3%)(-1%)FY 96 (40,143)FY 97 (39,210)FY 98 (38,361)FY 99 (36,616)FY 00 (36,593)UnclassifiedClassifiedComments: The number of classified and unclassified employees has decreased by 11.3% since the end ofFiscal Year 1995. The percentages noted in parentheses reflect the percentage of change from the previousfiscal year. Facility closures, the Retirement Reduction program and program privatization have contributed inlarge part to the decrease in the number of state employees.Source: Fiscal Year 2000 Comparison Report, The Governor’s Budget Report with Legislative Authorizations.5
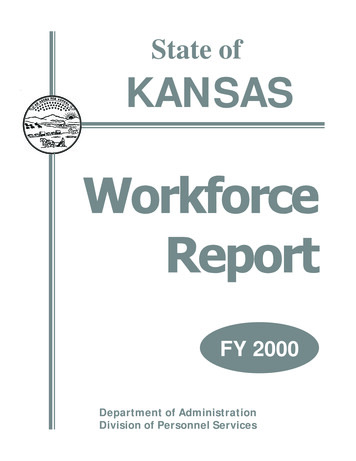
Percentage of Full-time and Part-time Filled Classified Positions93%7%FY 199595%96%96%5%4%4%FY 1996FY 1998FY 199797%3%FY 199997%3%FY 2000Full timePart timeComments: Prior to Fiscal Year 1996, 646.7 classified intermittent (.49 FTE) positions existed in state service.These intermittent positions were not reflected in the FTE position count for the state. To more accuratelyreport the size of the state workforce, these positions were converted during Fiscal Year 1996 to FTE positions,thus counting toward the state workforce totals.Source: Prior annual reports KIPPS data; SHARP (5-31-2000).6
Classified Employees by County of ars 88141414128121312101111 29,346 28,454 26,934 24,993 30,536 28,941 29,551 27,376 28,761 27,642 28,385 26,335 26,786 29,525 27,897 29,003 25,586 27,037 27,277 27,437 29,105 28,360 25,245 27,354 27,636 25,765 28,571 29,791 26,444 28,615 27,108 27,111 28,241 25,960 27,182 24,697 28,046 26,493 25,328 27,894 25,337 23,204 27,242 30,905 29,156 29,766 26,091 28,671 31,196 26,487 23,171 26,168 74366725611411515112505721291119223381247AgeYears 01112171212131281211101212 28,175 28,237 26,470 28,474 28,296 30,223 28,545 26,914 26,512 29,052 26,308 26,053 26,884 32,233 26,720 28,010 28,949 27,339 26,618 26,012 28,802 28,814 30,590 26,461 28,513 28,550 27,404 25,227 28,459 29,628 28,667 29,653 28,457 27,463 27,720 32,731 25,887 26,072 25,199 32,178 15,558 24,792 28,610 29,166 28,322 26,943 24,346 26,071 25,043 29,068 28,551 27,220Comments: Several counties may face a drastic increase in turnover during the next five to ten years due to theiremployees’increasing years of service and age. Recruitment/employee development initiatives should be designedand implemented to reduce the disruption caused by these vacancies. The average classified state employee is 45years of age with 12 years of service and earns 28,842 annually.Source: SHARP (5-31-2000); Excludes unclassified, temporary and student employees.7
20%25%30%35%40%45%27%33%32%26%40%FY 9541%FY 94Fiscal Year25%35%34%24%40%FY 9742%FY 96FY 1994 to FY 2000Classfied Employees Aging TrendsSource: Fiscal Year 2000 Comparison Report, The Governor’s Budget Report with Legislative Authorizations.Comments: Almost two-thirds of the current classified state workforce is age 40 and above.Age 50 Under Age 40Percentage of State Workforce26%28%35%37%39%35%FY 99FY 9829%35%36%FY 00
ow 3030-3940-4950-59Over 60Source: Prior annual reports KIPPS data; SHARP (5-31-2000); Excludes unclassified, temporary and student employees.Comments: The number of classified employees in the 40-49 and 50-59 age groups had the greatest change with a total increase of 6% since 1995.The number of classified employees in the below 30 and 30-39 age groups decreased by a total of 4% since 1995. This trend is expected to continue overthe next several years increasing our focus on recruitment and retention efforts to ensure a productive state workforce.12%28%33%34%Classified Employees by Age Group
849%10%16%24%FY9947%13%16%25%FY0046%13% 10,000-19,999 20,000-29,999 30,000-39,999 40,000Source: SHARP (5-31-2000); Excludes unclassified, temporary and student employees.Comments: The number of classified employees falling within the 10,000- 19,999 and 20,000- 29,999 salary category has decreased 12% and 2%respectively since 1995. The number of classified employees in the 30,000- 39,999 and over 40,000 salary categories have experienced increases of7% since 1995. Factors influencing changes include minimum wage and cost of living increases, annual step movement increases and promotions. Theunder 10,000 category was intentionally excluded from this chart due to the low numbers of employees (less than 1%).28%48%Classified Employees by Annual Salary
1127% 27% 27%Below 5 Years28% 28%26%24%23%21%5-9 Years25%19%29%10-19 Years34%33%11%14%20-29 Years12%13%15%16%30-39 Years3% 3% 3% 3% 3%FY 95FY 96FY 97FY 98FY 99FY 004%Source: SHARP (5-31-2000); Excludes unclassified, temporary and student employees.Comments: The number of employees in the higher years of service ranges has increased steadily over the past five years. These numbers indicatethat vacancies due to retirement will continue to increase over the next several years. Information provided in Section Two specifies the job classes withincreased turnover. The greater than 40 years of service range was intentionally excluded from this chart due to the low number of employees (less than1%) in this category.31%32% 32%33%Classified Employees by Years of Service
Number of Classified and Unclassified Employees by AgencyFiscal Year 2000Agency NameAccountancy, Board ofAdjutant GeneralAdministration, Department ofAging, Department onAgriculture, Department ofAnimal Health DepartmentAtchison Juvenile Correctional FacilityAttorney GeneralBanking DepartmentBarbering, Board ofBehavioral Sciences Regulatory BoardBeloit Juvenile Correctional FacilityBlind, School for theCitizens’Utility Ratepayer BoardCommerce and Housing, Department ofCorporation Commission, KansasCorrections, Department ofCosmetology, Board ofCredit Unions, Department ofDeaf, School for theDental Board, KansasEducation, Department ofEl Dorado Correctional FacilityEllsworth Correctional FacilityEmergency Medical Services BoardEmporia State UniversityFair, Kansas StateFire Marshal, State
149 Cosmetology, Board of 159 Credit Unions, Department of 167 Dental Board, Kansas . 325 Beloit Juvenile Correctional Facility Corrections, Department of . 610 Deaf, School for the