Transcription
Jun 12,2017The Quality/PriceParadoxThe fifth and last wave of market cycles (which we believe we’re in now) are dominated bysteep angled trends and shallow drawdowns. Positive sentiment becomes palpable and crowdpsychology drives areas of the market viewed as “sure bets” to stretched valuations. These“sure bets” are the market leaders — the Generals that lead the cycle’s advance. Where theseGenerals go, the broader market follows.In the 2003-2007 bull market, the market Generals were steel, potash, and financial stocks. Thiscycle the Generals are tech stocks; specifically the FAAMGs (FB, AAPL, AMZN, MSFT,GOOGL). Generals tend to get stupid acronyms — a sign of the exuberance and one sidednarratives driving their advances. The “Nifty-50” were an example of this. They were thedarlings of every institutional investor and hedge fund during the bull markets of the 60’s and70’s. They were known as “one-decision” stocks because it was taken as a matter of acceptedfact that investors should just buy and hold them forever, regardless of price.Those who bought to hold the Nifty-50 committed an investing mortal sin, they forgot that thereare two sides to every investment: Quality and Price. Hedge Fund Manager Howard Marks laysout this often overlooked paradox here (emphasis mine):MACRO-OPS.COMJun 12,2017
Jun 12,2017MACRO-OPS.COMWhen everyone believes something is risky, their unwillingness to buy usually reducesits price to the point where it’s not risky at all. Broadly negative opinion can make it theleast risky thing, since all optimism has been driven out of its price. And, of course, asdemonstrated by the experience of Nifty Fifty investors, when everyone believessomething embodies no risk, they usually bid it up to the point where it’senormously risky. No risk is feared, and thus no reward for risk bearing—no 'riskpremium'—is demanded or provided. That can make the thing that's most esteemedthe riskiest. This paradox exists because most investors think quality, as opposedto price, is the determinant of whether something's risky. But high quality assetscan be risky, and low quality assets can be safe. It's just a matter of the price paid forthem. Elevated popular opinion, then, isn't just the source of low return potential, butalso of high risk.Market pricing is always a function of embedded expectations versus probable outcomes. Thehigher the value placed on something (ie, the greater multiple applied to its cash flow andearnings) the higher the probability the market has assigned to the company fulfilling its loftyexpectations. But as enthusiasm builds around the quality of the company, the risk these highexpectations go unmet increases as well.There’s quality and then there’s price. The intersection of the two is value. As Buffett says,“Price is what you pay, value is what you get.”Though we’re not buy and hold investors, the concept of expectations vs outcomes and qualityvs price is important to know. It helps us understand where increasing risk and fragility arebuilding in the system.The market Generals of today, the FAAMGs, are a good study in this.Like the Nifty-50, the FAAMGs are quality companies with strong revenues and earningsgrowth. They have impressive competitive advantages and wide defensible moats. Thenarrative for owning them is convincing and widely adopted — they’re the largest positions inmost institutional portfolios and have become popular hedge fund hotels.Because of these reasons, FAAMG stocks have risen over 30% this year-to-date. Collectively,they’ve added over 600 billion in market cap in just the last six months which is incredibleconsidering that that’s equal to the GDP of South Africa and Hong Kong combined.As a result, these five stocks have accounted for over one-third of all of the S&P’s year-to-dategains. According to UBS analyst Julian Emanuel, this level of extreme clustering (ie, largeamount of index returns attributable to five stocks) has only happened four other times over thelast 25yrs: 93’, 99’, 05’, 07’.The broader sentiment around the tech sector as a whole has driven a steady ramp higher inprices bringing in more and more performance and momentum chasers — leading the Nasdaqindex to a ytd gain of 18% just before Friday’s dump. In fact, a sign of how squirrely things aregetting is this tidbit from an Analyst at Jones Trading, “The Nasdaq 100 index has closed higherin 70% of its sessions this year The closest it had previously come to this relentless pace wasin 1998, 1999, and 2007, when the percentage of “up” days reached 60%.”2The Quality/Price Paradox
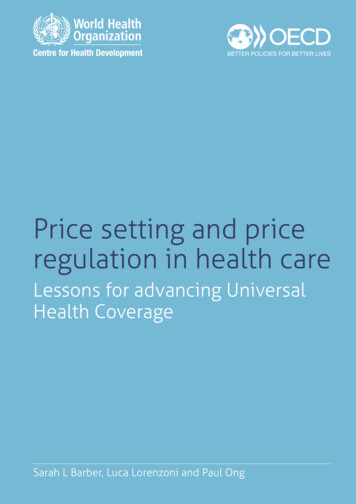
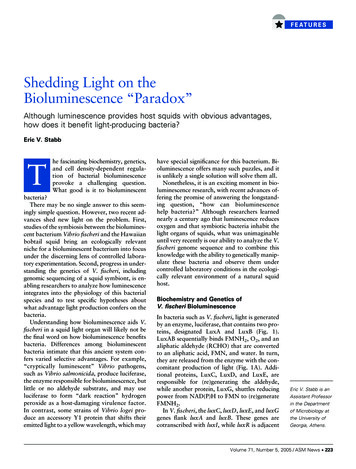
The Quality/Price Paradox3With this level of sentiment and positioning, Friday’s selloff in the FAAMGs on no newsshouldn’t come as a surprise. The chart below shows the ytd performance of the FAAMG stocksand their Friday selloff, which went as low as 6.8% at one point.Steep and low volatility trends accumulate weak holders who dump at the slightest sign ofadverse price action — an example of Nassim Taleb’s premise on how stability breeds fragility.Also, the selloff happened for technical reasons; both AMZN and GOOGL are bumping upagainst the 1,000 price per share mark. Large round numbers like these tend to attract sellersand act as points of resistance.Since these are our Generals for this cycle we should be intensely interested in where they maybe headed from here. The war (bull market) won’t end until the Generals are killed off. Sofiguring out if this is the start of a major trend change or just a small breather before another leghigher is important to us.To understand this we need to look at the macro, sentiment, and technicals.We’ve talked about the macro picture a lot lately. Though we’re entering a period of weakseasonality during the summer months where equities have a tendency to underperform, thebroader macro picture is still very supportive of higher equity prices.MACRO-OPS.COMJun 12,2017
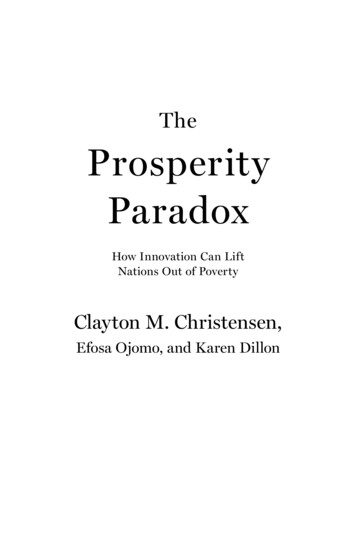
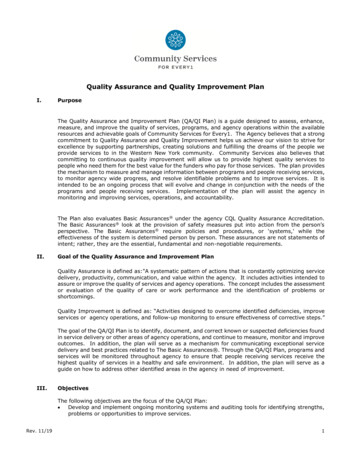
Jun 12,2017MACRO-OPS.COMReal inflation adjusted OECD interest rates remain near secular lows. Credit, as measured byBofA’s high yield spread index, remains near cyclical lows, indicating credit investors are risk onand liquidity is loose. Other indicators we track such as Yardeni’s equity and boom and bustindex, the LEI, and the unemployment MA crossover all indicate that the coast is clear for thisbull market to continue higher over the next six months or so.There’s a number of things I like to look at for big picture sentiment. But one of my favoritecharts I’ve come across and which I think perfectly encapsulates this latest rally is below (h/t toCallum Thomas for the chart).The green line on the top is the S&P. And the blue and orange line below are compositesentiment scores. The blue line shows the cumulative bullish % sentiment of both the AAII andInvestors Intelligence Polls while the orange line shows the cumulative percentage of thoseneutral.The chart is aptly titled “The Great Capitulation” because as the red arrows show, the recentrally beginning in 16’ has been marked by strong pessimism. The other two red arrows showthat the last time there was this level of neutral (non-bearish) sentiment was in 95’ and 99’. Allthree rebounds in bullish sentiment (blue line) coincided with major advances in the broadermarket.4The Quality/Price Paradox
The Quality/Price Paradox5The bull market won’t end until this high level of pessimism has been erased (ie, the orange lineis well below the blue line). Tyler, AK, and I have long joked that this bull market die until theperma bears of the likes of Jesse Felder and Raoul Paul start growing horns.Another great way to gauge broader market sentiment is to look at the change in margin debt.This is the amount that investors are willing to borrow to buy into positions. It’s easy to assumethat if investors start borrowing money quickly and in mass, then it may be a good sign thatsentiment is reaching extremes.Many traders wrongly look at NYSE margin debt on an absolute basis, but this is wrong. It’s thechange in the amount of margin debt relative to market cap that matters. That’s what the chartbelow shows.MACRO-OPS.COMJun 12,2017
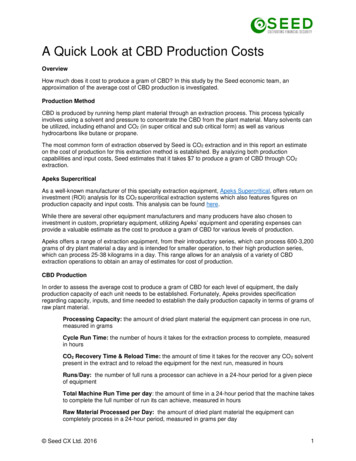
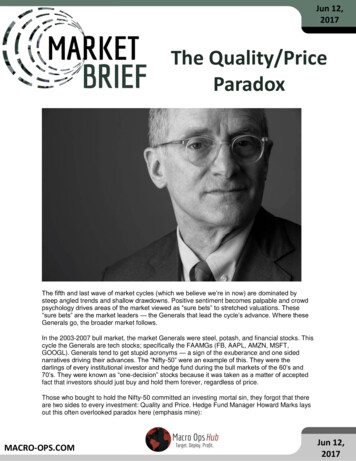
Jun 12,2017MACRO-OPS.COMAnother way we can look at this is by charting the YoY change of margin debt. Look at thatchart on the right and you can see a clear rapid expansion in the amount investors areborrowing to buy stocks which directly marked the tops of the last two bull markets.The YoY change in margin debt has been picking up since the middle of last year. I would notbe surprised to see this chart trend higher over the next 6-12 months.Both the macro and sentiment pictures indicate that the path of least resistance remains higherover the next six months.Now for the technicals.For a look at the technical health of our Generals, let’s focus on AMZN since that companymore than any other seems to drive the current belief in total tech dominance.The chart below shows AMZN on a weekly basis. On Friday the stock fell as much as 8.5% butthen regained some to close down 3.5% for the day.On this chart we have the 200-week (thick blue), 50-week (red), and 13-week (light blue)moving averages.6The Quality/Price Paradox
The Quality/Price Paradox7Moving averages are useful tools in trend following and trade management. William O’Neil ofIBD uses the 10-week MA (or 50-day) as a guide for noting trend direction and in setting stoplosses and entries. Jesse Stine, author of Insider Buy Superstocks and a fan of O’Neil, likes touse the 13-week (65-day) moving average but talked about how stocks each seem to reactspecifically to a certain moving average. He calls these the stock’s “magic lines”.We have also found that strong trending stocks typically adhere to a particular moving average(magic line) which tends to act as a point of support and resistance to price. For AMZN, itsmagic line is clearly its 13-week moving average. The orange dots mark the seven times overthe last 18-months in which the stock has touched that moving average and then quicklyreversed and bounced higher. Friday’s lows were marked at exactly its magic line beforerebounding higher.And the two red dots on the chart show the last two times where the stock broke below the 13week MA on a weekly basis. The first time led to a selloff of 31% and the second a selloff of16%. Both selloffs lasted approximated six weeks.It’s impossible to say if AMZN’s latest retrace quickly rebounds to new highs or if we’ll see alarger selloff in the range of the last two — which would mean 13-28% more downside andwhich still wouldn’t necessarily mean a trend change. A move below its 13-week MA wouldindicate there’s likely further pain to come though which would also be in line with theseasonality weakness but we’ll have to wait and see.MACRO-OPS.COMJun 12,2017
Jun 12,2017MACRO-OPS.COMEither way, the broader macro, sentiment, and technical picture all remain supportive of AMZNand the rest of the Generals (FAAMG stocks) of this market — which is a good sign for themarket as a whole.But over the long run, even though these companies represent quality and their prices will likelygo higher over from here, I don’t find much “value” in them for those looking to buy and hold. Butfor trend followers they could still be a great trade.Even though the Nasdaq is up over 14% ytd, depending on investor’s enthusiasm it could runmuch higher. The index rose over 85% from 99’ to 00’ from already lofty valuations. It thenfollowed that up by another 40% run at the start of the following year before finally rolling over. Idon’t expect to see that type of run as the secular tailwinds are nowhere near as strong today asthey were in the late 90’s. But a run of another 10% this year wouldn’t surprise me.MacroThe FOMC is meeting this week and will come out with their decision on Wednesday. They’refully expected to hike and the market is pricing this in. The real question is how much of ahawkish or dovish tone they take in their forward guidance.There’s a chance the FOMC comes out overly hawkish to get the market more in line with itsthinking, since it’s currently underpricing the Fed’s ability to carry out its planned hikes. I don’thave an opinion either way but it pays to be aware of the possibilities.And as we noted in the MIR, the last three times the Fed has raised rates, stocks have sold offand bonds have gone up (yields lower). There’s a chance we see a repeat of that this week andthat the tech selloff is just the beginning of that move.8The Quality/Price Paradox
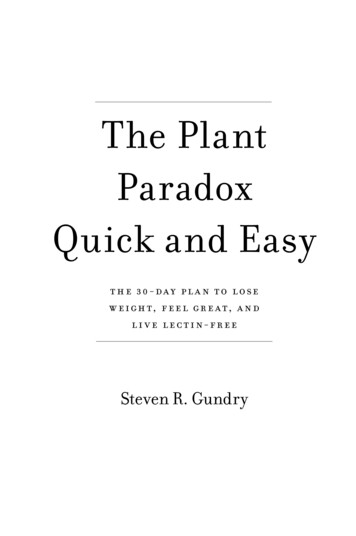
The Quality/Price Paradox9Oil had a terrible week last week, selling off more than 6% at one point down to 45/bbl. Icontinue to be agnostic on where oil is headed over the next few months. I think it stays rangebound between 35 and 55bbl. I’m using the end of the last commodity super cycle (98’-01’) asa macro analog and I wouldn’t be surprised to see the end of this super cycle follow a similarpattern.John Kemp of Reuters published the chart below which shows YoY change in US crude oilprices and drilling activity. There’s a strong correlation, as you’d expect, with drilling activitylagging the change in the price of crude by 19-weeks on average.The yellow line which represents WTIcrude has turned lower so we shouldexpect drilling activity to significantly dropas a result. This means lower revenuesand profits for US E&Ps in the nearterm.Longer term, the oil picture is muddled.Saudi Arabia is supposedly listing SaudiAramco sometime next year and theydesperately need a large valuation astheir state coffers are running dry. Therecent Saudi led blockade of Qatar ispartly, I believe, an attempt to stir thingsMACRO-OPS.COMJun 12,2017
Jun 12,2017MACRO-OPS.COMup in the Middle East with the hope of raising the risk-premium assigned to future oil prices. Iwould not put it beyond them to escalate the situation in order to drive oil higher. I plan onwriting a more indepth oil piece that discusses this scenario along with the market’s overallfuture supply/demand balance sometime soon.As I noted in last week’s Macro Musings, China A-Shares have broken out of at tight 18-monthconsolidation zone.We discussed in the last Brief why this breakout might be the result of an end to the Chinesegovernment’s current tightening cycle (ie, they’ve reached their economic pain threshold) andare about to start an easing cycle to keep things running smoothly into their importantNovember congress. Here’s the chart again via Nautilus showing that China might’ve hit a nearterm bottom.10The Quality/Price Paradox
The Quality/Price Paradox11Since you can’t believe the economic numbers that come from China since many of them aresugar coated by the CCP, I’ve gone ahead and created my own index to measure theireconomic growth.MACRO-OPS.COMJun 12,2017
Jun 12,2017MACRO-OPS.COMThe index is to the right and is meant to show the momentum in Chinese economic growth.It’s a composite of electricity production, rail freight volume, and credit growth in China and soshould more accurately reflect what’s really going on on the ground there. The indicator hascollapsed over the last five years which makes 6.5% gdp growth suspect. But it has bottomed,temporarily at least, and remains in an uptrend.Another area of the market I’m looking at is financials which haven’t gone anywhere this year.According to Thomas Lee at Fundstrat Global Advisors, “Never in the last 28 years haveenergy, banks, and telecoms been bottom three at the same time” in regards to relativeperformance.The chart below of the financials ETF XLF over SPY looks like it’s forming an extremely bullishsetup. This suggests that perhaps the time of relative underperformance from financials iscoming to an end.The failed H&S topping pattern in XLF is supportive of this possibility. Failed H&S are powerfulcontinuation patterns. Also, with the Fed hiking rates which will raise bank’s NIMs (net-interestmargins) and the likelihood for soon to be announce deregulation there’s no lack of bullishcatalyst for the sector.12The Quality/Price Paradox
The Quality/Price Paradox13Strat Portfolio UpdateGoldfield (GV)Entry Date: 11/15/16Entry Price: 3.10P&L: ( 284)Prior CoverageTrade UpdatesNothing new to report on GV. It remains a very small position in our portfolio and we’re waitingtill they report earnings at the end of this month before we assess whether we want to build ontoit or cut.MACRO-OPS.COMJun 12,2017
Jun 12,2017MACRO-OPS.COMGaia (GAIA)Entry Date: 3/23/17Entry Price: 9.74P&L: 9,442Prior CoverageTrade UpdatesGAIA continues to form a solid consolidation zone. The chart above is a weekly and showsGAIA is nearing 10 weeks of tighter and tighter consolidation. This is the kind of price action Ilike to see in areas of consolidation for my growth stocks. It shows the stock is being held bysteady hands which can be seen by the lack of large selling pressure. We’re just waiting for abreakout from this consolidation zone on strong volume and we’ll consider adding to ourposition.14The Quality/Price Paradox
The Quality/Price Paradox15Videocon (VDTH)Entry Date: 3/23/17Entry Price: 11.27P&L: ( 4,483)Prior CoverageTrade UpdatesNow contrast GAIA’s solid looking price action with that of VDTH’s, which is not what we want tosee. VDTH has retraced its entire gain since its breakout. I think the reason for this is becauseof its coming merger with Dish India TV and the uncertainty that’s always prevalent with theseevents. I’m guessing also a number of holders have decided to just dump their shares becausethey don’t want to take receipt of the new global deposit receipts (GDRs) they’ll receive whichwill trade on the Luxembourg exchange once the merger is complete.Now we may get stopped out of our trade, our risk point is at 9.26, but after the merger thismight be a trade worth revisiting as the secondary receipts that result from these mergers oftenare abandoned and passed over by investors, thus creating huge value for those willing to lookinto the matter. Hedge fund manager Joel Greenblatt made a ton of money off such trades andeven wrote a whole book on the subject. So this might be one we revisit down the road.MACRO-OPS.COMJun 12,2017
Jun 12,2017MACRO-OPS.COMPortugal ETF (PGAL)Original Entry Date: 4/25/17Entry Price: 10.57P&L: 6,710Prior CoverageTrade UpdatesPGAL is extended and will likely continue to correct over the coming weeks. This is healthy andwe’ll be looking for opportunities to add to our position. I think PGAL moves much, much higherfrom here over the coming year.16The Quality/Price Paradox
The Quality/Price Paradox17Stratasys (SSYS)Entry Date: 4/25/17Entry Price: 24.45P&L: 3,087Trade UpdatesSimilar to PGAL, SSYS is just going through a healthy retrace after a strong move. Shouldanother positive R/R entry present itself then we’ll look to add to our position.Trivago (TRVG)Entry Date: 5/15/2017Entry Price: 21.16P&L: ( 4,686)Prior CoverageTrade UpdatesTRVG is in the same boat as PGAL and SSYS and is experiencing a retrace after a strongmove upwards. I took a sloppy entry on this stock which I shouldn’t have done. As a result, I willprobably get knocked out of the trade.MACRO-OPS.COMJun 12,2017
Jun 12,2017MACRO-OPS.COMColombia ETF (GXG)Entry Date: 5/15/2017Entry Price: 10.18P&L: ( 1,889)Prior CoverageTrade UpdatesGXG continues to consolidate above its breakout. This trade is essentially a synthetic long oiltrade and since I don’t have strong conviction on the near-term direction of oil, I’m going tomove the stop up on this trade to 9.80.BlackBerry (BBRY)Entry Date: 5/15/2017Entry Price: 9.70P&L: 2,561Prior CoverageTrade UpdatesBBRY is also overextended over the short-term and likely to continue its pullback. I really likethis trade and think it has a lot of potential upside. The company faces many challenges and it’spath to success is far from guaranteed (Chintan, who’s from our Operator community and whois my go-to for tech info, lays out many of these challenges in the Comm Center). But thepotential
fact that investors should just buy and hold them forever, regardless of price. Those who bought to hold the Nifty-50 committed an investing mortal sin, they forgot that there are two sides to every investment: Quality and Price. Hedge Fund Manager Howard Marks lay