Transcription
A Patient Safety “EarlyWarning” SystemGetting the Complete Picture –Harnessing the Intel that Matters the MostRobert Hanscom, VP, Risk Management and Analytics, Coverys
Coverys – formerly ProMutual Group Originated as a joint underwriting association (JUA) in 1975 – created bythe Massachusetts Legislature In 1992, converted to the Medical Professional Mutual InsuranceAssociation, also known as ProMutual Group Covered clinicians, practices, and hospitals almost entirely within theCommonwealth of Massachusetts until 10-12 years ago Went national, acquired other insurance companies, and became“Coverys” Now, the fifth largest MPL carrier in the United States In 2013, began work to create our own comparative benchmarkingdatabase 2
Coverys’ Comparative Benchmarking Database Team of coders began work in late 2013, with emphasis on clinicalknowledge and experience with malpractice claim files Strong focus on Inter-rater reliability Essentially, root cause analyses on every claim file By 2016, they had coded all cases back to 2009 By 2019, we had 25,000 deeply coded cases, covering a span of 10 years Had started publishing our data in 2016; by 2020, decided to produce areport initially entitled “Insights From a Decade of Malpractice Claims” 3
Produced in October 2020 – “A Call for Action”4
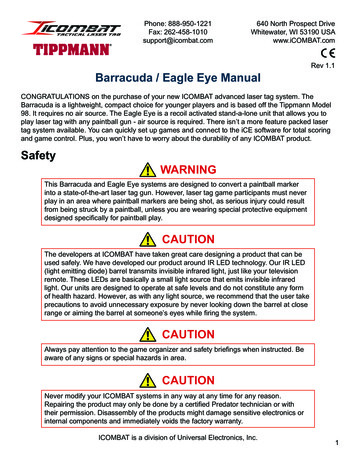
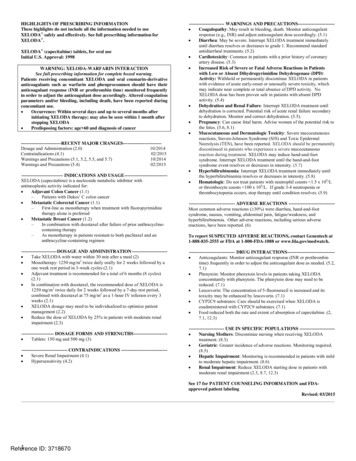
General Medicine (2010-2019)General Medicine TrendsClaims Rate per 100 Physicians3.83.1 600k Average Indemnity Paid 500k 400k 433,789 378,179 300k52010 2011 2012 2013 2014 2015 2016 2017 2018 2019Claims Rate: N 9,935 physicians between 2010-2019.Indemnity: N 586 closed claims with indemnity paid between 2010-2019. The rate of claims forgeneral medicine hastrended upward inrecent years One of the primarycontributors to this isdiagnostic error,which has shownvirtually noimprovement overthe last decade
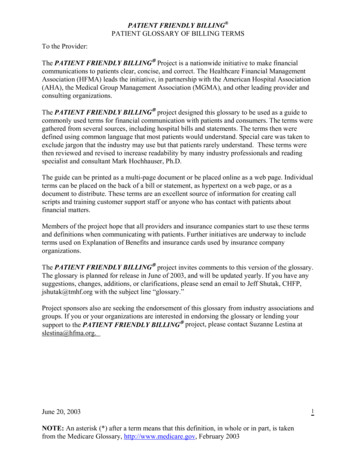
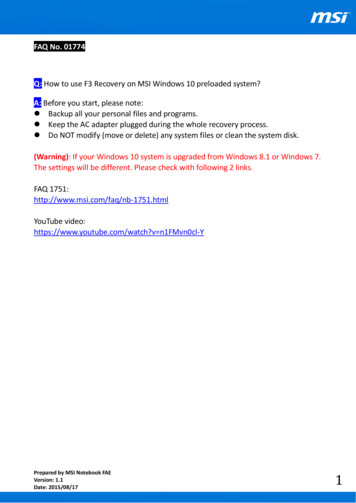
Surgery (2010-2019)Surgery TrendsClaims Rate per 100 Physicians11.5 500k10.1Average Indemnity Paid 450k 400k 350k 300k 338,0502010 2011 2012 2013 2014 2015 2016 2017 2018 2019Claims Rate: N 26,279 physicians between 2010-2019.Indemnity: N 3,485 claims closed with indemnity paid between 2010-2019.6 383,306 The rate of claims per 100surgeons is on a downwardtrend, with an average of 12.4claims per 100 physiciansduring 2010-2014, lowered to9.7 from 2015 to 2019 Improvements are noted inclaims involving wrong-sitesurgery and retained objects “Technical performance” [skillbased] issues have shownminimal improvement overthe past decade
We often describe malpractice claims as the “tip of the iceberg”
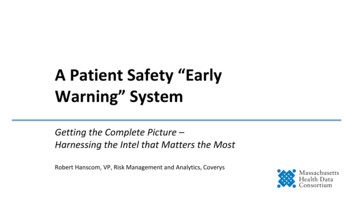
Obstetrics (2010-2019)Obstetrics TrendsClaims Rates per 100 Physicians12108 10.211.06 600kAverage Indemnity Paid 497,064 500k 400k 385,869 300k2010 2011 2012 2013 2014 2015 2016 2017 2018 2019Claims Rate: N 2,797 physicians between 2010-2019.Indemnity: N 1,207 claims closed with indemnity paid between 2010-2019.8 Claims frequency in obstetricalcases increased slightly from anaverage of 9.1 claims per 100physicians, 2010-2014, to 9.5claims per 100 physicians, 20152019 The rate of claims with indemnitypaid was 32%, significantly higherthan other types of claims The L&D phase of care continuesto be problematic, but pre-natalmanagement issues haveincreased over the last 10 years
Emergency Medicine (2010-2019)Emergency Medicine TrendsClaims Rate per 100 Physicians6.1 650k Average Indemnity Paid 550k5.2 545,455 456,160 450k 350k 250k92010 2011 2012 2013 2014 2015 2016 2017 2018 2019Claims Rate: N 12,157 physicians between 2010-2019.Indemnity: N 1,064 closed claims with indemnity paid between 2010-2019. The rate of claims foremergency medicineappears to be declining Missed or delayeddiagnosis continues tobe the dominant issuein emergency medicineclaims (53%),significantly higherthan other issues suchas medication error(10%).
Anesthesiology (2010-2019)Anesthesiology TrendsClaims Rate per 100 Physicians4.72.3 600kAverage Indemnity Paid 500k 400k 345,12545 1 300k 200k 272,844 272010 2011 2012 2013 2014 2015 2016 2017 2018 2019Claims Rate: N 9,935 physicians between 2010-2019.Indemnity: N 586 closed claims with indemnity paid between 2010-2019.10 Through the lens ofmalpractice, anesthesia is asuccess story The overall claims ratereduced significantly from 4.7claims per 100 physicians,2010-2014, to 2.3 per 100,2015-2019 The practice of anesthesia nowhighly data driven, with a focuson simulation training, crisismanagement, and evidencebased decision making
Physicians with Multiple ClaimsTop Specialties WithMultiple ClaimsTwo claimsTop Surgical Specialties WithMultiple ClaimsThree or more .5%General1.3% 0.3%MedicineTop Specialties: N 38,044 claims closed between 2010-2019 involving a physician.Surgical Specialties: N 4,818 claims closed between 2010-2019 involving surgery.11Bariatric Surgery16.1%6.3%Obstetrics13.3%6.7%Trauma Surgery12.7%General Surgery9.5% 3.6% 3.6%Orthopedic Surgery8.1%3.5%Vascular Surgery7.9%2.5%7.9%10.4% Physicians who experiencemore than one claimduring a given time periodrepresent a unique subsetof defendants. Those with two or moreclaims are statisticallylikelier to be sued again. Surgical specialties hold ahigher risk for multipleclaims
In 1999, the groundbreaking IOM report was released shockingthe publicandspurring amultitudeof patientsafetyinitiatives 12
“Big Data” for healthcare looks like this
A “Divining Rod” for Patient Safety Malpractice Data– Deeply analyzed cases -- particularly valuableif causation factors can be aggregated– Provides important “signal data” that canguide what to look for in present-day setting– Has dollars associated with itLimitations:– Always a look to the past– Small numbers raise question of statisticalsignificance– Unique convergences of factors don’tgenerally repeat themselves in exactly thesame way
Value-Based Approach
Many “sources of truth” for healthcare safety Adverse event data Root-cause analyses (for serious reportable events) Patient complaints Patient satisfaction surveys M&M rounds, patient rounds Malpractice data “Near-miss” data16
Burning questions Who is looking at these data sets? Where is this intel going? Are the signals from this data being captured? Is there any centralization of this data? How is this data influencing organizational priorities?17
Missing: “Central Intel” – no early warning system for healthcare 18
Intel from Adverse Events,SREs-Root Cause Analyses
Forms – and more forms 20
21
Serious Reportable Events – nearly 30 of them Surgical or Invasive Procedure Events– e.g., “the wrongs”; retention of foreign object; intra- or post-op pt. death Product or Device Events– e.g., death/injury from contaminated products, devices, drugs; death/injuryfrom use or function; death/injury from intravascular air embolism Patient Protection Events– e.g., patients unable to care for themselves; death/injury related to pt.elopement; pt. suicide Care Management Events– e.g., death/injury, med errors, blood products, L&D, neonates, falls, pressureulcers, pathology, radiology, etc.22
SREs, continued Environmental Events– e.g., death/injury, electric shock, oxygen, gas, toxic substances, burns,restraints, etc. Radiologic Events– e.g., death/injury, metallic objects in MRIs Potential Criminal Events– e.g., impersonation, abduction, sexual assault-abuse, death/injury fromphysical assault23
Root Cause Analysis – Patient Fall24
Root-Cause Analysis – Medication Error25
Patient Complaints Intel
Patient Complaints – high correlation to malpracticeWhy do patients sue?– It many times is for the same reason that they may register a complaint– Unhappy with— care received the way they were treated experienced a mistake that nobody acknowledged frustrated with wait times and delays felt nobody was listening to them – Those factors combined with an adverse outcome (whether there wasnegligence or not) can add up to a litigious patient – or family
Patient Complaint Data: high value Despite the inherent “clutter” in patient complaints, this is the voice of the patient This is the patient venting their frustration but—– in so doing, providing important signals to healthcare organizations Emphasis in recent years is to pay more attention to complaints that line up withknown areas of vulnerabilities. For example:– Receiving the wrong medication in a hospital or SNF– Receiving unnecessary surgery / diagnostic testing– Receiving an overdose of medication– Experiencing a delay in service– Receiving inadequate care or treatment by the physician, care team, or hospital– Experiencing a change in condition that was overlooked and not treated– Receiving a misdiagnosis– Receiving inadequate or even erroneous discharge instructions28
Patient Satisfaction Survey Intel
Patient Satisfaction Scores: preventing harm Patient Satisfaction scores have historically been high for healthcare organizations Easy to fall into a trap: “we look as good – even better – than our peers. We’re doingfine!” In recent years, there have been numerous initiatives by hospitals to improve theirscores. For example:– Training staff to be compassionate, kind, and supportive of patients throughouttheir treatment– Educating patients on financial aspects of their care, including payment of bills– Emphasis on “amenities” that might be available to patients But a guaranteed approach to lowering scores is to harm patients– Provider institutions must ensure that patient safety is always viewed as the toppriority
What can – and should – be gleaned from Pt. Satisfaction scores? Signals that safe care has vulnerabilities For example, a focus on scores that reflect –– perceptions of a poor patient safety culture AHRQ: “Improving the culture of safety within healthcare is an essentialcomponent of preventing or reducing errors and improving healthcare quality” Surveys have been designed to capture key data points related to culture– issues related to accommodating diversity– failure to detect problems as clinical care is being delivered– communication failures A mindset that shifts away from “look how good we are doing” to “whatare indicators – the signals – that we need to pay more attention to?”31
The HRO Promise32
High Reliability Organizations (HROs) Attributes: – Stable. Secure. Predictable.Industries that need it the most:– those who are continuously faced with the unpredictable, those that operate undertrying conditionsIndustries that have done well in becoming HROs:– nuclear power plants, firefighting units, aviation air traffic control, etc.Industries that have not done well:– Healthcare (with hospital EDs being a possible exception)Key difference between HROs and other organizations:– “The sensitivity or mindfulness with which people in most HROs react to even veryweak signals that some kind of threat is present or approaching”– Most companies, including healthcare, are “hugely unprepared for theunpredictable”
HROs need data -- an “early warning system” Attributes of an Early Warning System– A chain of information and action that relies on: Centralized – and credible – data Analytics that collect and weight key data sets The ability to nimbly assess risk when signals are detected The capability to monitor issues that pose threats to safety A mindfulness – and a readiness – to respond, to proactively takesteps to reduce the threat34
Key Questions Do healthcare organizations systematically analyze data sources to identify patternsand trends? Do they sufficiently mine the data they identify in early warning systems that existsuch as rounding? What are patients saying at the local level that they can track and trend andsubsequently improve? How is the data from all key information sources being used to provide the leaderswith a comprehensive 30,000-foot view of what the patient is experiencing?We need to create a robust system of data integration that identifiestrends, patterns, and signals.35
The Future Model
“Central Intel” – from numerous key sources37
What are the parts and pieces?What is needed: Organizational will Innovative thinking – the commitment to break away from pastparadigms A common taxonomy – to be applied to all data sets contributingto central intel Training staff on how to report, with a strong emphasis onpreventing future harm Ensuring good data quality for all key data sets Robust analytics
Think about a lighthouse Ancient concept:using signals, acentral emitter ofpotentialhazards. Highlyvisible, a trustedsource of truth
-- shining early warning beacons on the “crates” where risk to safepatient care is brewing
Coverys – formerly ProMutual Group Originated as a joint underwriting association (JUA) in 1975 – created by the Massachusetts Legislature In 1992, converted to the Medical Professional Mutual Insurance Association, also known as ProMutual Group Covered clinic