Transcription
NATIONALMEDICALMALPRACTICETRENDSPaul Greve JD RPLUEVPWillis Health Care Practice260 348-5873paul.greve@willis.comMarch 2015OSHRM SOHA
NATIONALMEDICALMALPRACTICETRENDS: 2015Overview Positive and Negative Medical Malpractice Trends Medical Malpractice Insurance Trends Medical Malpractice Claim Trends The Future: Health Care Reform Liability2
NATIONAL MEDICALMALPRACTICE TRENDS:POSITIVES ANDNEGATIVES3
NATIONAL MEDICALMALPRACTICE TRENDS2015: The National Medical Malpractice EnvironmentThe Positives Claims counts/frequency still down markedly Severity rising but not drastically Much competition in the insurance market makes for favorablepricing across all health care professional liability segments Improvement in obstetric claims seen across a number ofdatabases: Unprecedented? MICRA laws upheld in California by overwhelming public vote lastNovember Industry Combined Ratio improved: HPL is profitable4
NATIONAL MEDICALMALPRACTICE TRENDS2015: The National Medical Malpractice EnvironmentThe Negatives Claims costs rising due to medical costs and legalexpenses The number of jumbo verdicts have increased but arenot a problem (yet). No affect on premiums The numbers of large verdicts is increasing nationally5
MEDICALMALPRACTICEINSURANCETRENDS: 20156
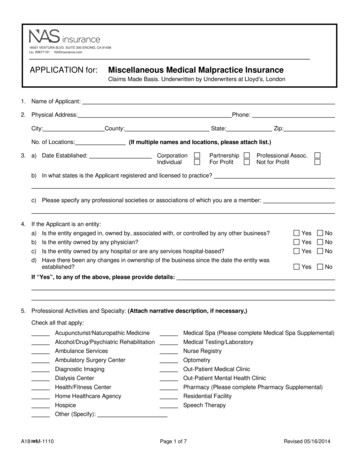
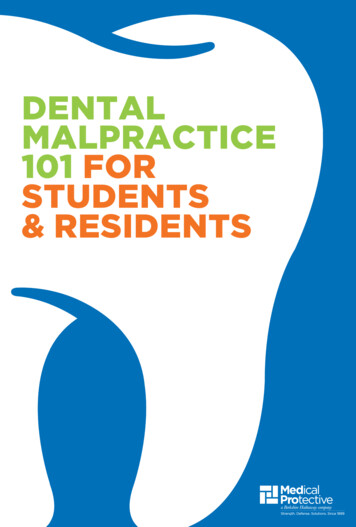
MEDICAL MALPRACTICEINSURANCE TRENDSMedical Professional Liability Combined Ratio2008 - 2013Source: A.M. Best 83.480.687.993.892.5
MEDICAL MALPRACTICEINSURANCE TRENDS Medical malpractice continues as the most profitable line of 8P&C insuranceFierce competition and rate decreases continue across allsegments: hospitals, physicians, long term care, managedcare, facilitiesMarket consolidation by acquisition continues and likely tocontinue.Reinsurance market has been favorable; more capital cominginContinued growth of captives/RRGs: 253 Cayman health carecaptives; 100 Vermont captives
Top Ten Medical ProfessionalLiability Insurers - 20132013RankCompany1Berkshire Hathaway2Doctors Company736.13MLMIC (NY)542.04ProAssurance494.95CNA477.26PRI (NY)373.27AIG351.58Coverys346.29NORCAL285.210ISMIE Mutual (Illinois)243.2Source: AM Best 20149Net PremiumsWritten 825.5M
M&A Transactions Involving MedicalProfessional Liability CarriersBUYER2014 TRANSACTIONSCoverysTARGETPPIC2013 TRANSACTIONSCoverysOHAISMAG MutualSouth Carolina Physician Assurance Co.MMICUtah Medical Insurance Association2012 TRANSACTIONS10ProAssurance CorporationMedmarc Insurance GroupProAssurance CorporationIndependent Nevada Doctors Insurance Exchange
NATIONAL MEDICALMALPRACTICECLAIM TRENDS11
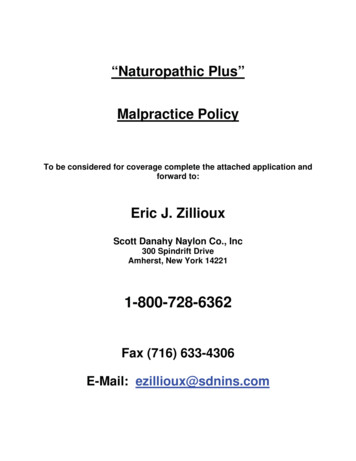
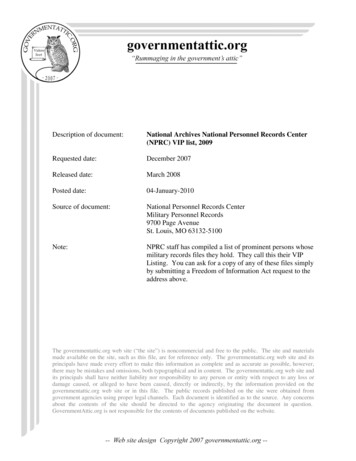
Ob/Gyn 425Neurosurgery 421Pediatrics 398Neurology 395Anesthesiology 378Radiology 370Pathology 346Emergency Medicine 346Urologic Surgery 337Internal Medicine 336CT Surgery 335Gastroenterology 335All Specialties 329 0 75 150 225 300 375Top MedicalSpecialties byAverageIndemnity(2008-2012) 450Thousands
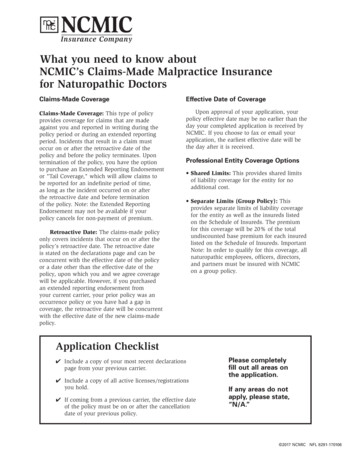
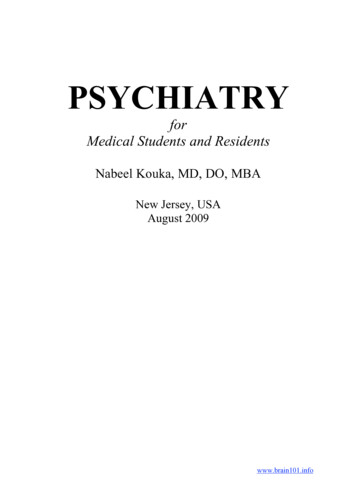
Top Chief Medical Factors(2008-2012)15,000 450,00012,500 375,00010,000 300,0007,500 225,0005,000 150,0002,500 75,0000 0ImproperperformanceErrors in diagnosis Failure to supervise Failure to recognize Medication errorsor monitor casea complication oftreatmentClosed ClaimsAvg IndemnityAvg IndemnityClosed ClaimsDiagnostic Error second by number of closed claims;highest by average indemnity payment.
Trends of Note - 5 year intervals(2003-2007) and (2008-2012)% Paid-to-ClosedAverageIndemnityAverage ALAEOB/GynDecreased 2%DecreasedIncreasedRadiologyIncreased 1%IncreasedDecreasedMedication ErrorsIncreased 10%IncreasedIncreasedClassification
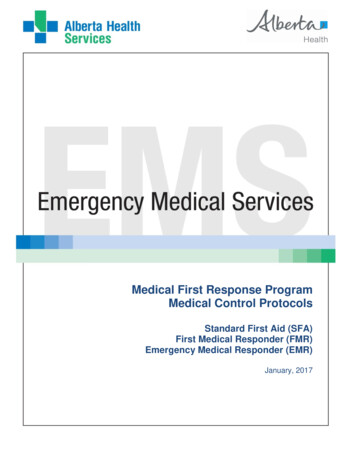
Hospital Claims for High-Risk ServicesGenerate over Half of Total LiabilityDollars30.0%25.0%20.0%% of Claims15.0%% of Dollars10.0%5.0%0.0%OBSource: BerkleyMed, 201515ORERRadiology
Obstetrics Claims – MetricsHospitals About one out of every 3,711 births results in a medicalmalpractice claim with indemnity The average value of these cases, including defense, isabout 1.1M The cost per delivery to cover liability is, on average, 296Source: BerkleyMed, 201516
Hospital Claim TrendsZurich Annual Benchmark Report Issued October 2013 Overall trends reported for AY 1999 - 2009 Over 315,000 claims and about 27 billion in estimatedultimate losses Zurich claims and underwriting data submitted to Zurich 2010 was the cut off year to allow for maturation of claims17
HOSPITAL CLAIM TRENDSZurich 2014 Claims Analysis: Key Findings Claim frequency: “very stable” Severity trending up. Rose 6% per year from 2006 to 2011 IL, NY, PA lead in severity Frequency of large claims continues to rise Pctg 1M and those 5M but moving at the same pace Children’s hospitals had the highest severity followed by teachinghospitals. These two types of facilities had much higher severitythan others. Early resolution programs had little impact on expense andindemnity18
Loss Cost Per OBEZurich Claims
Claim Severity byFacility Type: Zurich
Zurich: Facility DashboardsFrequency, Severity, Loss Cost
National MPL Trends 2015:Conclusion Integration/Reform has yet to notably impact MPL riskCost for plaintiff’s to pursue malpractice cases is a huge barrierTelemedicine: Very few casesFrequency remains at historic lows; severity is predictableThe public’s perception of hospitals and the health care industrymust be closely watched, especially with consolidation Managing patient expectations is crucial in a time of transition22
Coverys TARGET PPIC 2013 TRANSACTIONS Coverys OHAIS MAG Mutual South Carolina Physician Assurance Co. MMIC Utah Medical Insurance Association 2012 TRANSACTIONS ProAssurance Corporation Medmarc Insurance Group ProAssurance Cor