Transcription
Depression Among MaineNursing Facility ResidentsMaineCare Policy CooperativeAgreement ProjectMay 2007
MaineCare Policy Cooperative Agreement ProjectDepression Among Maine Nursing Facility ResidentsPrepared for the Maine Department of Health and Human ServicesPrepared byCatherine McGuireKaren MauneyInstitute for Health PolicyMuskie School of Public ServiceRhonda WebberDivision of Licensing and Regulatory ServicesMaine Department of Health and Human ServicesMay 18, 2007
About the StudyThis study was conducted under a Cooperative Agreement between the MaineDepartment of Health and Human Services and the Muskie School of Public Service atthe University of Southern Maine. Thanks to Catherine Cobb and Lou Dorogi from theDivision of Licensing and Regulatory Services for their review and comments on draftsof this report. The views expressed are those of the authors and do not necessarilyrepresent the views of either the Department or the School. For more information contactCatherine McGuire, Director of Health Data Resources, Muskie School of Public Service207-780-4034 or cathy@usm.maine.edu.
Table of ContentsAbout the Study . iiIntroduction. 1Approach. 3Results. 4Depression Measurement. 5Characteristics of Residents with Symptoms of Depression . 8Summary . 15
IntroductionIn 1989 the State of Maine and its nursing home industry were selected to participate in theMedicare and Medicaid Case Mix Payment and Quality Assurance Demonstration Project (CaseMix Demonstration) sponsored by the Center for Medicare and Medicaid Services (CMS,formerly the Health Care Financing Administration). Thus began the journey for Maine and itsnursing home industry to develop information that would inform the resident’s plan of care,provide measurements for internal quality improvement and external quality review, and define astructure for payment reflecting the intensity of resources required to care for a resident.Ultimately, this information would become available to consumers and their families to assist inthe selection of a nursing facility. Key to this effort was the development of the Minimum DataSet (MDS) for nursing homes.The MDS is part of the Resident Assessment Instrument (RAI) 1 that was developed by CMS toassist Medicare/Medicaid certified nursing homes to develop a comprehensive care plan for eachresident. In 1986, the Institute of Medicine (IOM) report identified uniform resident assessmentas essential to improvement in the quality of care delivered to residents and reform of the surveyprocess. A key part of the Case Mix Demonstration Project was to test the use and reliability ofthe MDS with a broad spectrum of nursing home providers. Maine providers began using theMDS in 1990 and implemented the MDS2.0 (current version of the assessment) in 1998 whenCMS issued the final rule for completion and submission of the MDS by facilities in all states(OBRA 87 final rule implementing the law was completed on December 22, 1997).The RAI “provides a comprehensive assessment of each resident's functional capabilities andhelps nursing home staff identify health problems. Resident Assessment Protocols (RAPs), arepart of this process, and provide the foundation upon which a resident's individual care plan isformulated. The MDS assessment forms are completed for all residents in certified nursinghomes, regardless of source of payment for the individual resident. MDS assessments arerequired for residents on admission to the nursing facility and then periodically, within specificguidelines and time frames. In most cases, participants in the assessment process are licensedhealth care professionals employed by the nursing home. MDS information is transmittedelectronically by nursing homes to the MDS database in their respective States. MDSinformation from the State databases is captured into the national MDS database at CMS.” 2Maine’s use of MDS information for quality improvement began in 1992 with pilot testing of thequality indicators developed by the University of Wisconsin, Madison as part of the Case MixDemonstration Project. Until early 2000, Maine was able to compare nursing homes to eachother within the state on key quality indicators. In November 2002, CMS launched the nationalNursing Home Quality Initiative (NHQI) that adopted a set of improved nursing home qualitymeasures nationally referred to as Quality Indicators/Quality Measures (QI/QM). Developed inpartnership with a broad stakeholder group, the goals of the NHQI are (1) to provide consumerswith an additional source of information about the quality of nursing home care based on qualityindicators and enforcement information; and (2) to help providers improve the quality of care for1For complete details on the RAI and MDS see the CMS 1 Overview.asp#TopOfPage2CMS Website, 3/13/2005. http://www.cms.hhs.gov/NursingHomeQualityInits/20 NHQIMDS20.asp#TopOfPage.MaineCare Policy Cooperative Agreement ProjectDepression Among Maine Nursing Facility Residents1
their residents by providing them with complementary clinical resources, quality improvementmaterials, and assistance from the Quality Improvement Organizations (QIOs).In 1999, the Maine legislature authorized the Maine Department of Health and Human Servicesto form a Long Term Care Best Practice group. The group currently consists of a wide range ofstakeholders including consumer advocates, providers, state survey and certification staff andstaff from the New England QIO – North East Research. The group meets at least quarterly andprovides a series of best practices forums, educational workshops and other opportunities toproviders of long-term care services. Workshops and forums may be cosponsored by entitiesother than the Department. The group became concerned about recent QI/QM reports that showMaine ranking very high on several measures. They asked the Department to provide moreinformation on these reports.In early 2006, Maine survey staff presented comparative QI/QM information to the Best PracticeGroup and identified indicators where Maine ranks high relative to other states. Manyindicators were presented and prompted more questions than answers. The group selected keyindicators to explore in depth. As a starting point, symptoms of depression and symptoms ofdepression without antidepressant therapy indicators were selected.Table 1. QI/QM Residents Who Become More Depressed National Data as of 6/30/2005NationalRegion 01ConnecticutMassachusettsMaineNew HampshireRhode 42As shown in Table 1 and 2 Maine has been one of the highest ranked states on these indicatorsfor many years – higher than the national average and other states in our region. Maine currentlyranks 53rd on both these measures (50 states, American Samoa, Guam, Commonwealth of NorthMariana Islands, Washington D.C., Virgin Islands and Puerto Rico are included). Maine hasbeen consistently high over the past three years for which data were available.MaineCare Policy Cooperative Agreement ProjectDepression Among Maine Nursing Facility Residents2
Table 2. QI/QM Symptoms of Depression without Antidepressant Therapy National Data as of 6/30/2005NationalRegion 01ConnecticutMassachusettsMaineNew HampshireRhode anking200451195331345200351765230542Presentation of these data to the Best Practice group prompted much discussion and severalquestions:1.) Is geography an issue?2.) Is there an issue with coding information on the MDS? How many with symptoms alsohave a diagnosis of depression?3.) Are there incentives for coding MDS items related to our Maine’s case mix paymentsystem?4.) How do other resident characteristics influence symptoms?The Best Practice group asked state staff in collaboration with the Muskie School to provide amore in depth examination of depression using the state’s MDS data warehouse and to the extentpossible answer these questions. This report presents the results of this effort. Preliminary datawere presented to the Best Practice group at a meeting on March 15, 2006. This report providesa narrative summary of those findings. Specifically, this report looks at the various definitions ofdepression used in the QI/QM measures and selects one definition to further study thecharacteristics of these residents with symptoms of depression in an effort to examine thequestions above.ApproachTo develop a profile of nursing facility residents with symptoms of depression the most recentroster used to establish MaineCare payment rates effective April 1, 2006 was selected. Statestaff does not have access to the specific information included in calculating the QI/QM reportspresented to the Best Practice group, however, the measures are defined and can be calculatedfrom the MDS data that is available to the state. To accomplish this, the most recent assessmentsfor residents in Maine nursing facilities as of December 15, 2005 are used. This roster isdistributed to facilities for review and correction prior to establishing the MaineCare paymentrates for April 1, 2006. Given that most facilities will have reviewed the payment roster, it isgenerally a reliable source for a current profile of residents. Assessment data were pulled fromthe state data system as of March 6, 2006. As the exact indicators are not available directly tothe state, staff constructed the indicators based on the logic provided by CMS in QI/QM ReportsMaineCare Policy Cooperative Agreement ProjectDepression Among Maine Nursing Facility Residents3
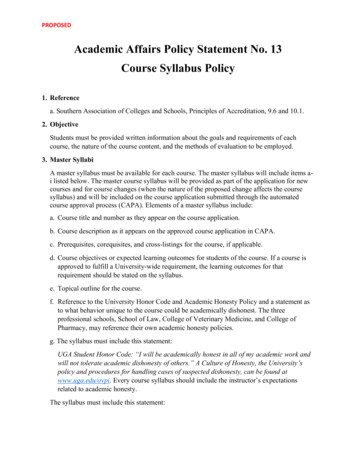
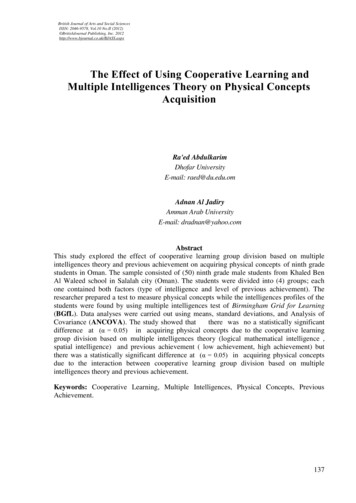
Technical Specifications: Version 1.0 3 . When available the previous assessment for theseresidents was pulled. Finally, for residents whose most recent assessment was not a fullcomprehensive assessment (i.e., annual, admission, significant change – assessment that requirescomplete of the care plan and triggers and raps), the last available comprehensive assessmentwas included.ResultsThe study group consists of 6,486 residents and their most recent assessment as identified on theDecember 15, 2005, payment roster. The majority (59%) were quarterly assessments, 13% aMedicare Payment Assessment Form (MPAF), 14% annual, 10% admission and the remaining3% of other types (significant change or correction). MaineCare was the source of payment on68% of the assessments, with the remainder split between Medicare and other – 16% each. Theaverage age was 81, however, 46% of residents were 85 years of age or older. Seventy-onepercent of the residents were women. The average case mix index 4 was 1.512. Dementia wasdiagnosed for 64% of all residents – 25% with Alzheimer’s disease, 41% with other types ofdementia.Chart 1: Pre vale nce of De pre ssion Diagnosis for MaineNursing Facility Re side ntsby CountyDe ce mbe r 2005It is important to note the MDS contains anindicator for a diagnosis of depression or manicdepression in the Disease section of the form(Section I). The disease section capturesdiseases that have a relationship to the resident’scurrent status and are based on a physician’sdiagnosis. The majority of the study group(57%) has a diagnosis of depression indicated inthe diagnosis section – 55% with Depression;3% with Manic Depression 5 roostookAndroscogginSomersetWhen examined by the county the nursing homeresides in, the prevalence of a depressiondiagnosis shows no clear geographic pattern.Chart 1 displays the prevalence of depressiondiagnosis by county. Prevalence ranges from alow of 48% in Washington County to a high of63% in Washington0%20%40%60%80%100%3Available at the CMS websitehttp://www.cms.hhs.gov/MinimumDataSets20/05 QualityIndicatorandResidentReports.asp.4The Case Mix Index is a measure of intensity of resource use. MaineCare uses a case mix adjustment forreimbursement of the direct care component of nursing facilities’ rates. For more details of calculating the case mixgroups see http://muskie.usm.maine.edu/mds/.5Both Depression and Manic Depression may be indicated for a resident. There is a slight overlap resulting in thefinal 57% prevalence.MaineCare Policy Cooperative Agreement ProjectDepression Among Maine Nursing Facility Residents4
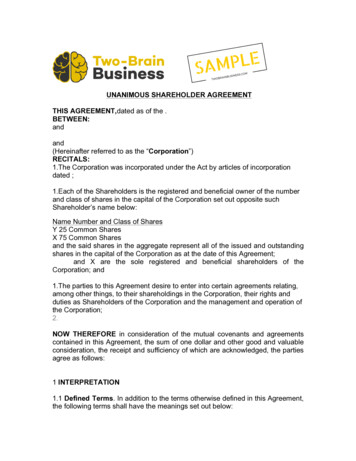
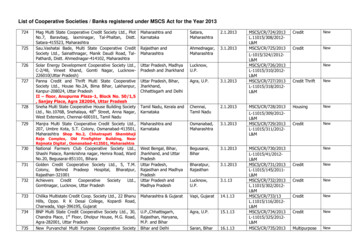
The diagnosis of depression is not the indicator used in the QI/QM measures defined in table 1and 2 above. The QI/QM measures depression in two ways:1.) Residents who “become more depressed” defined by a change in the mood scale; and2.) “Symptoms of depression” without antidepressant therapy defined by a sad mood andtwo or more symptoms of functional depression.Both measures use items from the “Mood and Behavior Patterns” Section of the MDS (SectionE) and a measure of appetite from the “Oral/Nutritional Status” section (Section K). Differentscales are calculated with these items for each measure. The definition of these measures isexamined in the next section.Depression MeasurementThe first measure “Residents who becomeChart 2: Mood Scale Score on Most Recentmore depressed” is determined by anAssessment 12/15/2005 (N 6486)increase in the mood scale on the most recent81%assessment (target assessment) as compared74%to the previous assessment. The mood scale67%contains the eight items identified in Table510%3 6 . A count of the number of items present410%is calculated for a resident based on answers310%found on the MDS. The count ranges from210%no item present (0) to all items present (8).120%Chart 2 displays the percent of residents by027%their score on the mood scale. A score of0%20%40%60%80%100%zero (0) is observed on 27% of residents, one(1) for 20% of residents, and two throughfive each for 10% of residents. All eight items were present on 1% of residents.Table 3: Residents Who Become More Depressed MeasureMood Scale (range 0-8) is a count of eight conditions:1.) Any verbal expression of distress (E1a 0, E1c 0, E1e 0, E1f 0, E1g 0, or E1h 0).2.) Shows signs of crying, tearfulness (E1m 0).3.) Motor agitation (E1n 0).4.) Leaves food uneaten (K4c checked) on target or last full assessment. The K4c value from the lastfull assessment is only considered if the target assessment is a quarterly assessment and thestate quarterly assessment does not include K4c.5.) Repetitive health complaints (E1h 0).6.) Repetitive/recurrent verbalizations (E1a 0, E1c 0, or E1g 0).7.) Negative statements (E1a 0, E1e 0, or E1f 0).8.) Mood symptoms not easily altered (E2 2).6Specific definitions for these measures can be found in “QM/QI Reports Technical Specifications: Version 1.0”,CMS publication, available https://www.qtso.com/download/mds/MDS QIQM Tech Specs.pdf. Parentheticalnotations in Table 3 refer to the MDS section and item used in the definition.MaineCare Policy Cooperative Agreement ProjectDepression Among Maine Nursing Facility Residents5
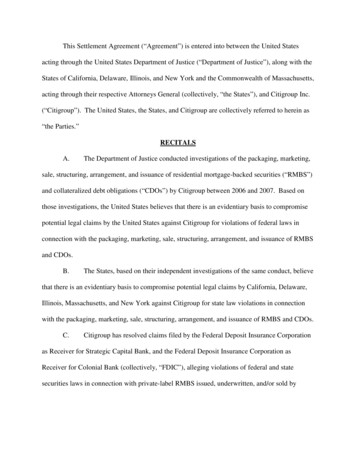
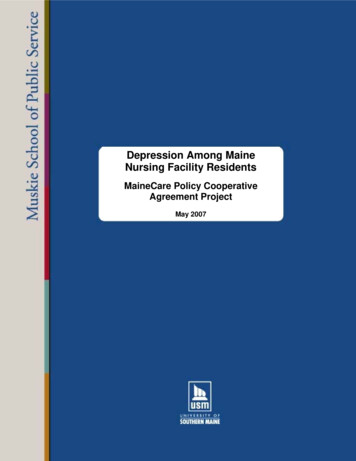
The QI/QM measures residents who become more depressed. The QI/QM measure compares thevalue of the mood scale on the previous assessment to the most recent assessment. An increasedscore (i.e. more conditions are present) on the most recent assessment flags the resident as moredepressed. Residents must have a valid mood score on both the most recent assessment (target)and the previous assessment. A resident can not be comatose on the most recent assessment tobe considered in the measure. Also the score on the previous assessment can not be eight – allitems present. These residents can not become more depressed as measured by the mood score,so they are excluded from the QI/QM calculation. For our study group 87% (5674 residents)meet the criteria for inclusion in the QI/QM measure.Most residents (44%) exhibit no change in their mood scale as evident in Chart 3 – 29% becomemore depressed, while the remainder 26% become less depressed. A proportion of residents inall three groups that measured change in depression had a diagnosis of depression. As shown inChart 3 over half (55%) of the residents with no change in mood had a diagnosis of depression,while just over 60% of those who either improved (61%) or declined (62%) had a diagnosis.Chart 3: Nuring Facility Residents who Become MoreDepressed (12/15/2005)Less Depressed26%No Change44%29%More Depressed0%20%40%Depression DXMaineCare Policy Cooperative Agreement ProjectDepression Among Maine Nursing Facility Residents60%80%100%No DX6
The second QI/QM measures prevalence of “symptoms of depression without antidepressanttherapy.” This measure identifies residents with a “sad mood” as captured in the moodpersistence question (MDS item E2 coded 1 or 2) and at least two symptoms of “functionaldepression.” “Functional depression” is defined in Table 4 and includes distress, agitation orwithdrawal, waking in unpleasant mood, suicidal or recurrent thoughts of death and weight loss.To be considered in the QI/QM measure the most recent assessment can not be an admissionassessment and all items used to calculate the measure must be present. For our study group33% of residents had “symptoms of depression”. Of the residents with “symptoms ofdepression” 7% had admission assessments and 62% had a diagnosis of depression.Table 4: Symptoms of Depression without Antidepressant TherapyA Sad mood (E2 1 or 2)ANDAt least 2 of the following other symptoms of functional depression:1.) Symptom 1 distress (E1a 1 or 2: resident made negative statements);2.) Symptom 2 agitation or withdrawal (E1n 1 or 2: repetitive physical movements, or E4eA 1,2, or 3: resists care, or E1o 1 or 2: withdrawal from activity, or E1p 1 or 2: reduced socialactivity);3.) Symptom 3 wake with unpleasant mood (E1j 1 or 2), or not awake most of the day (N1d ischecked), or awake 1 period of the day or less and not comatose (N1a N1b N1c 1 andB1 0);4.) Symptom 4 suicidal or has recurrent thoughts of death (E1g 1 or 2);5.) Symptom 5 weight loss (K3a 1).As evident in the results above and summarized in Table 5, the prevalence of depression variesdepending on the measure used. As a reminder, the definitions are the same used in the QI/QMmeasures – although they will not exactly correspond to the data points shown in Tables 1 and 2above. These measures identify residents with depression from current MDS data. Dependingon the definition, prevalence can range from 57% based on diagnosis of depression to 29% basedon residents who become more depressed. Symptoms of depression, as used in the QI/QM“prevalence of symptoms of depression without antidepressant therapy,” are present for 33% ofthe study group – 62% of these individuals also has a diagnosis of depression. For the residentwho becomes more depressed (29% of study group) – 62% also have a diagnosis of depression.Examining the overlap of the QI/QM measures finds that 49% of the study group has either ofthe QI/QM definitions. Finally, if one uses either of the QI/QM measures or diagnosis ofdepres
Maine’s use of MDS information for quality improvement began in 1992 with pilot testing of the quality indicators developed by the University of Wisconsin, Madison as part of the Case Mix Demonstration Project. Until early 2000, Maine was able to compare nursing homes