Transcription
The Industry Standard In Infrastructure MonitoringNetwork AnalyzerConfiguring Switches And Routers To Send Netflow DataPurposeThis document describes how to setup Netflow data collection on enterprise grade switchesand routers, and relay that information to Nagios Network Analyzer. Once a router or switch isset up to export Netflow data, you will be able to create a source in Nagios Network Analyzerto monitor the captured Netflow data.Target AudienceThis document is intended for use by network administrators who need information on how to configure theirdevices to send Netflow traffic to Nagios Network Analyzer.ConsiderationsAll of the following examples will be sending udp traffic on a specific, uncommon port. This means that anyfirewall devices between your sending devices and Nagios Network Analyzer will need to allow this traffic.Each individual Netflow source will need to be sending the data on a different port, so you will need to beaware of which ports are currently being used for existing Netflow sources when adding new sources. Thisdocument provides examples for several devices, other models and manufacturers commands and directionsmay vary.1295 Bandana Blvd N, St. Paul, MN 55108 sales@nagios.com US: 1-888-624-4671INTL: 1-651-204-9102www.nagios.com 2017 Nagios Enterprises, LLC. All rights reserved. Nagios, the Nagios logo, and Nagios graphics are the servicemarks, trademarks, orregistered trademarks owned by Nagios Enterprises. All other servicemarks and trademarks are the property of their respective owner.Page 1 / 9Updated – February, 2019
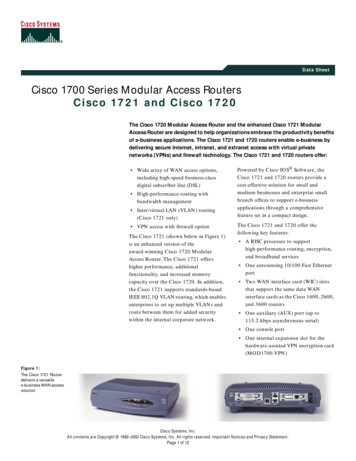
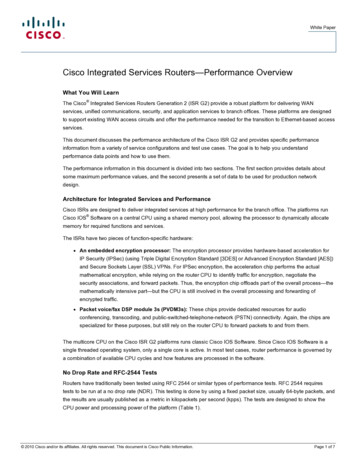
The Industry Standard In Infrastructure MonitoringNetwork AnalyzerConfiguring Switches And Routers To Send Netflow DataConfiguring A Cisco 2600 Series RouterYou will need to enable Netflow on each individual interface that you want to collect statistics on. In thefollowing example the interface that is being configured is Ethernet0/0. The Nagios Network Analyzerserver is at 192.168.5.191 and Netflow information will be sent on port 9912.Note: You will want to replace your Nagios Network Analyzer IP address for 192.168.5.191 and thespecific port you want to use for 9912.Please execute the following commands from the exec command prompt:enableconfigure terminalinterface Ethernet0/0ip route-cache flowexitip flow-export 192.168.5.191 9912 version 5exitclear ip flow statsNow all traffic flowing through interface Ethernet0/0 will be analyzed by the Cisco device and will be sentto the Nagios Network Analyzer for further processing. Be sure to save the config once you've determinedproper functionality of exporting the Netflow data.1295 Bandana Blvd N, St. Paul, MN 55108 sales@nagios.com US: 1-888-624-4671INTL: 1-651-204-9102www.nagios.com 2017 Nagios Enterprises, LLC. All rights reserved. Nagios, the Nagios logo, and Nagios graphics are the servicemarks, trademarks, orregistered trademarks owned by Nagios Enterprises. All other servicemarks and trademarks are the property of their respective owner.Page 2 / 9Updated – February, 2019
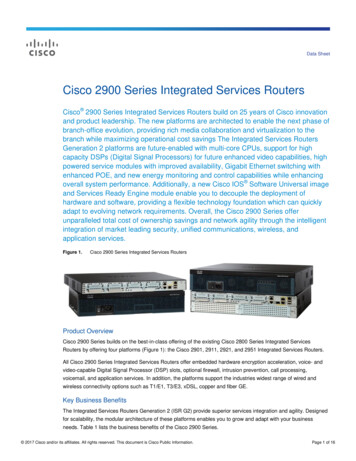
The Industry Standard In Infrastructure MonitoringNetwork AnalyzerConfiguring Switches And Routers To Send Netflow DataConfiguring A Cisco ASA Series FirewallThese settings will allow terminal based configuration of most Cisco ASA devices. In this particular example,the flows are being exported to the collector at 192.168.5.191 on port 9911. Specifies a 1 minute scheduleof sending data to the collector. It also allows for multiple smaller flows to be included in a single transmission.The Netflow syslogging functionality is also disabled, although this is entirely optional.An access-list is created to allow Netflow traffic to be collected on all interfaces. A new class-map is alsocreated for Netflow exporting, that matches the access-list. The global-policy policy-map is entered, and mapsthe netflow-export-class to the global-policy. Finally setting all NSEL types to be exported to the collectorserver.Note: You will want to replace your Nagios Network Analyzer IP address for 192.168.5.191 and thespecific port you want to use for 9911.enableconfigure terminalflow-export destination inside 192.168.5.191 9911flow-export template timeout-rate 1flow-export delay flow-create 60logging flow-export-syslogs disableaccess-list netflow-export extended permit any anyclass-map netflow-export-classmatch access-list netflow-exportpolicy-map global-policyclass netflow-export-classflow-export event-type all destination192.168.5.191exitNow all Netflow data is configured to be sent to the Network Analyzer collector for further analysis.1295 Bandana Blvd N, St. Paul, MN 55108 sales@nagios.com US: 1-888-624-4671INTL: 1-651-204-9102www.nagios.com 2017 Nagios Enterprises, LLC. All rights reserved. Nagios, the Nagios logo, and Nagios graphics are the servicemarks, trademarks, orregistered trademarks owned by Nagios Enterprises. All other servicemarks and trademarks are the property of their respective owner.Page 3 / 9Updated – February, 2019
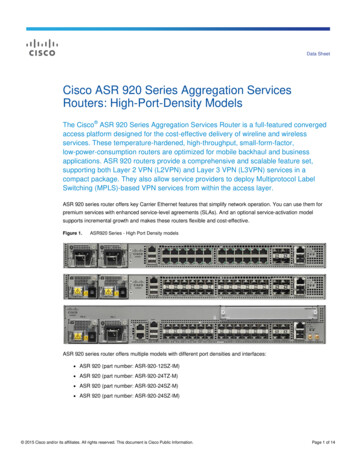
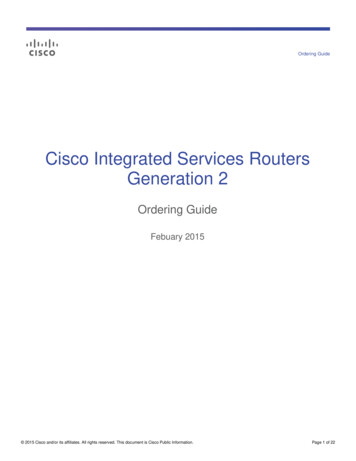
The Industry Standard In Infrastructure MonitoringNetwork AnalyzerConfiguring Switches And Routers To Send Netflow DataConfiguring A Cisco 4500 Series With WS-X45-SUP8-E Supervisor EngineThese settings is for a Cisco 4500 Series With WS-X45-SUP8-E Supervisor Engine. In this particularexample, the flows are being exported to the collector at 192.168.5.191 on port 9913. This example onlysends the flow information for the interface called GigabitEthernet 1/3/1.flow exporter e1!destination192.168.5.191transport udp 9913!flow record r1match ipv4 source addressmatch ipv4 destination addresscollect counter bytes longcollect counter packets longcollect timestamp sys-uptime firstcollect timestamp sys-uptime last!flow monitor m1record r1exporter e1cache timeout active 60cache timeout inactive 30cache entries 1000!interface GigabitEthernet 1/3/1ip flow monitor m1 layer2-switched input!1295 Bandana Blvd N, St. Paul, MN 55108 sales@nagios.com US: 1-888-624-4671INTL: 1-651-204-9102www.nagios.com 2017 Nagios Enterprises, LLC. All rights reserved. Nagios, the Nagios logo, and Nagios graphics are the servicemarks, trademarks, orregistered trademarks owned by Nagios Enterprises. All other servicemarks and trademarks are the property of their respective owner.Page 4 / 9Updated – February, 2019
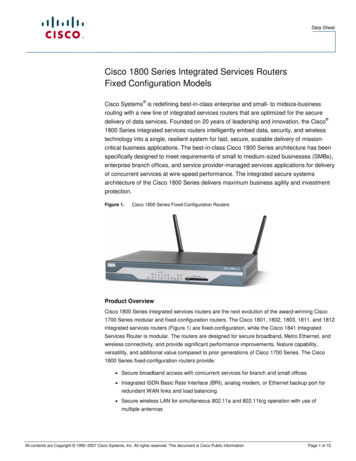
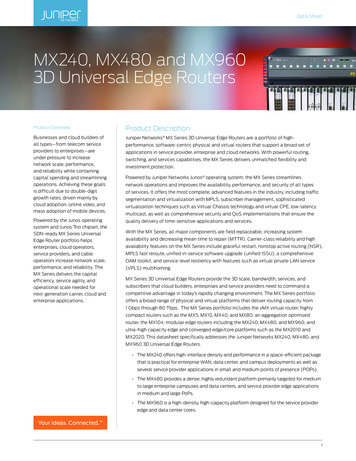
The Industry Standard In Infrastructure MonitoringNetwork AnalyzerConfiguring Switches And Routers To Send Netflow DataNote: You will want to replace your Nagios Network Analyzer IP address for 192.168.5.191 and thespecific port you want to use for 9913.Now all Netflow data is configured to be sent to the Network Analyzer collector for further analysis.Configuring A Cisco 3850These settings is for a Cisco 3850. In this particular example, the flows are being exported to the collector at192.168.5.191 on port 9914. This example only sends the flow information for the interface vlan 1.flow record Netflow1match ipv4 tosmatch ipv4 protocolmatch ipv4 source addressmatch ipv4 destination addressmatch transport source-portmatch transport destination-portmatch interface inputmatch flow directioncollect interface outputcollect counter bytes longcollect counter packets longcollect timestamp absolute firstcollect timestamp absolute last!flow exporter Netflow-to-Nagiosdestination192.168.5.191transport udp 9914flow monitor Netflow11295 Bandana Blvd N, St. Paul, MN 55108 sales@nagios.com US: 1-888-624-4671INTL: 1-651-204-9102www.nagios.com 2017 Nagios Enterprises, LLC. All rights reserved. Nagios, the Nagios logo, and Nagios graphics are the servicemarks, trademarks, orregistered trademarks owned by Nagios Enterprises. All other servicemarks and trademarks are the property of their respective owner.Page 5 / 9Updated – February, 2019
The Industry Standard In Infrastructure MonitoringNetwork AnalyzerConfiguring Switches And Routers To Send Netflow Dataexporter Netflow-to-Nagioscache timeout active 60record Netflow1vlan configuration 1ip flow monitor Netflow1 inputNote: You will want to replace your Nagios Network Analyzer IP address for 192.168.5.191 and thespecific port you want to use for 9914.Now all Netflow data is configured to be sent to the Network Analyzer collector for further analysis.1295 Bandana Blvd N, St. Paul, MN 55108 sales@nagios.com US: 1-888-624-4671INTL: 1-651-204-9102www.nagios.com 2017 Nagios Enterprises, LLC. All rights reserved. Nagios, the Nagios logo, and Nagios graphics are the servicemarks, trademarks, orregistered trademarks owned by Nagios Enterprises. All other servicemarks and trademarks are the property of their respective owner.Page 6 / 9Updated – February, 2019
The Industry Standard In Infrastructure MonitoringNetwork AnalyzerConfiguring Switches And Routers To Send Netflow DataFortiGate v5.2 and FortiGate v5.4 DevicesThese settings are for FortiGate v5.2 and FortiGate v5.4 devices. In this particular example, the flows arebeing exported to the collector at 192.168.5.191 on port 9915. You will need to change interfacename to suit your environment.Configuring the Netflow collector IP:config system netflowset collector-ip 192.168.5.191set collector-port 9915endEnabling Netflow on the Interface:config system interfaceedit interface name set netflow-sampler bothendNote: You will want to replace your Nagios Network Analyzer IP address for 192.168.5.191 and thespecific port you want to use for 9915.Now all Netflow data is configured to be sent to the Network Analyzer collector for further analysis.1295 Bandana Blvd N, St. Paul, MN 55108 sales@nagios.com US: 1-888-624-4671INTL: 1-651-204-9102www.nagios.com 2017 Nagios Enterprises, LLC. All rights reserved. Nagios, the Nagios logo, and Nagios graphics are the servicemarks, trademarks, orregistered trademarks owned by Nagios Enterprises. All other servicemarks and trademarks are the property of their respective owner.Page 7 / 9Updated – February, 2019
The Industry Standard In Infrastructure MonitoringNetwork AnalyzerConfiguring Switches And Routers To Send Netflow DataFortinet VDOM EnvironmentsThese settings are for Fortinet VDOM Environments. In this particular example, the flows are being exportedto the collector at 192.168.5.191 on port 9916. Refer to the comments in these commands to see whatspecific options need defining.Configuring the Global Config:con globalcon sys netflowset collector-ip 192.168.5.191set collector-port 9916set source-ip source-ip endendConfigure the VDOM:con vdomedit root---- root is an example, change to the required VDOM namecon sys interfaceedit wan1---- change the interface to the one to be usedset netflow-sampler bothendNote: You will want to replace your Nagios Network Analyzer IP address for 192.168.5.191 and thespecific port you want to use for 9916.Now all Netflow data is configured to be sent to the Network Analyzer collector for further analysis.1295 Bandana Blvd N, St. Paul, MN 55108 sales@nagios.com US: 1-888-624-4671INTL: 1-651-204-9102www.nagios.com 2017 Nagios Enterprises, LLC. All rights reserved. Nagios, the Nagios logo, and Nagios graphics are the servicemarks, trademarks, orregistered trademarks owned by Nagios Enterprises. All other servicemarks and trademarks are the property of their respective owner.Page 8 / 9Updated – February, 2019
The Industry Standard In Infrastructure MonitoringNetwork AnalyzerConfiguring Switches And Routers To Send Netflow DataFinishing UpThat completes the configuration for exporting Netflow data from enterprise grade switches and routers. Youare now ready to set up these machines as sources within Nagios Network Analyzer to receive the exportedNetflow data. For information about how to set up a source in Nagios Network Analyzer refer to the followingdocument:Understanding Sources And Sourcegroups In Network AnalyzerIf you have additional questions or other support related questions, please visit us at our Nagios SupportForums:https://support.nagios.com/forumThe Nagios Support Knowledgebase is also a great support resource:https://support.nagios.com/kb1295 Bandana Blvd N, St. Paul, MN 55108 sales@nagios.com US: 1-888-624-4671INTL: 1-651-204-9102www.nagios.com 2017 Nagios Enterprises, LLC. All rights reserved. Nagios, the Nagios logo, and Nagios graphics are the servicemarks, trademarks, orregistered trademarks owned by Nagios Enterprises. All other servicemarks and trademarks are the property of their respective owner.Page 9 / 9Updated – February, 2019
Once a router or switch is set up to export Netflow data, you will be able to create a source in Nagios Network Analyzer to monitor the captured Netflow data.

