Transcription
BMC ProactiveNetPerformance Management –Application DiagnosticsBMC, BMC Software, and the BMC Software logo are the exclusive properties of BMC Software, Inc., are registered with the U.S. Patent and Trademark Office,and may be registered or pending registration in other countries. All other BMC trademarks, service marks, and logos may be registered or pending registrationin the U.S. or in other countries. All other trademarks or registered trademarks are the property of their respective owners. 2009 BMC Software, Inc.All rights reserved.
BMC PROACTIVENET PERFORMANCE MANAGEMENT – APPLICATION DIAGNOSTICSTABLE OF CONTENTSIntroduction . 3Problem Isolation Challenges . 3Enter BMC ProactiveNet Performance Management - Application Diagnostics. 5Painless Deployment . 5Analysis: Starting with a Bird’s Eye View . 6Taking the Quick Dive . 6End-To-End Proactive Application Problem Management . 8Part of a Comprehensive Business Service Management Approach . 8Summary. 9Page 2
BMC PROACTIVENET PERFORMANCE MANAGEMENT – APPLICATION DIAGNOSTICSINTRODUCTIONBusiness applications are the lifeblood of your organization. When they fail, your company stands to loserevenue and reputation. You may often find yourself under immense pressure to instantly fix problems andrestore service, all while dealing with demanding management, employees, customers, and partners.To effectively handle the potential severe impact of application malfunctions, you have to carefully andconsistently manage your applications so that, if and when they fail, you have the tools to: Detect the problem “before the phone rings” Assign the right priority to the problem, based on how it might impact the business Isolate the root cause of the problem to determine which team needs to be engaged to diagnose andresolve the problemIn today’s dynamic IT environment, where each application is composed of hundreds of moving parts deployedin virtual and cloud environments, and where dynamic business requirements dictate constant change, rootcause isolation is a key challenge. Wrestling with the inherent complexity of today’s distributed Webapplications, most organizations find themselves going through “all hands on deck” exercises when problemsarise, disrupting process-based operations and wasting the time of expert IT staff.BMC ProactiveNet Performance Management - Application Diagnostics empowers IT staff to quickly isolate thecause of problems in custom distributed applications, thereby eliminating finger-pointing and slashing problemresolution time.BMC ProactiveNet Performance Management - Application Diagnostics gathers data from Java EE and .NETapplication servers to provide you with the visibility you need to determine which component of my applicationis causing the problem?” Since BMC ProactiveNet Performance Management - Application Diagnostics takesthe guesswork out of the equation; you can now escalate incidents to their appropriate owners and eliminateinefficient and frustrating “war room” situations.BMC ProactiveNet Performance Management - Application Diagnostics extends BMC’s Proactive ApplicationPerformance Management capabilities by providing deep dive application problem isolation and diagnosis;complementing both our existing application, database, and middleware performance monitoring (BMCMiddleware Management and BMC ProactiveNet Performance Management – Application, Database, andMiddleware) and our end user experience monitoring for real user transactions (BMC ProactiveNetPerformance Management - Real Transactions) and synthetic user transactions (BMC ProactiveNetPerformance Management - Synthetic Transactions). Together, these products deliver the industry’s onlyproactive application performance management solution -- delivering early problem identification with rapidproblem isolation and resolution.This paper presents the challenges of problem isolation and introduces BMC ProactiveNet PerformanceManagement - Application Diagnostics.PROBLEM ISOLATION CHALLENGESWith IT as an enabler of your organization’s business processes, you are most likely using Java EE or .NETapplication servers for backend business logic processing, as well as for integration of your enterpriseapplications and for Web based applications. These application environments, while providing numerousadvantages, also add several levels of complexity that make problem isolation a formidable challenge.The architecture of Java EE and .NET-based applications is multi-tier, relying on multiple networkedcomponents, such as client machines, load balancers, firewalls, Web servers, application servers, securityservers, transaction servers, and database servers. The application server, in itself, is a highly componentizedentity. Increasingly, applications are being virtualized and deployed in cloud computing environments, addingadditional infrastructure components to manage.Add to the inherent complexity of distributed and virtualized applications the frequent changes theseapplications go through due to regular maintenance, fixes, and new business requirements and it is easy to seewhy proper application performance management is vital.Hopefully, you are already using BMC ProactiveNet Performance Management to proactively manage your endto end application performance and availability. BMC ProactiveNet Performance Management automaticallyPage 3
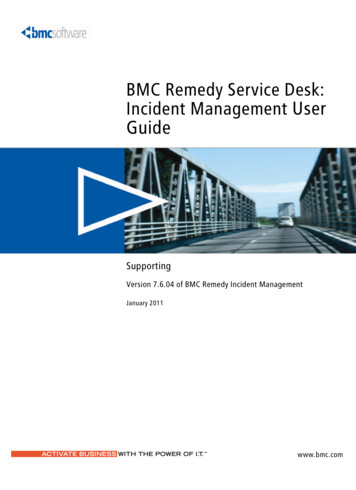
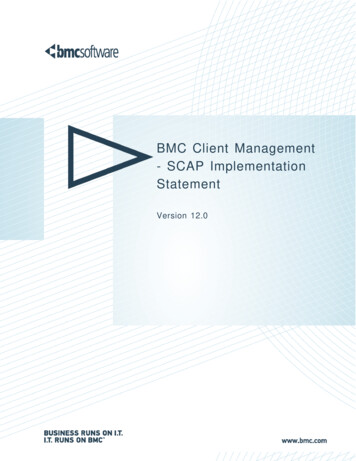
BMC PROACTIVENET PERFORMANCE MANAGEMENT – APPLICATION DIAGNOSTICSlearns the normal and seasonal patterns of behavior of your applications infrastructure and end-userexperience in order to accurately identify performance degradations and predict when potential problems mightoccur in the future. Figure 1 shows a typical list of performance events, failures, or predictive alerts generatedbased on the learned behavior of your applications and their supporting infrastructure. In addition, your servicedesk may already be using BMC IT Service Management (ITSM) as your first line of contact with customersand users. However, when an alert is raised — either through an alert from BMC ProactiveNet PerformanceManagement or a third party monitoring tool, or in the worst case (if you aren’t monitoring end userexperience), after end users call to complain — it is imperative to first assign the appropriate priority (based onbusiness impact), then isolate the tier or component that is causing the problem, and finally assign the problemto the right person.Figure 1. BMC ProactiveNet Performance Management generates intelligent performance and predictive events when itdetects ‘abnormal’ application behavior indicating current or potential degraded performance or failures.Nevertheless, running distributed applications composed of so many different moving parts means that multipleteams touch the application, including the IT operations staff who manage the servers, the DBAs who set upthe database, the security engineers who own firewalls and authentication servers, the mainframe systemadministrators, the network administrators, and others.For example, when a bank employee attempts to execute a transaction and receives poor performance, whodo you blame? Was this a network hiccup? Insufficient application server connection pools? An overloadedbackend server? A bug in a Java EE component? Etc.The traditional method for addressing critical problems is to summon representatives from all functional teams(both within and outside the organization), shut them in a big meeting room, and let them “figure it out.” Perindustry analysts, on average, 10-14 people are involved when a single service outage occurs.Traditional problem analysis is based on vast amounts of log files, memory dumps, end-user reports,performance monitoring statistics, and guesswork.Needless to say, traditional problem isolation methods are extremely inefficient. With little data (or too muchirrelevant data) to go on, finger-pointing is common, and IT staff often spend more time proving their innocenceon problems that have nothing to do with their domain. For example, some database transactions may not beprocessed due to incorrect configuration of the application server or a bug in a Java EE component; henceDBAs would waste their time sitting in the “war room.” Even worse, the lack of clear visibility into applicationtransaction execution means longer mean-time-to-repair (MTTR), thereby increasing the costs of applicationproblems.To fully address problem isolation and minimize business disruptions, you need reliable probable root causeinformation with detailed diagnostic data. And you need it fast, every single time a problem occurs. BMCProactiveNet Performance Management provides on-demand probable cause analysis to quickly isolate thePage 4
BMC PROACTIVENET PERFORMANCE MANAGEMENT – APPLICATION DIAGNOSTICSmost likely cause of performance issues or failures. When the likely cause exists in the application layer, furtherdiagnosis is required.ENTER BMC PROACTIVENET PERFORMANCE MANAGEMENT - APPLICATIONDIAGNOSTICSBMC ProactiveNet Performance Management - Application Diagnostics helps IT operations and applicationsupport staff to isolate problems in distributed applications running in Java EE, Microsoft .NET, or COM/COM application environments.By quickly determining where the root cause of the problem lies, the product enables IT staff to route theproblem to the appropriate domain expert for rapid resolution. As the need to involve multiple IT groups todiagnose the problem is eliminated, the entire problem resolution process is expedited, service is restoredpromptly, and end users are either unaware that a problem was averted or simply satisfied that they areproductive again.MAIN COMPONENTSBMC ProactiveNet Performance Management - Application Diagnostics consists of the following maincomponents:AGENTSBMC ProactiveNet Performance Management - Application Diagnostics agents are lightweight software agentsdeployed on Java EE or .NET application servers. Their primary role is gathering diagnostic data on applicationtransaction performance, execution, and errors. These agents are based on the BMC AppSight Black Boxpatented technology and provide deep application diagnostics for inclusion in application root cause analysis.SERVERThe BMC ProactiveNet Performance Management - Application Diagnostics Server is a middle-tier componentthat connects the agents and the BMC ProactiveNet Performance Management server, and provides access tocaptured data.CONSOLEThe BMC ProactiveNet Performance Management - Application Diagnostics analysis data is available in theBMC ProactiveNet Performance Management web console.PAINLESS DEPLOYMENTWhen business applications fail to perform, IT needs to act quickly to restore service. It is essential that anytool used in the course of the problem isolation and resolution process is easy to deploy and use. After all, ITstaff needs to spend its time finding the root cause and fixing the problem rather than setting up supportingtools.BMC ProactiveNet Performance Management -Application Diagnostics requires no change to monitoredapplication environments. You do not need to modify Java EE application server startup scripts, run a specialversion of the Java Virtual Machine (JVM) or Common Language Runtime (CLR), or change application code.You can install BMC ProactiveNet Performance Management - Application Diagnostics agents through thecommand line or by using any existing deployment tools. The Java EE version of the agent is packaged as anEAR file and can be deployed using the Java EE application server Administrator console. The Windows/.NETversion is packaged a Windows service that can be easily deployed directly or through your standard softwaredistribution processes and tools.Page 5
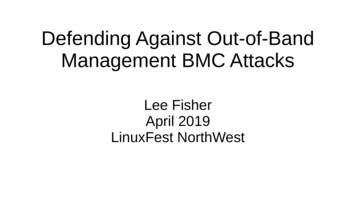
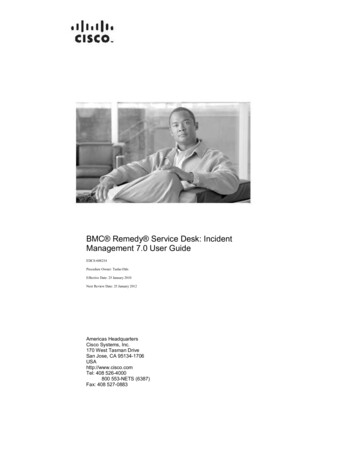
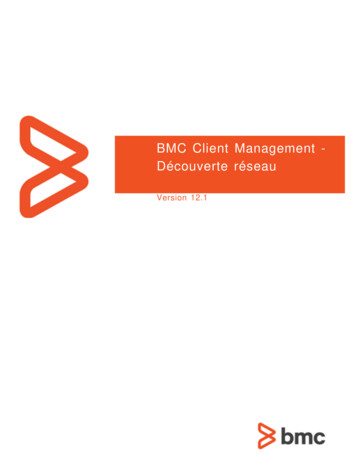
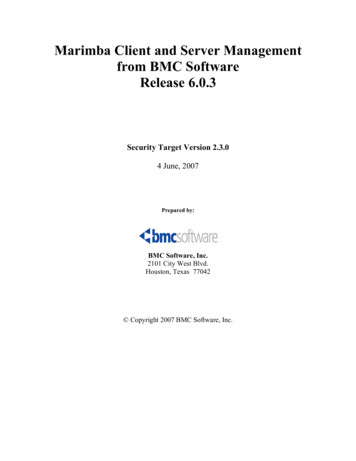
BMC PROACTIVENET PERFORMANCE MANAGEMENT – APPLICATION DIAGNOSTICSAfter installing the agents, you can get started with gathering transaction execution data from your application.BMC ProactiveNet Performance Management - Application Diagnostics, designed with special focus onsimplicity, comes with predefined configurations for monitoring all common distributed applicationenvironments; hence no scripting or special customization is involved. The tool’s ease-of-use enables a highlevel of flexibility, allowing users to choose between running agents continuously or deploying and runningthem only when problems occur.ANALYSIS: STARTING WITH A BIRD’S EYE VIEWThe location of a problem’s root cause is rarely known when analysis begins. Therefore, you have to start bylooking at the big picture and finding “suspect” tiers or components before drilling down. The TechnologyBreakdown view shown in Figure 2 provides you with exactly that. It displays duration data on transactionperformance as recorded from within the application server. Using this view, you can easily spot slowperforming transaction categories and determine which tier may have caused the issue.For example, an application support engineer charged with isolating root cause of a problem in an online JavaEE based trading application may find that a certain type of account verification transaction performs poorlywhen compared to other transactions or to historical performance data. Application transaction performancebreakdown shows that the majority of time was spent on the database side.Figure 2. Probable Cause Detailed Diagnostics include application technology breakdown to quickly isolate where thetransaction is spending the most time.TAKING THE QUICK DIVEWhile a high-level view is a good starting point for analysis, it hardly ever suffices for root cause isolation, as itonly tells part of the story. Before making the final determination as to where the root cause lies, you need toinvestigate problematic transactions and understand their actual execution performance at a more granularlevel.Rather than executing a different tool to gather more detailed information or sift through long server logs, BMCProactiveNet Performance Management - Application Diagnostics lets you drill-down into the problematictransaction invocations at a click of a button.The tool’s Application Transaction Breakdown view presents actual transaction execution, including fulltransaction execution path — SQL queries, EJB calls, Servlets, JSPs, JMS, JCA, JTA, JNDI, ASP/Xs,COM/COM , and more — made in the context of the transaction. Performance data is displayed for each of thetransaction steps. Figure 3 illustrates some of the application components that might be displayed whenapplication performance degradation occurs.Page 6
BMC PROACTIVENET PERFORMANCE MANAGEMENT – APPLICATION DIAGNOSTICSFigure 3. The Transaction Breakdown listed in the Invocation Tree pinpoints the components within the transaction causingthe performance degradation.To continue our example, the support engineer selected to zoom in on the account verification transaction. Thesupport engineer now focuses on the Transaction Breakdown and notices that a certain type of JDBC call takesan exceptionally long time to complete, and throws an exception. BMC ProactiveNet Performance Management-Application Diagnostics displays the full SQL query as sent to the database, helping the support engineerrealize that it goes out to an external database on a company’s partner extranet. When an incident is escalated,a simple mouse click allows the developer to drill down further to the actual line of code details and parametervalues that existed at the time the degradation occurred; as depicted in Figure 4,Instead of spending countless hours and many people’s time, the problem is now accurately isolated andescalated to the partner’s help desk team for resolution.Page 7
BMC PROACTIVENET PERFORMANCE MANAGEMENT – APPLICATION DIAGNOSTICSFigure 4. Deep dive diagnostic drilldown into BMC AppSight shows the parameter values, object state and lines of code forbetter root cause analysis by application developers.END-TO-END PROACTIVE APPLICATION PROBLEM MANAGEMENTBMC ProactiveNet Performance Management - Application Diagnostics addresses one of the fundamentalchallenges in management of distributed applications. However, an end-to-end solution also has to addressproblem detection and problem management.Application problems are automatically detected through a powerful combination of component monitorscoupled with real and simulated end-user monitoring, and analyzed with predictive analytics. BMC ProactiveNetPerformance Management analyzes the performance and availability of all infrastructure components as wellas real and synthetic end user experiences, and alerts IT staff when degraded performance occurs. It can alsowarn IT staff about a potential problem in the next few hours, based on recent and current trends in system andapplication behavior. BMC ProactiveNet Performance Management provides on-demand probable causeanalysis for every event, ensuring IT staff have enough information available to quickly isolate the root cause ofperformance issues so they can be assigned to the right person to resolve the issue as quickly and efficientlyas possible.Once a problem is detected, an alert is routed through BMC ProactiveNet Performance Management to BMCEvent and Impact Manager, where the IT Operations staff performs an initial analysis of the incident and itsbusiness impact. The high-level snapshot provided by these products enables the IT staff to determine theseverity of the problem, as well as the location and application in which it occurred. Finally, BMC ProactiveNetPerformance Management - Application Diagnostics is used for quickly isolating problems and routing them tothe appropriate person or team.PART OF A COMPREHENSIVE BUSINESS SERVICE MANAGEMENT APPROACHBusiness Service Management (BSM) is the most effective approach for managing IT from the perspective ofthe business. BSM helps your IT organization do more of what supports the business and less of what doesn’t.Page 8
BMC PROACTIVENET PERFORMANCE MANAGEMENT – APPLICATION DIAGNOSTICSWith BSM, you will reduce cost, lower risk of business disruption, and benefit from an IT infrastructure built tosupport business growth and flexibility.BMC ProactiveNet Performance Management - Application Diagnostics follows IT Infrastructure Library (ITIL)guidelines on problem investigation and diagnosis, and helps you achieve BSM by: Optimizing problem isolation and diagnosis processes across the organization Minimizing the impact of application problems on business processes by quickly restoring servicelevels upon failureSUMMARYBMC ProactiveNet Performance Management - Application Diagnostics isolates problems in distributed JavaEE and .NET applications, helping you to: Reduce escalations to Level 3 support Diagnose and fix problems faster Improve process efficiencies Increase availability and performance of critical business applicationsTo learn more about BMC ProactiveNet Performance
complementing both our existing application, database, and middleware performance monitoring (BMC Middleware Management and BMC ProactiveNet Performance Management – Application, Database, and . tool